

in-future
The US Dollar Index (DXY) was at the highest level in a little over twenty years on Monday, bringing the total rally off of the January 2021 low to +21.8%. While that is a notable new high, a massive reason for the move has been a result of the euro, as it is now back to parity with the dollar. The composition of the dollar index places a massive 57.6% weight on the euro, meaning swings in EURUSD largely impact DXY. As shown in the chart below, the dollar index just hit another multi-year high on Monday and is back to levels last seen in the early 2000s.
US Dollar Index (Author)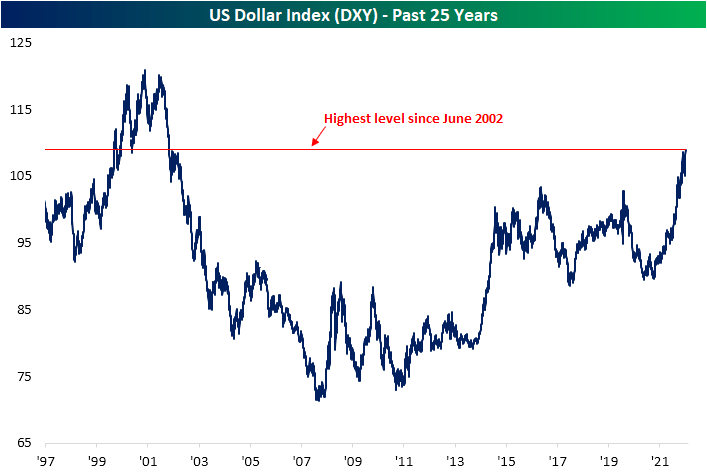
A stronger dollar hurts companies that generate larger portions of their revenues outside of the US, and we’ve seen that play out in terms of stock market performance during the dollar’s 18+ month rally. We keep track of geographic revenue exposure for stocks in the Russell 1,000 in our International Revenues Database. Below we show the average performance of Russell 1,000 stocks that generate 50% or more of their revenues outside of the US since the Dollar Index’s low in January 2021. We also show the average performance of Russell 1,000 stocks that generate 90%+ of their revenues domestically, which should benefit from a stronger dollar. As shown, the average “domestic” stock in the Russell 1,000 has risen 16% during this dollar rally, while the group of internationals (stocks with over half of their revenues generated outside the US) have risen less than 3%. As for the rest of the stocks in the index which do not fall into either category, the average gain has only been 4.62%.
Average Performance Since January 2021 Dollar Low (Author)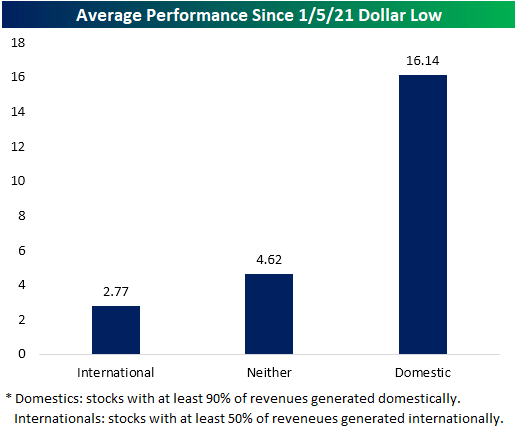
Taking a more granular look, below we break down the Russell 1,000 into equal-sized deciles based on the international revenue exposure, with the 10th decile comprised of stocks with 100% of revenues generated domestically. Again, those groups with high domestic revenues are massively outperforming, with the ninth and tenth deciles having experienced rallies of 14.15% and 17.47%, respectively. The other end of the spectrum have seen low-single digit rallies and even a modest 22 bps decline for the third decile.
Russell 1000 Deciles: Domestic Vs. International Revenues (Author)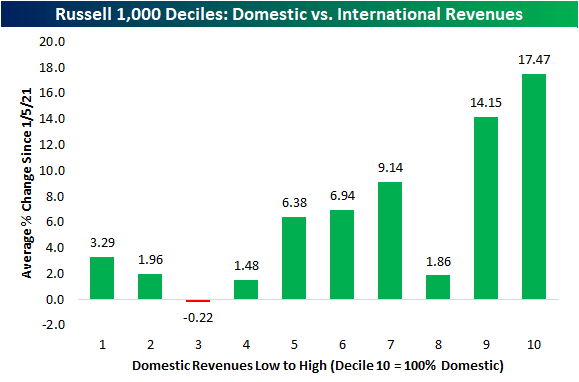
Given the nature of various businesses, some sectors naturally will have greater domestic/international revenue exposures than others. For example, Utilities and Real Estate whose operations are largely within the US have nearly all of their revenues generated domestically. At the same time, these two defensive groups have been some of the top-performing sectors since the dollar’s low. Energy has posted much stronger returns than any other sector, while it also has the fourth-highest domestic revenue exposure behind Financials. Materials and Tech have the lowest share of revenues generated within US borders, while their returns since last January have been middling.
Russell 1000 Sector Performance Vs. Percentage Of Domestic Revenues (Author)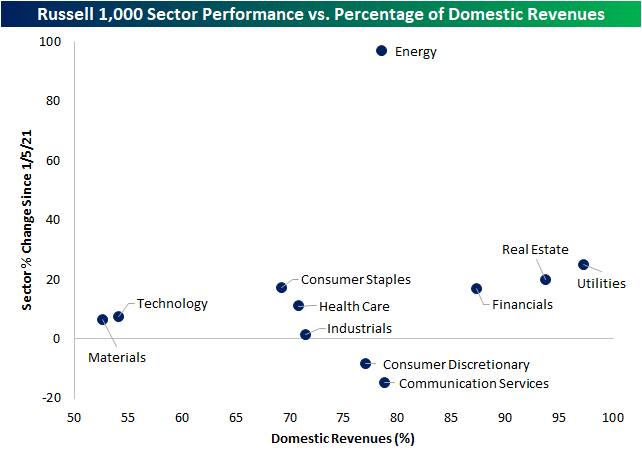
Editor’s Note: The summary bullets for this article were chosen by Seeking Alpha editors.
Be the first to comment