

DamienGeso/iStock via Getty Images
Dolby Laboratories – A Wide-Moat Business That Surrounds Us All
Dolby Laboratories, Inc. (NYSE:DLB) is a well-known but underfollowed company specializing in audio and imaging technologies, such as noise reduction, encoding and compression, spatial audio and high-dynamic range (HDR) imaging. The company’s technologies are probably best known from (currently less frequented) cinemas and home theaters, which rely on Dolby’s products to a significant extent. It is hard to imagine that there are people who have never heard of the company or used its products – intentionally or unintentionally. The most prominent technologies owned by Dolby, often in conjunction with other patent holders, are:
- Dolby Atmos: an object-oriented audio technology that allows sound to be precisely placed and moved anywhere in the listening environment; it is typically employed in cinemas
- Dolby Digital – an audio codec technology used in multichannel applications
- Dolby TrueHD – an audio codec technology for lossless encoding
- Dolby Vision – a HDR imaging technology typically employed in cinemas
- AAC and HEVC – digital audio and video codecs with superior bandwidth efficiencies; AAC is the default audio format for, e.g., iPhone, iPod, iPad, YouTube Music and iTunes
According to Dolby’s annual report, the company is generating most of its revenues through licensing of its technologies. Only 5% of 2021 revenues were attributed to the sale of products and services. This sets the company up for high profits and implies a very asset-light business model with low capital expenditures. Dolby uses four licensing models that differ in their royalty and licensing fees, and their payment structures: a two-tier licensing model, integrated licensing, patent licensing, and collaboration arrangements.
Dolby’s revenues are predominantly generated in the broadcasting business (televisions and set-top boxes, 39% of 2021 revenues), the mobile business (smartphones and tables, 22% of 2021 revenues) and in the consumer electronics business (Blu-ray devices, soundbars, audio-video receivers, 15% of 2021 revenues). Interestingly, 12% of Dolby’s 2021 revenues were generated through technologies licensed via Windows and macOS operating systems. So Dolby is a relatively silent beneficiary of the digital revolution and consumers’ seemingly unquenchable thirst for the latest and greatest gear.
At the end of fiscal 2021, Dolby had approximately 1,400 trademark registrations, 15,500 issued patents and approximately 4,000 pending patent applications throughout the world. The company’s patented technologies will lose their exclusivity over the next 23 years. This is indicative of a wide moat but Dolby is certainly required to continually file new patent applications or develop entirely new patented technologies to maintain its competitive advantage. Dolby’s wide moat is further underscored by the fact that some of its technologies, such as Dolby Digital and Dolby Digital Plus are even mandated for terrestrial broadcasts in several countries. The brands’ dominance in modern consumer electronics also makes it easy to understand why its technologies have become the de facto industry standard in many areas.
Are Growth and Profitability Still Intact?
Due to the nature of the measures imposed by governments around the world to contain the spread of SARS-CoV 2 since early 2020, also Dolby saw its business impacted – mostly due to the closure of cinemas and venues. Fiscal 2020 revenues and operating earnings declined by 6.4% and 15% YoY, respectively. However, in fiscal 2021, revenues and earnings rebounded and grew at a two-year compound annual growth rate (CAGR) of 1.6% and 16%, respectively. Longer-term, the company has been growing its top-line at a relatively modest CAGR of 3% over the last decade.
In terms of margins, Dolby’s gross margin is high as expected for a licensing business. Over the last ten years, Dolby has averaged an exceptionally high 89% gross margin. However, the company’s operating margin, adjusted for (mostly immaterial) restructuring charges draws an entirely different picture: it declined from 45% in fiscal 2011 to around 25%, where it has stabilized since 2013 (Figure 1). This development is mainly attributed to increasing R&D expenses:
Figure 1: Dolby’s historical adjusted operating margin and research & development (R&D) expenses, in % of revenues (own work, based on the company’s 2011 to 2021 10-Ks)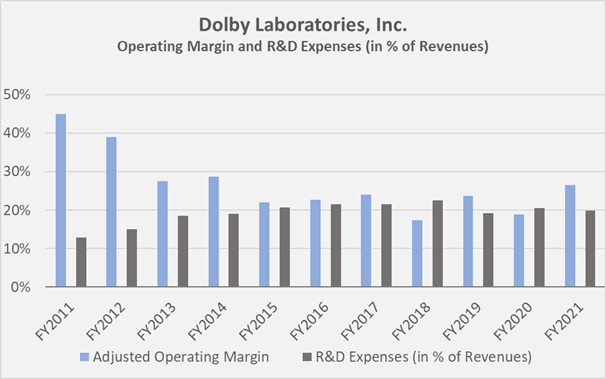
R&D expenses increased at a ten-year CAGR of 7.4% and selling, general, marketing and administrative expenses increased at a ten-year CAGR of 6.6%, both significantly outpacing revenues growth and hence suggesting that Dolby’s moat might not be that wide after all. However, a critical look at Dolby’s profitability in terms of return on invested capital (ROIC, based on net operating profit after taxes) and cash return on invested capital (CROIC, based on normalized free cash flow) proves that the company has returned to increasing and stabilizing profitability after several years of weakness (Figure 2).
Figure 2: Dolby’s historical ROIC and CROIC; note that the latter is based on normalized free cash flow, for which I smoothed working capital movements and accounted for stock-based compensation expenses and impairments (own work, based on the company’s 2011 to 2021 10-Ks)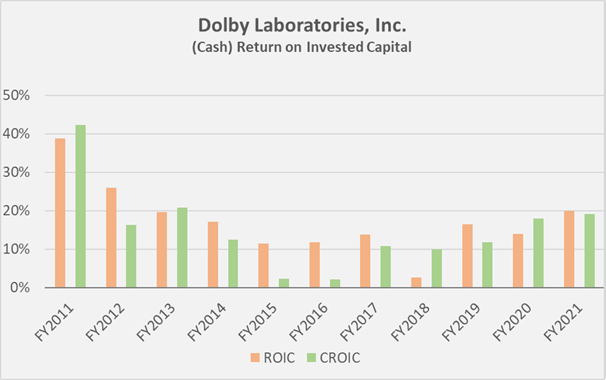
Going forward, the company expects to grow its top-line by 7% in 2022 (midpoint guidance) and its operating margin will likely remain stable in the mid-20% range. Samsung announced the adoption of Dolby Atmos in their TVs for the first time and Dell and ASUS will now support the combined Dolby Vision and Dolby Atmos experience in their latest PC line-ups. Also, Dolby is set to benefit from the electric vehicle boom, as electric car manufacturer NIO announced their new ET5 model will include Dolby Atmos.
Against the backdrop that Dolby has had some relatively difficult years, it seems worth noting that the company maintained a pristine balance sheet at least since 2011 (the first year included in my analysis). During this time, the company has not taken on any financial debt and even carries a considerable amount of cash on its balance sheet. Dolby is one of the rarely seen companies where the enterprise value (EV, currently $6.8 billion) is actually smaller than the market capitalization of currently $8.1 billion. Coming out of the pandemic, the company reported $1.23 billion in cash and cash equivalents, $39 million in short-term investments and $63 million in long-term investments. As a consequence, Dolby’s 2021 equity ratio was 84% and has remained at this remarkably high level over the last decade. This naturally translates to a relatively modest return on equity of currently 12%, which has remained relatively stable since 2013. Long-term oriented investors most certainly prefer such a comparatively low return on equity over an inflated ratio due to excessive use of financial leverage. Dolby’s balance sheet is also not tainted by excessive goodwill, which represents only 13% of shareholders’ equity or 11% of total assets. Over the last decade, Dolby’s cash flow statements did not reveal any material impairments of goodwill or other intangible assets. The company does not even carry a material amount of unfunded retirement obligations on its balance sheet.
Dolby declared and paid a special dividend of $4 per share in fiscal 2013 and began paying a regular quarterly dividend in fiscal 2015, increasing at a CAGR of 14% each year since its inception. Due to the pandemic, the company did not increase its quarterly dividend of $0.20 in November 2020, but announced an increase by 13.6% a year later. This behavior, the extremely high-quality balance sheet and the absence of material impairment charges are evidence of management’s conservative capital allocation strategy. The dividend payout ratio is typically around 30 to 40% in terms of normalized free cash flow and I hence consider the dividend very safe with ample room for growth. Although the current dividend yield of 1.3% is slightly above the long-term average yield, it is still relatively low and therefore does not represent a significant cash flow for investors in the foreseeable future, even if management continues to increase the dividend at the current pace.
Compensation of Shareholders and Executives
The company does also repurchase its own shares on a regular basis, however, only slightly offsetting the dilutive effect of stock-based compensations, which are very significant in the case of Dolby, at typically around 30 to 40% of adjusted operating income (Figure 3). The weighted-average number of shares outstanding, assuming dilution, declined from 113 million in 2011 to 105 million in 2021, which translates to an average annual reduction by 0.7%. The company recently announced that its board of directors has approved increasing the size of its stock repurchase program to approximately $506 million, which corresponds to slightly more than 6% of shares outstanding, assuming no issuance of stock rewards.
Figure 3: Dolby’s historical stock-based compensation expenses, in % of adjusted operating income (own work, based on the company’s 2011 to 2021 10-Ks)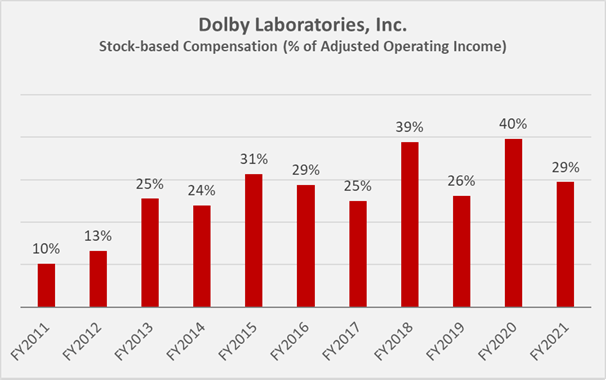
Why I Am Currently Not Interested In Owning Dolby Laboratories
Dolby is a great company with a wide economic moat. In principle, this is a business with very high profit margins, but it was (and still is) burdened by elevated research and development expenses and general costs, which impact operating profitability. I really like Dolby’s business model due to its asset-light character and the low capital expenditures of 30% of operatings cashflow on average over the last decade. However, I would want to see operational efficiency improve further, knowing what the company has been capable of in the past, before considering an investment in the company. Free cash flow is approaching levels not seen since 2011, so the company is apparently moving in the right direction, but the market has been quick to acknowledge this development:
Figure 4: Dolby’s historical normalized free cash flow (nFCF), compared to its market capitalization; note that I calculated year-end valuations by employing the share price observed in the month the company released full-year earnings (own work, based on the company’s 2011 to 2021 10-Ks and weekly closing share price data of DLB)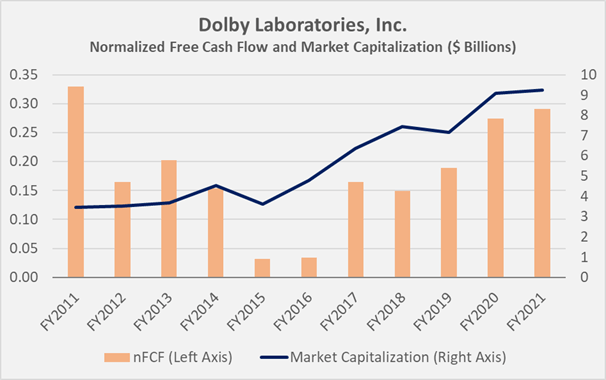
Even after the recent decline to around $77, the shares are still far from cheap, as is for example illustrated by the expansion of Dolby’s price-to-sales multiple from 3.6 in 2011 to around 6.3 as of today. Frankly, I would not expect a wide moat company like Dolby to trade at a discount for no apparent reason, and the still high valuation is likely due to the overall market being significantly overvalued.
Dolby’s normalized free cash flow yield declined from 9.5% in 2011 to 3.1% at the end of fiscal 2021 and currently stands at 3.6%. Taking the company’s net cash position into account yields a current enterprise value (EV) to EBITDA multiple of 16 which appears somewhat expensive compared to the ten-year average of 14. Ignoring the cash position, the company’s valuation in terms of price-to-EBITDA would have increased from around 7 in 2011 to 18 today.
I certainly wouldn’t mind paying such a price for a fast or at least moderately fast growing company, but given the 3% revenues CAGR and normalized FCF that has only recently returned to 2011 levels, I’d rather pass at a $77 share price. Also, the amount of stock awards granted to executives appears somewhat excessive given the company’s performance over the past decade.
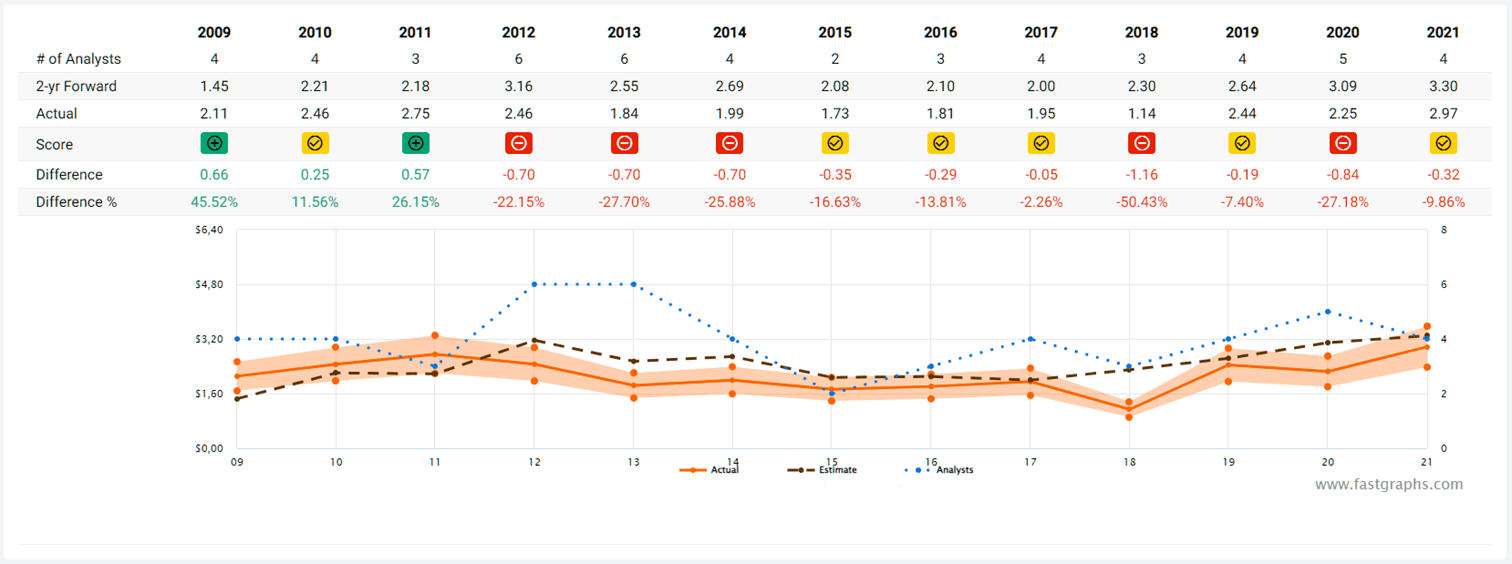
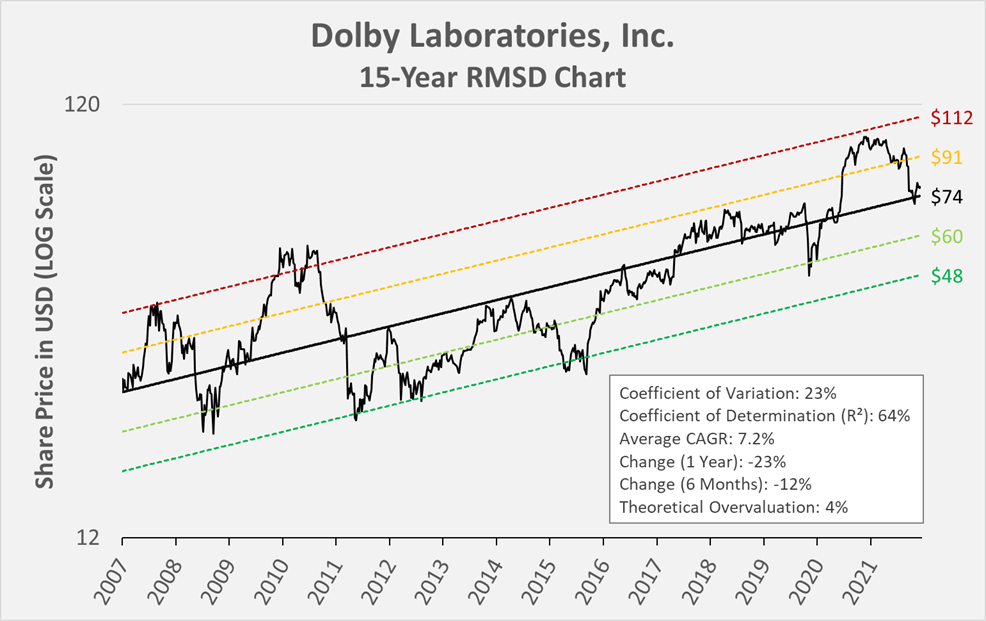
I realize that Dolby’s technology will likely be used in most upcoming consumer electronics devices and increasingly in automobiles, driving the company’s sales growth and promote diversification. However, since the company’s technology is mostly used in discretionary products or services, such as smart TVs, smartphones, electric vehicles and cinemas, I suspect Dolby stock could suffer significantly in a coming recession. Since I believe the likelihood of a recession is increasing, I am leaving Dolby on my watch list and may reevaluate accordingly. Dolby’s somewhat cyclical nature is also evident from the FAST Graphs chart in Figure 5. The growth forecast looks compelling, but it’s important to remember that the company has missed analysts’ estimates by a wide margin in recent years, as seen in the two-year forward analyst scorecard in Figure 6. Finally – and purely from the perspective of Dolby’s share price – I have included the 15-year RMSD chart, which also suggests that the shares are not a bargain right now, when compared to their long-term CAGR of 7.2% (Figure 7).
Figure 5: FAST Graphs chart for DLB, based on adjusted operating earnings (obtained with permission from FAST Graphs) Figure 6: FAST Graphs’ two-year forward analyst scorecard for DLB (obtained with permission from FAST Graphs; Copyright © 2022, Fastgraphs™ – All Rights Reserved) Figure 7: 15-year root-mean-squared deviation (RMSD) chart for DLB (own work, based on the weekly adjusted share price of DLB)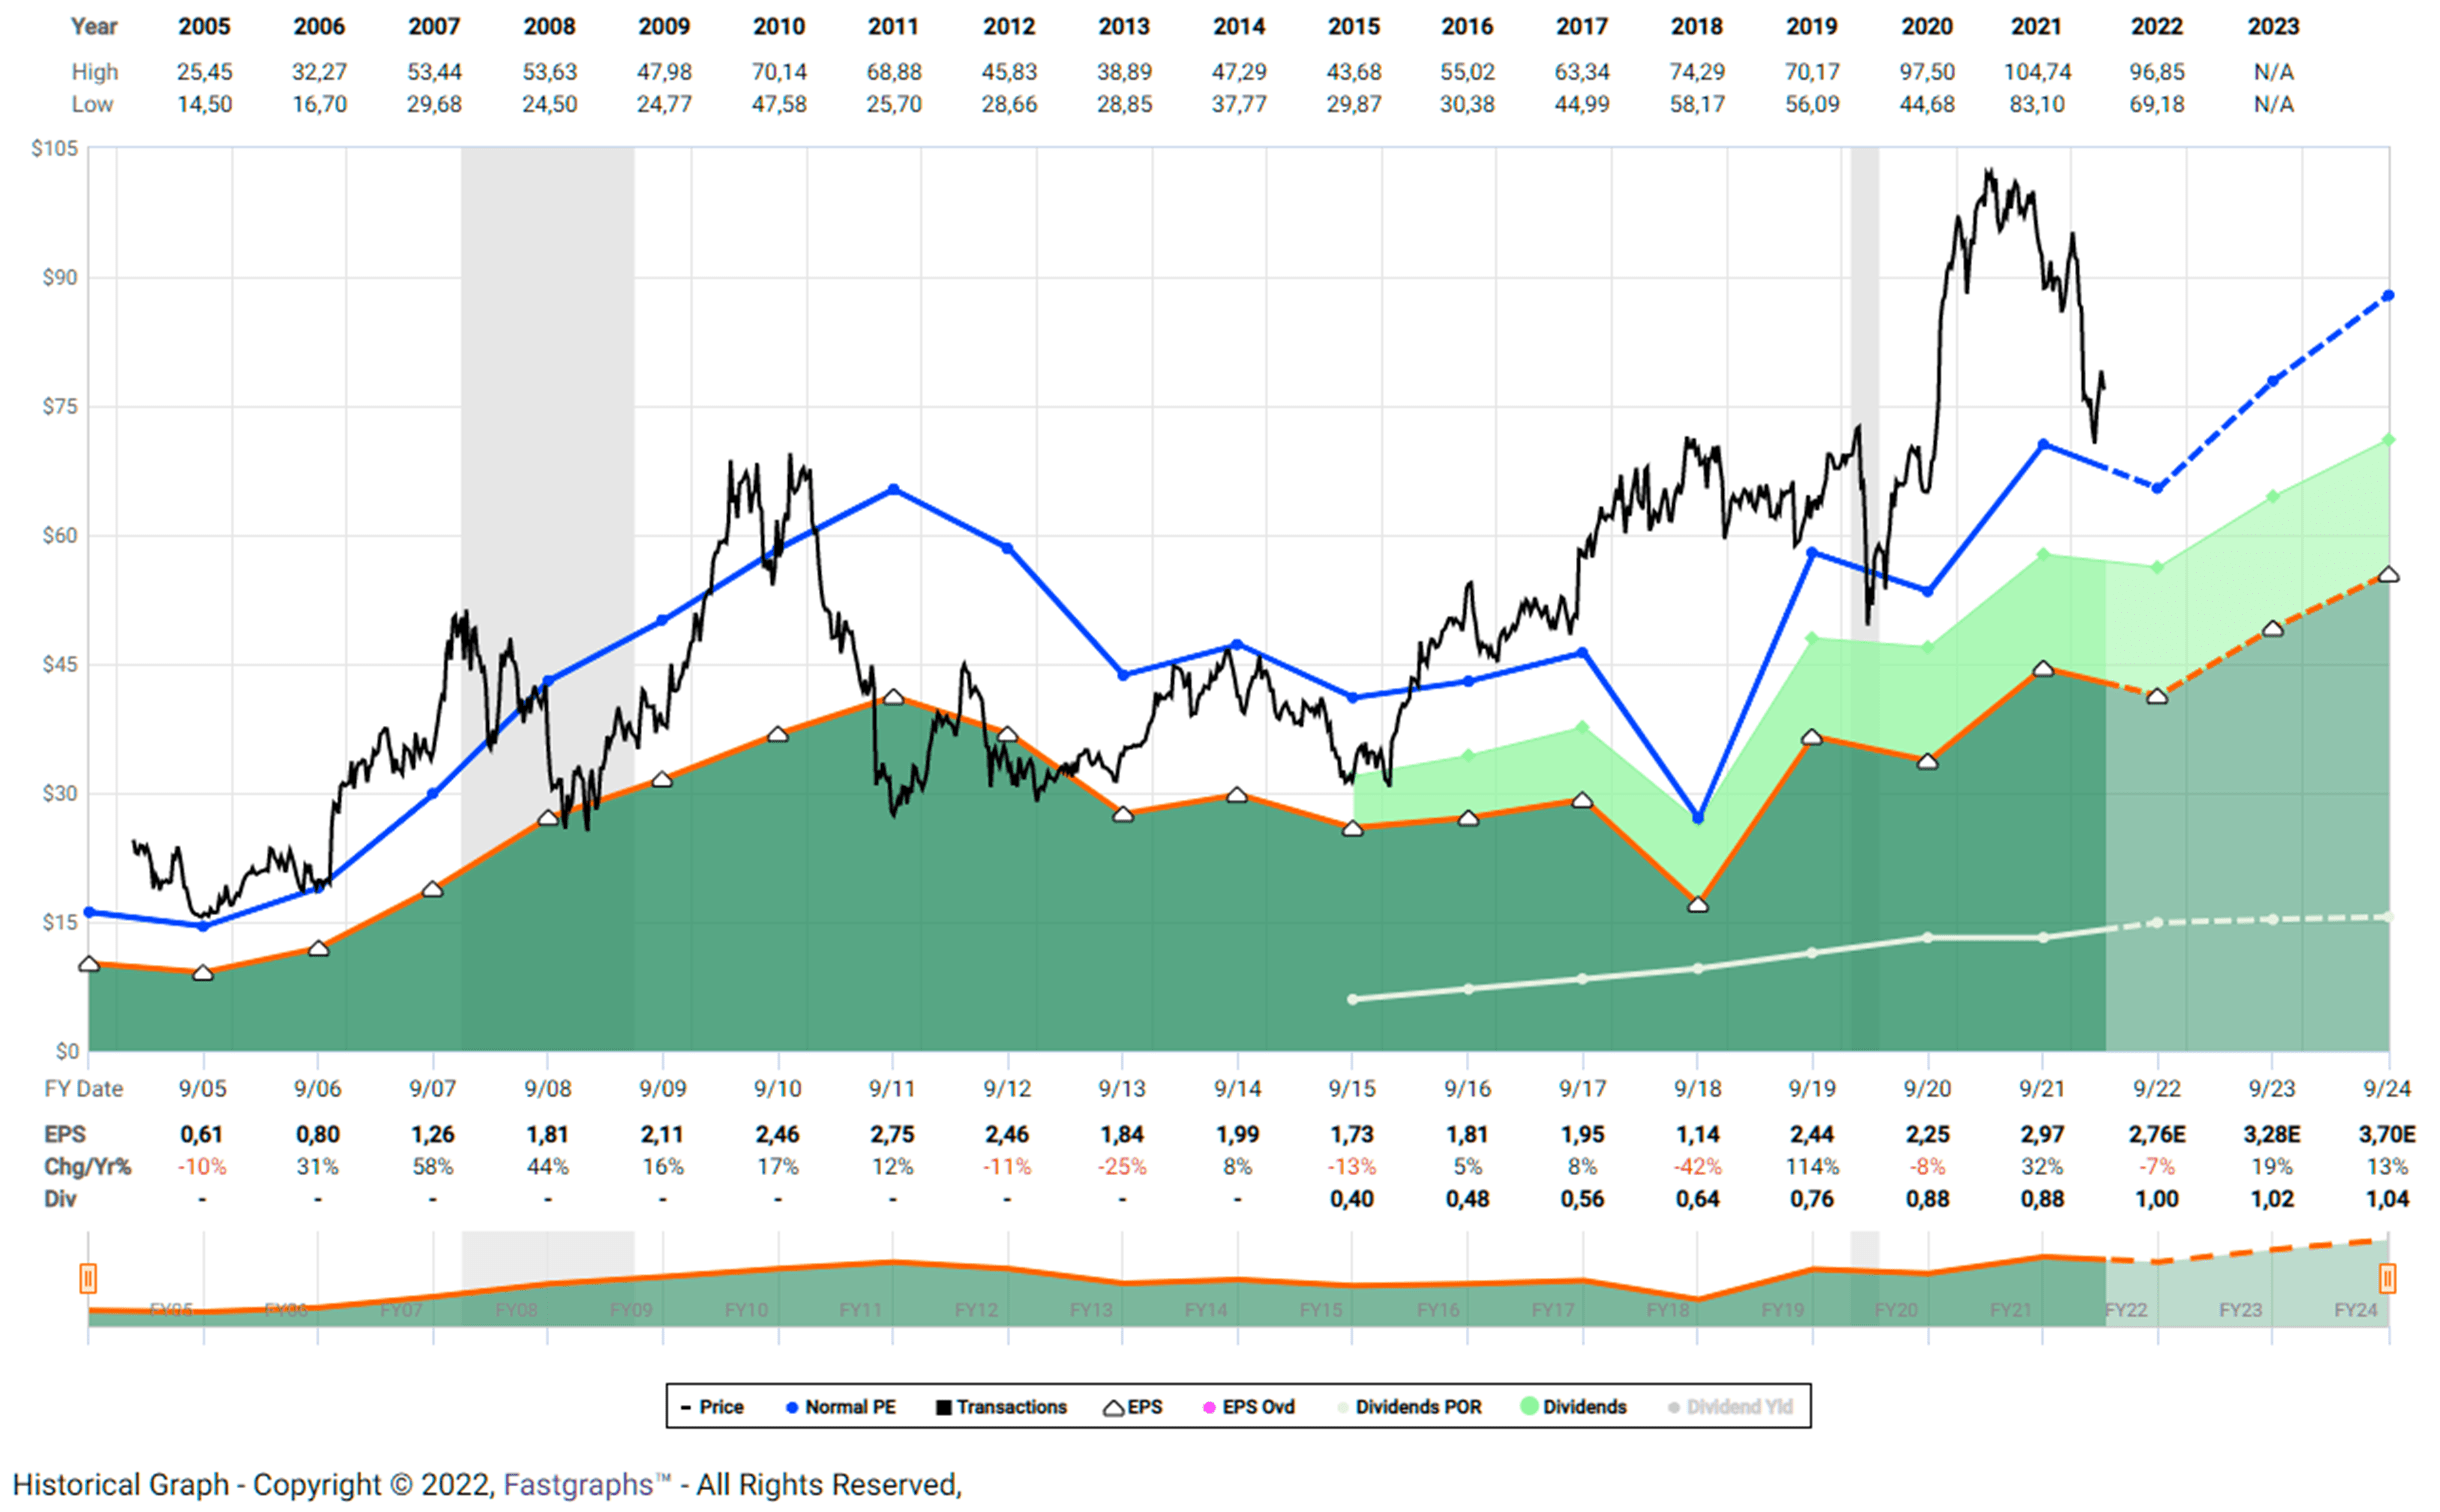
Thank you very much for taking the time to read my article. In case of any questions, I am very happy to read from you in the comments section below.
Be the first to comment