

Richard Drury
This dividend exchange-traded fund (“ETF”) article series aims at evaluating products regarding the relative past performance of their strategies and quality of their current portfolios. As holdings and their weights change over time, reviews may be updated when necessary.
DNL strategy and portfolio
The WisdomTree Global ex-U.S. Quality Dividend Growth Fund (NYSEARCA:DNL) has been tracking the WisdomTree Global ex-U.S. Quality Dividend Growth Index since 06/16/2006. It has a portfolio of 271 stocks, a distribution yield of 3.79% and a total expense ratio of 0.42%. As described in the prospectus by WisdomTree, eligible companies must meet the following criteria:
- incorporation in one of 15 developed European countries, Israel, Japan, Australia, Hong Kong or Singapore;
- at least $5 million in cash dividends on common stock (previous year);
- market capitalization of at least $200 million;
- average daily trading volume of at least $200,000 in the last 3 months;
- trading of at least 250,000 shares per month for each of the last 6 months.
Then, eligible companies “are ranked by dividend yield as adjusted by a composite risk score based on fundamental valuation, quality and momentum characteristics. Securities ranking in the highest 30% by dividend yield and top 80% by composite risk score are selected for inclusion (…). Securities are weighted in the Index based on dividends paid over the prior annual cycle.”
DNL mitigates risks by filtering stocks with fundamental and technical factors. Moreover, it guarantees diversification by fixing maximum weights on rebalancing: 5% by constituent, 25% by sector and country (15% for the real estate sector).
France, the U.K. and Denmark are the heaviest countries, almost in equal weight of 10%. The next chart lists the top 10 countries representing an aggregate weight of 75.4%. Regarding geopolitical risks, China, Hong Kong and Taiwan weigh 11.8% together.
DNL top 10 countries (Chart: author with WisdomTree data)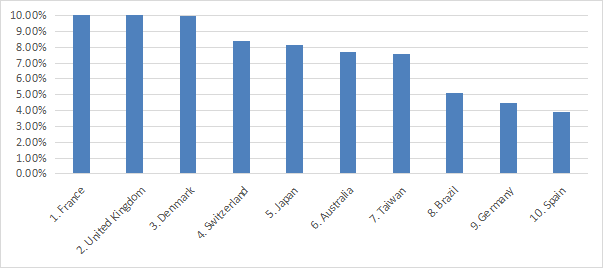
The top three sectors are material, consumer discretionary and technology, between 19% and 20% each. Then, come healthcare (15%) and industrials (13.6%). Other sectors are below 4%.
DNL sectors weights (Chart: author with WisdomTree data)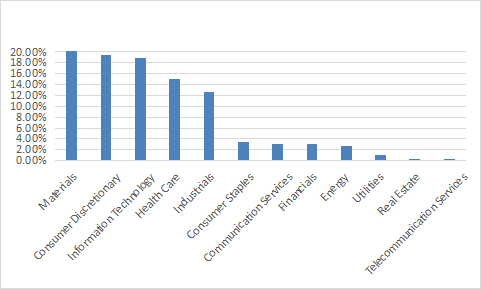
Large cap companies represent 83% of the portfolio and the rest is mostly in mid-caps. The top 10 holdings, listed below, represent 45.8% of asset value. Constituents are capped at 5% every time the underlying index is rebalanced, but price action may result in weight slippage. The top holding weighs 7.29% as of writing.
|
Name |
Ticker |
Weight % |
|
Novo Nordisk A/S |
NOVOB DC |
7.29% |
|
LVMH Moet Hennessy Louis Vuitton SE |
MC FP |
6.48% |
|
BHP Group Ltd |
BHP AU |
6.22% |
|
Anglo American PLC |
AAL LN |
5.59% |
|
Roche Holding AG |
RO SW |
4.00% |
|
Industria de Diseno Textil |
ITX SM |
3.70% |
|
Taiwan Semiconductor Manufacturing Co |
2330 TT |
3.65% |
|
Hapag-Lloyd AG |
HLAG GR |
3.11% |
|
Tokyo Electron Ltd |
8035 JT |
2.98% |
|
Vale SA |
VALE3 BS |
2.81% |
Past performance compared to competitors
International dividend ETFs launched before 2008 are rare. The next table compares DNL with the First Trust Dow Jones Global Select Dividend ETF (FGD) since January 2008.
|
since 1/1/2008 |
Total Return |
Annual.Return |
Drawdown |
Sharpe |
Volatility |
|
DNL |
79.99% |
4.11% |
-37.60% |
0.32 |
17.46% |
|
FGD |
50.27% |
2.83% |
-66.23% |
0.22 |
21.17% |
|
SPY |
273.61% |
9.44% |
-52.51% |
0.65 |
16.13% |
Data calculated with Portfolio123
DNL has beaten FGD by about 1.3 percentage points in annualized return. It also shows a much lower risk measured in drawdown and standard deviation of monthly returns (volatility). However, both have lagged the U.S. index S&P 500 (SPY) by a wide margin.
In the last 5 years (next chart), DNL has outperformed not only FGD, but also the Vanguard International Dividend Appreciation Index Fund (VIGI).
DNL vs. FGD vs. VIGI (Portfolio123)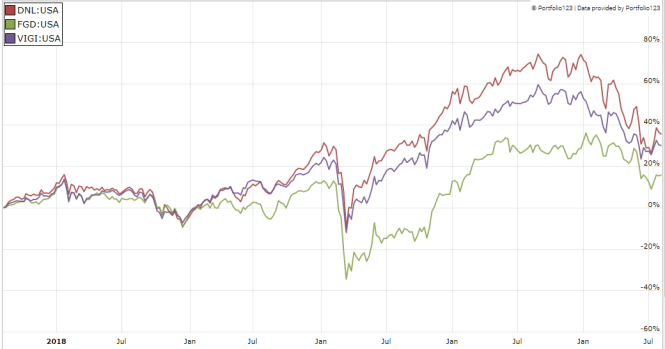
A newer fund is a closer competitor to DNL: the Schwab International Dividend Equity ETF (SCHY), launched in April 2021 and reviewed here. Like DNL, it is an ex-U.S. dividend ETF using risk-mitigation factors. In the last 12 months, SCHY has beaten DNL:
DNL vs. SCHY (Portfolio123)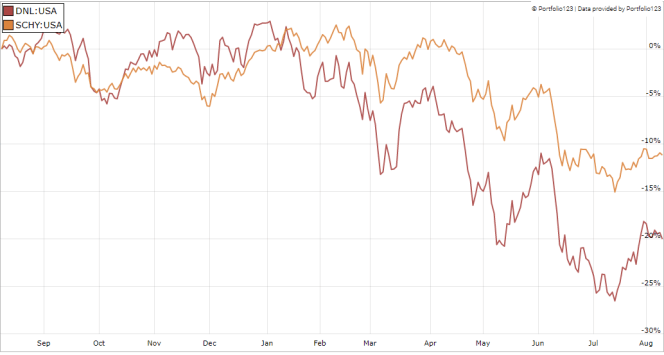
SCHY has a very short history. Past performance may not be representative of its behavior through a market cycle.
Takeaway
DNL has a portfolio of about 270 dividend stocks of large and mid-cap companies listed outside the U.S. The methodology filters constituents with fundamental and momentum factors, then set limits for the weights of constituents, sectors and countries. Asset value is 59% in Europe and direct exposure to geopolitical and regulatory risks related to China is about 12%. DNL shows a relatively low risk in drawdown and volatility since inception. It has outperformed some of its competitors in the last 5 and 15 years. However, SCHY is ahead in the last 12 months. For transparency, my equity investments are split between a passive ETF allocation (DNL is not part of it) and an actively managed stock portfolio, whose positions and trades are disclosed in Quantitative Risk & Value.
Be the first to comment