


ra2studio/iStock via Getty Images
Written by Nick Ackerman, co-produced by Stanford Chemist. This article was originally published to members of the CEF/ETF Income Laboratory on July 11th, 2022.
Destra Multi-Alternative Fund (NYSE:DMA) may appear to be a new fund that only launched in January of 2022. However, it was previously an interval closed-end fund that would repurchase between 5 and 25% of its shares annually. It was a private fund with a new NYSE listing. This changed when they converted to a traditional CEF with no annual repurchase requirement and began trading on the NYSE.
That’s where this fund came from, seemingly out of nowhere. It is now the deepest discounted CEF in all CEF land. So that brings up the question, is this a bargain? Or should you avoid it?
What Are DMA And Destra?
Here is how DMA is described:
…is a core alternative solution that seeks to achieve long-term performance non-correlated to the broad stock and bond markets. It invests primarily in alternative strategies and asset classes including real estate, direct private equity, alternative credit, commodities and hedge strategies.
DMA is a smaller fund, and that could be due to Destra being a relatively smaller operation too. The platform is described as a “product platform that brings together specialty-based asset managers with investment vehicles designed to take full advantage of each manager’s process.”
We’ve seen this name before, too, if you are invested in any of the Angel Oak, Flaherty & Crumrine or Tekla funds. They operate as the servicing agent for these funds.
In the case of DMA specifically, the asset manager here is Validus Growth Investors. That is a new name to me as I haven’t heard of them before. Here is how they are described:
Validus is a research-focused, fundamentally-driven manager of direct equity, alternative, and asset allocation strategies. As part of its proprietary research methods, Validus implements systematic scoring regimes to identify specific investment opportunities which are combined with active risk-mitigation techniques to construct portfolios. Validus currently has over $215 million in assets under management and administration.
They are definitely in the investment boutique management space with few assets under management. That doesn’t make them necessarily bad, but they don’t really have the resources that other fund sponsors might be able to provide.
On the other hand, they can get quite specialized in certain niche areas of the market to specialize in. The big players wouldn’t find any financial benefit in those areas because they can’t quite move the needle on their own financial gains due to their bloated size.
DMA screens as the fund with the deepest discount of any CEF. It beats out perennial deep discounters such as Foxby (OTCPK:FXBY), Dividend and Income Fund (OTCPK:DNIF) and Highland Floating Rate Opportunities (HFRO). At the time of writing, the discounts were as follows; 38.11% for DMA, then 34.96%, 30.52% and 26.45%, respectively, for the other three.
DMA’s Portfolio
Looking at a CEF isn’t complete until looking at the portfolio. When looking at the top ten, we see plenty of names I’m sure most aren’t going to be familiar with. At the very least, they are investments that we don’t regularly see in other CEFs.
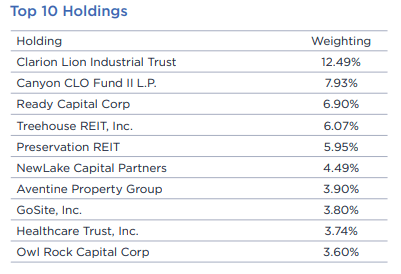
DMA Top Ten (Destra)
A large portion of the portfolio is invested in private/non-listed holdings.
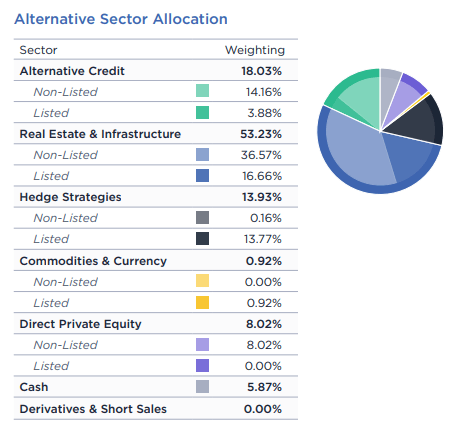
DMA Allocation (Destra)
As of the last Annual Report, 26% was in level 3 assets. There is then another ~33% identified as “practical expedient.” This is a term I had not heard of, but I have discovered that it is related to alternative investments thanks to looking at DMA.
Investments in equity securities of investment companies are required to be measured at fair value just like equity investments in other types of entities in the scope of ASC 820. Many investment companies maintain a net asset value (NAV) for purposes of subscriptions and redemptions or solely for reporting purposes. NAV may or may not be equal to fair value depending on the ability to transact at NAV. If the investment does not have a readily determinable fair value, as discussed in FV 6.2.2, it may qualify for a practical expedient by which reporting entities may instead use NAV, without adjustment, to measure investments in certain funds (e.g., hedge funds, private equity funds, real estate funds, venture capital funds, commodity funds, funds of funds).
From my understanding after reading, this is essentially level 3 assets but under a different name. Basically, it is investments where there is no readily available market to sell without first finding a buyer. There is a reported NAV (or equivalent), but that’s just a best efforts calculation. If I’m wrong, I’m completely open to hearing the other side of the argument.
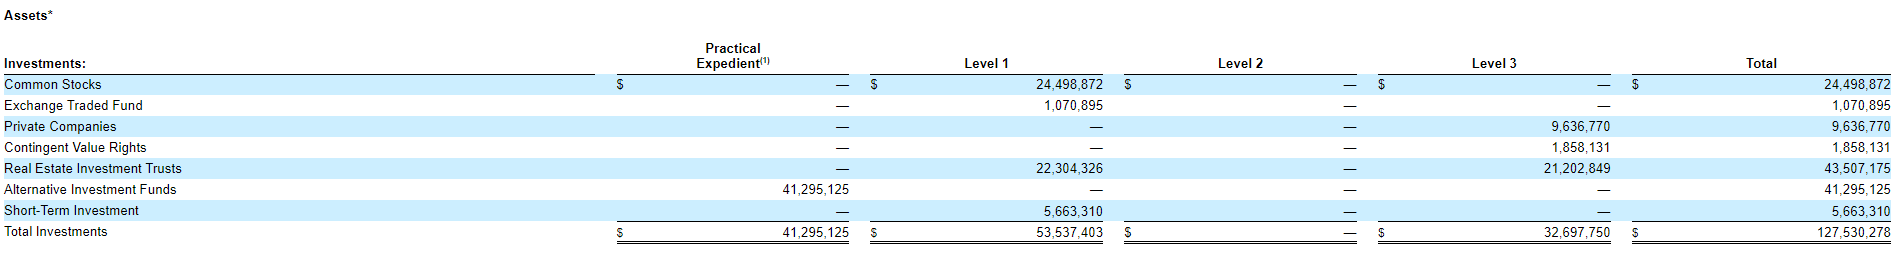
DMA Fair Value Hierarchy (Destra)
They had an additional 58.3% identified as restricted investments.
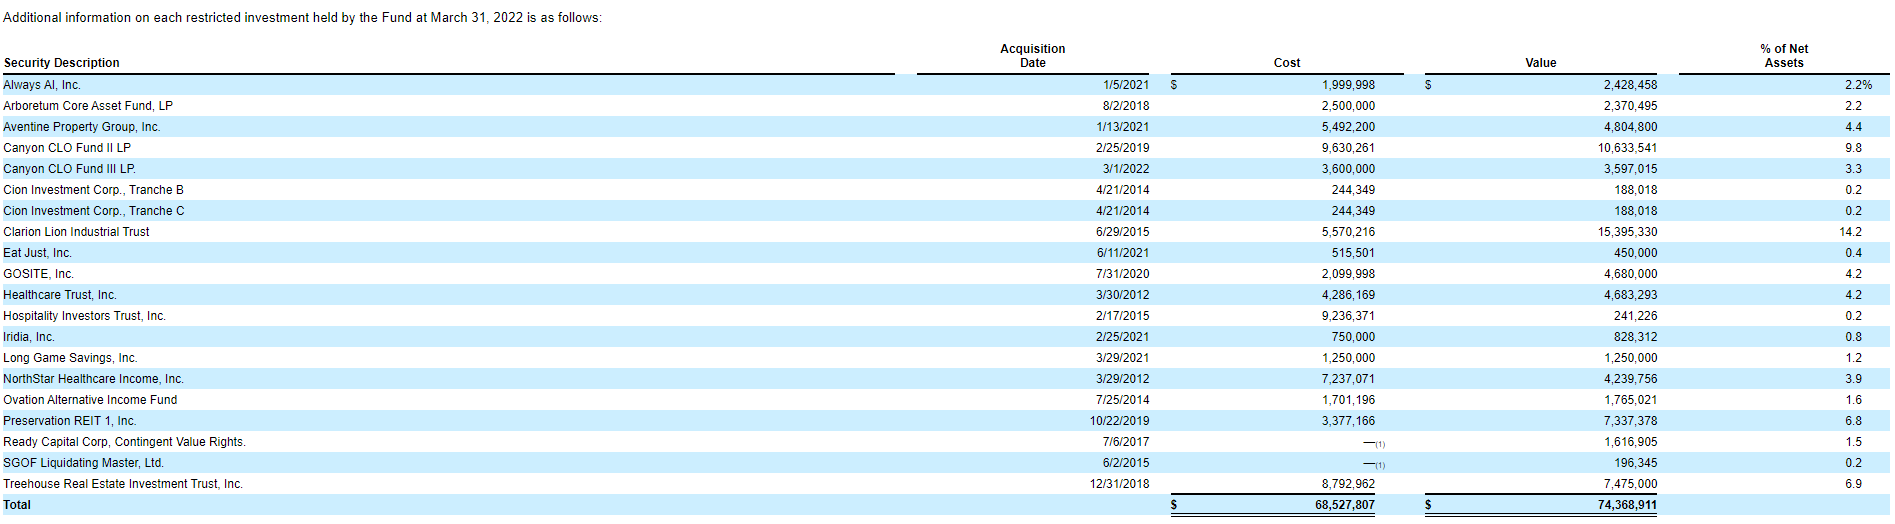
DMA Restricted Securities (Destra)
This all adds up to a portfolio that seems to be valued on a best efforts basis, with positions they could be locked into for some time. As an example, the largest position in the portfolio by a large amount is the Clarion Lion Industrial Trust. It allows quarterly redemptions, and that is it. If they need to liquidate for their monthly distribution to raise cash, while selling Clarion might make more sense – they could be limited to selling something they might not want to.
Invest Or Avoid?
That gives us a bit of background on the fund. Now we can go on to answer the question originally asked; is this a bargain, or should an investor avoid it? I don’t often use questions in my headlines, but that was the first thing that I asked myself.
Like most of my feelings on investments, that question isn’t easily answered because it always comes out as “it depends.” I wouldn’t say the investment opportunity is particularly compelling. In the last decade, they’ve shown minimal success.
These are the annualized returns at the end of May 31st, 2022.
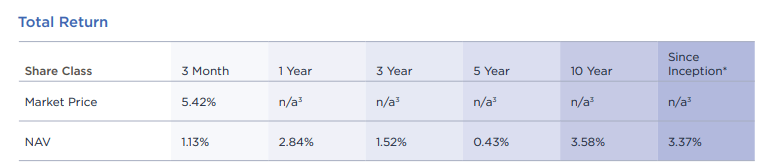
DMA Annualized Results (Destra)
These types of results don’t necessarily provide a reassuring track record. Even though we all know that past performance doesn’t guarantee future results, the idea here is that, hopefully, they will be more successful in the future. As a quick reminder, the NAV results can be known because it was a private fund. The market price isn’t available because, well, it didn’t have a market price.
Additionally, their last Annual Report indicated that they have been transforming the fund.
The month of March 2022 capped a multi-month period where we saw significant changes to the Fund’s portfolio. However, these changes taken as a whole, continued to position the Fund into higher quality institutional strategies while taking advantage of asymmetrical risk/reward in specific asset classes.
This could potentially lead to better results for the fund going forward. I would say that whatever alternatives they were investing in previously weren’t working after a decade. The last decade has been rather unique, with rates pegged at near 0% – only briefly rising and now rising with the latest cycle. They also aren’t abandoning the alternative space either, just repositioning within it.
From the bottom-up, over the coming year, we expect: (1) low-income housing and industrial REIT fundamentals to remain strong (although Amazon’s latest earnings results in April suggest near-term over-capacity may be an issue); (2) real estate providers focused on the cannabis market to benefit from further normalization; (3) the CLO market to remain robust with historically attractive spreads; and (4) direct operating company investments to progress with building, advancing, and verifying their business models as they become more attractive to follow-on capital providers.
Perhaps not surprisingly given these views, we believe it is as important as ever for investors to have exposure to non-correlated income and potential portfolio upside that is not dependent on rising equity markets.
We are excited to continue to enhance the attractiveness of the Fund’s investment portfolio and are eager to see the investments contribute positively to the Fund’s investment portfolio next year and over time.
That does lead us to the question of the distribution. After all, the CEF structure lends itself to a strong income focus, given the requirement to pay out most of the fund’s earnings. At the end of the day, their investment portfolio is just a means to provide income and gains to investors.
In that category, they are sporting an attractive 9.67% distribution yield. That should certainly catch some attention. Due to the massive discount, the NAV rate comes to just 6% based on the last distribution amount.
It is a varying distribution from month to month. That can be a turn-off for some investors. It is based on a fixed percentage of the fund’s current NAV per share.
The Fund’s distribution policy is expected to result in distributions that equal a fixed percentage of the Fund’s current NAV per share. Shareholders receiving periodic payments from the Fund may be under the impression that they are receiving net profits. However, all or a portion of a distribution may consist of a return of capital. Return of capital is the portion of a distribution that is a return of your original investment dollars in the Fund. Shareholders should not assume that the source of a distribution from the Fund is net profit. Shareholders should note that return of capital will reduce the tax basis of their shares and potentially increase the taxable gain, if any, upon disposition of their shares.
Though I haven’t been able to find the percentage, it would appear to be around 6%. The latest $0.056 distribution leads to an annualized payout of $0.672, which would now be about 6% of the $11.23 NAV.
Additionally, we saw a very high February payout from this chart. That would be a bit misleading because it just happened to be that the month had two payable dates fall within the same month—one at the beginning of the month and another at the end.
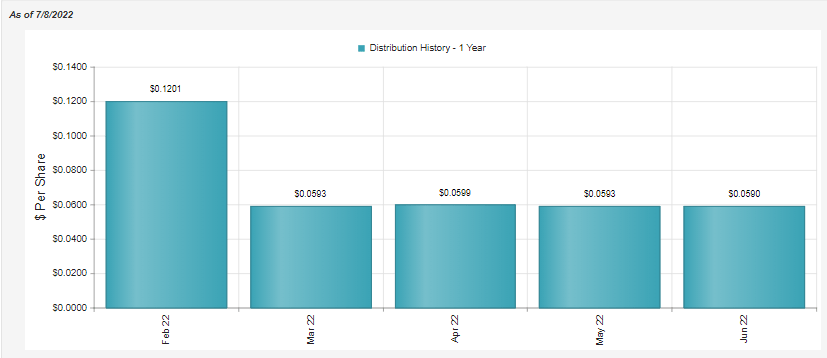
DMA Distribution History (CEFConnect)
This still takes us back to the annualized returns. Since that is lower than the relatively reasonable 6.30% distribution (or 6% if that is the fixed percentage they are shooting for), it would suggest that it isn’t sustainable. If we saw the same 3.37% annualized returns over the next decade that we saw over the last, it would mean the NAV would have moved lower as the distribution erodes the assets.
Conclusion
This takes us to the conclusion. The fund is at the deepest discount of any CEF, and we’ve seen other CEFs carry the title for years.
Given the small size, that already takes out a lot of potential investors. Given the “newness,” that takes out another group of investors. Given the alternative investments, that too takes out yet another group of investors. Put on top of this the poor historical results, and, you guessed it, even more investors will shun this fund.
That’s why it depends on what type of investor you might be. This could be a worthwhile investment if you are a longer-term investor with some speculative dollars. It could take years for the fund to gain traction with most investors, if at all, though.
The niche category that they invest in probably isn’t going to appeal to a wide audience. Alternatively, this could be precisely what one is looking for if they believe these private and alternative investments offer a better return going forward. It certainly offers some diversification from what one probably already owns at this point with more traditional CEFs and ETFs.
If you expect a lot of returns from the underlying investments, history here suggests that isn’t going to happen. Instead, the largest return appears to likely come from a discount contraction if it happens. That’s just simply my opinion. Others probably differ, which is what makes a market.
Be the first to comment