

sarayut/iStock via Getty Images
This dividend exchange-traded fund (“ETF”) article series aims at evaluating products regarding the relative past performance of their strategies and quality metrics of their current portfolios. Holdings and their weights change over time: reviews are updated when necessary.
DLN strategy and portfolio
The WisdomTree LargeCap Dividend ETF (NYSEARCA:DLN) has been tracking the WisdomTree U.S. LargeCap Dividend Index since 06/16/2006. DLN currently has 299 holdings, a distribution yield of 2.14%, and an expense ratio of 0.28%.
As described in the prospectus by WisdomTree, the Index is constituted of the 300 largest companies ranked by market capitalization from the WisdomTree U.S. Dividend Index. They are weighted annually based on paid dividends (not yields). The fund invests only in U.S. companies, 87.8% in large caps and the rest in mid-caps.
The top 10 holdings, listed below with basic ratios, represent 29.3% of asset value.
|
Ticker |
Name |
Weight |
EPS Growth % ttm |
P/E ttm |
P/E fwd |
Yield % |
|
Microsoft Corp. |
4.28% |
19.73 |
28.50 |
26.88 |
0.90 |
|
|
Exxon Mobil Corp. |
4.13% |
393.07 |
10.28 |
7.67 |
3.74 |
|
|
Apple Inc. |
3.82% |
18.52 |
26.44 |
26.21 |
0.58 |
|
|
Johnson & Johnson |
3.23% |
3.44 |
25.13 |
17.12 |
2.61 |
|
|
Chevron Corp. |
2.58% |
704.24 |
10.62 |
8.71 |
3.57 |
|
|
Pfizer Inc. |
2.30% |
121.74 |
11.40 |
7.65 |
3.22 |
|
|
Coca-Cola Co. |
2.29% |
17.92 |
28.93 |
25.81 |
2.77 |
|
|
Philip Morris International Inc. |
2.29% |
2.58 |
16.94 |
17.76 |
5.07 |
|
|
JPMorgan Chase & Co. |
2.24% |
-16.90 |
9.02 |
10.06 |
3.56 |
|
|
Procter & Gamble Co. |
2.14% |
5.61 |
24.46 |
23.85 |
2.57 |
Ratios from Portfolio123
The top three sectors are healthcare (16.9%), technology (16%) and consumer staples (15.3%). Compared to SPDR S&P 500 Trust ETF (SPY), DLN significantly overweights consumer staples, energy, utilities and real estate. It underweights technology, consumer discretionary and communication. Sector composition may change over time.
DNL sector weights (chart: author; data: Fidelity)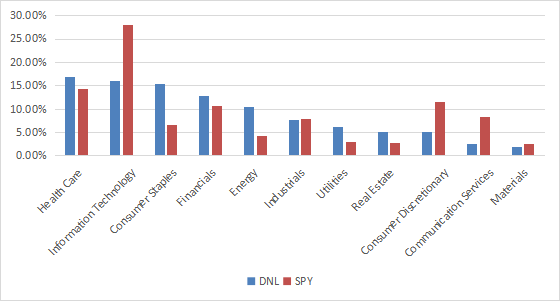
Past performance
Since inception in June 2006, DLN has underperformed SPY by about one percentage point in annualized return. Volatility is a bit lower than the benchmark, but the maximum drawdown is a bit deeper, as reported in the next table.
|
Total Return |
Annual.Return |
Drawdown |
Sharpe Ratio |
Volatility |
|
|
DLN |
277.56% |
8.60% |
-58.76% |
0.57 |
14.56% |
|
SPY |
349.31% |
9.77% |
-55.42% |
0.61 |
15.69% |
Data calculated with Portfolio123
However, DLN has beaten SPY by about 8 percentage points in the last 12 months, and more precisely since January:
DLN vs. SPY trailing 12 months (Portfolio123)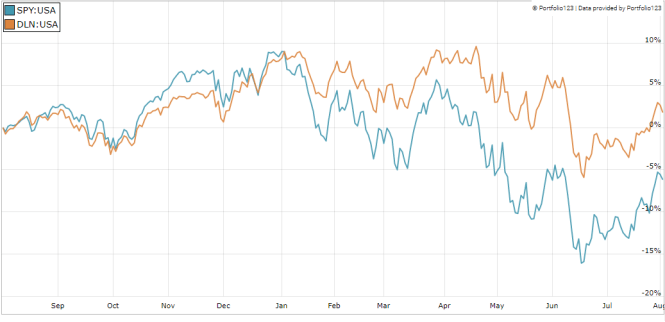
In previous articles, I have shown how three factors may help cut the risk in a dividend portfolio: Return on Assets, Piotroski F-score, and Altman Z-score.
The next table compares DLN with a subset of the S&P 500: stocks with an above-average dividend yield, an above-average ROA, a good Altman Z-score, a good Piotroski F-score and a sustainable payout ratio. The subset is rebalanced annually to make it comparable with a passive index.
|
Total Return |
Annual.Return |
Drawdown |
Sharpe Ratio |
Volatility |
|
|
DLN |
277.56% |
8.60% |
-58.76% |
0.57 |
14.56% |
|
Dividend quality subset |
463.55% |
11.33% |
-41.78% |
0.72 |
15.08% |
Past performance is not a guarantee of future returns. Data Source: Portfolio123
DLN underperforms my dividend quality subset. However, the ETF performance is real, and this subset is hypothetical. My core portfolio holds 14 stocks selected in this subset (more info at the end of this post).
Scanning DLN portfolio
Valuation metrics are cheaper than for SPY (see next table).
|
DLN |
SPY |
|
|
Price/Earnings TTM |
16.54 |
18.43 |
|
Price/Book |
3.05 |
3.53 |
|
Price/Sales |
2.22 |
2.37 |
|
Price/Cash Flow |
12.4 |
14.38 |
Data: Fidelity
I have scanned DLN holdings with the quality metrics described in the previous paragraph. I consider that risky stocks are companies with at least 2 red flags among: bad Piotroski score, negative ROA, unsustainable payout ratio, bad or dubious Altman Z-score, excluding financials and real estate where these metrics are less relevant. With these assumptions, 18 stocks out of 299 are risky, and they weigh only 5% of asset value, which is a good point.
Based on my calculation, the aggregate return on assets is superior to SPY’s aggregate value. Altman Z-score and Piotroski F-score are not significantly different. These metrics point to a portfolio quality slightly superior to the large-cap benchmark.
|
DLN |
MDY |
|
|
Altman Z-score |
3.69 |
3.41 |
|
Piotroski F-score |
6.37 |
6.04 |
|
ROA% TTM |
10.43 |
7.57 |
Takeaway
DLN holds about 300 dividend stocks of large U.S. companies. Constituents are weighted based on paid dividends. Healthcare, technology and consumer staples are the heaviest sectors and weight almost half of asset value together. Technology is much lighter than in SPY (16% vs. 28%), which results in a more balanced portfolio across sectors. Concentration in the top 10 holdings is similar to SPY (about 29% vs. 27%). Three stocks are in both top 10 lists: AAPL, MSFT, JNJ. Valuation ratios are cheaper than for the benchmark, and quality metrics are superior.
DLN is not designed for income-seeking investors: it is a low-yield, high-quality dividend fund. DLN has underperformed SPY since inception, but its quality and value characteristics may become an advantage in a bear or sideways market. Indeed, it has beaten the benchmark by 8 percentage points since January. For transparency, a dividend-oriented part of my equity investments is split between a passive ETF allocation (DLN is not part of it) and my actively managed Stability portfolio (14 stocks), disclosed and updated in Quantitative Risk & Value.
Be the first to comment