

Adrian Vidal
The Dividend Harvesting portfolio’s 4-week losing streak was snapped in week 72 and was extended to its 5th consecutive week in the red. Some progress was made as the Dividend Harvesting portfolio went from being down -$197.60 (-2.78%) in week 71 to closing the week down -$170.92 (-2.37%). I have now allocated $7,200 ($100 weekly) to this portfolio; there are 77 positions, of which 76 pay a dividend or distribution, and the forward annual yield is 7.24%, as my projected annual income is $508.58. It’s important to emphasize that market dynamics can take its toll on any portfolio in a downtrend, even one that’s diversified and generating an above-average yield. This investment strategy isn’t glamorous, and it won’t appeal to everyone. I feel it’s important to emphasize the negative weeks, so a false sense of reality doesn’t set in. The Dividend Harvesting portfolio’s weekly positive streak continues to diminish as it now has a 90.28% (65/72) record of finishing each week in the black.
Having incurred my 5th consecutive week in the red, I am not unhappy with the results of this portfolio. Nobody can accurately predict tops and bottoms in the market, and only time will tell if another leg down is yet to occur, if the market is bouncing along the bottom, or if we’re starting to form a sustainable rally. We’re not going to know until well after it occurs. The previous year has been a difficult investing environment. I believe the combination of vast diversification while reinvesting every dividend/distribution and adding capital on a weekly basis affording the ability to dollar cost average has played a large factor in the Dividend Harvesting portfolio only declining -2.37%. In week 72, I dollar cost averaged into 7 positions as I saw many opportunities to add capital to current positions. I look at the market’s downturn as a long-term opportunity, and I believe these buying opportunities will be rewarded when the tide turns.
I allocate capital toward big tech, funds, dividends, and growth outside of my retirement accounts. These are not my only investments, but I did open a separate account, so I could easily track and document this series. I intentionally created broad diversification throughout the Dividend Harvesting portfolio so I could benefit from sector rotations and mitigate my downside risk. Investors who are too exposed to growth companies or large-cap tech have gotten crushed as the investment landscape changes. On the growth and tech side of my investments, I am feeling the pain as some of my favorite companies, including Alphabet (GOOGL) (GOOG), Amazon (AMZN), and Meta Platforms (META), have been taken to the woodshed.
This series has never been about hitting a target yield, generating a certain amount of profit, or beating the market. I had two specific goals with this series. The first was to create a blueprint for constructing a dividend portfolio by documenting the journey starting from the beginning. The second goal was to illustrate how allocating capital each week toward investing, regardless of the amount, would be beneficial in the long run.
Too many people are under the illusion that you need tens of thousands or even hundreds of thousands to benefit from investing. Instead of using my real dividend portfolio as an example, I decided to start a new account, fund it with $100, and add $100 weekly, providing a step-by-step guide to dividend investing. This methodology doesn’t have to be used for dividend investing, and it could be as simple as an S&P index fund or a Total Market fund. Hopefully, this series is inspiring people to invest in their future to attain financial freedom.
Steven Fiorillo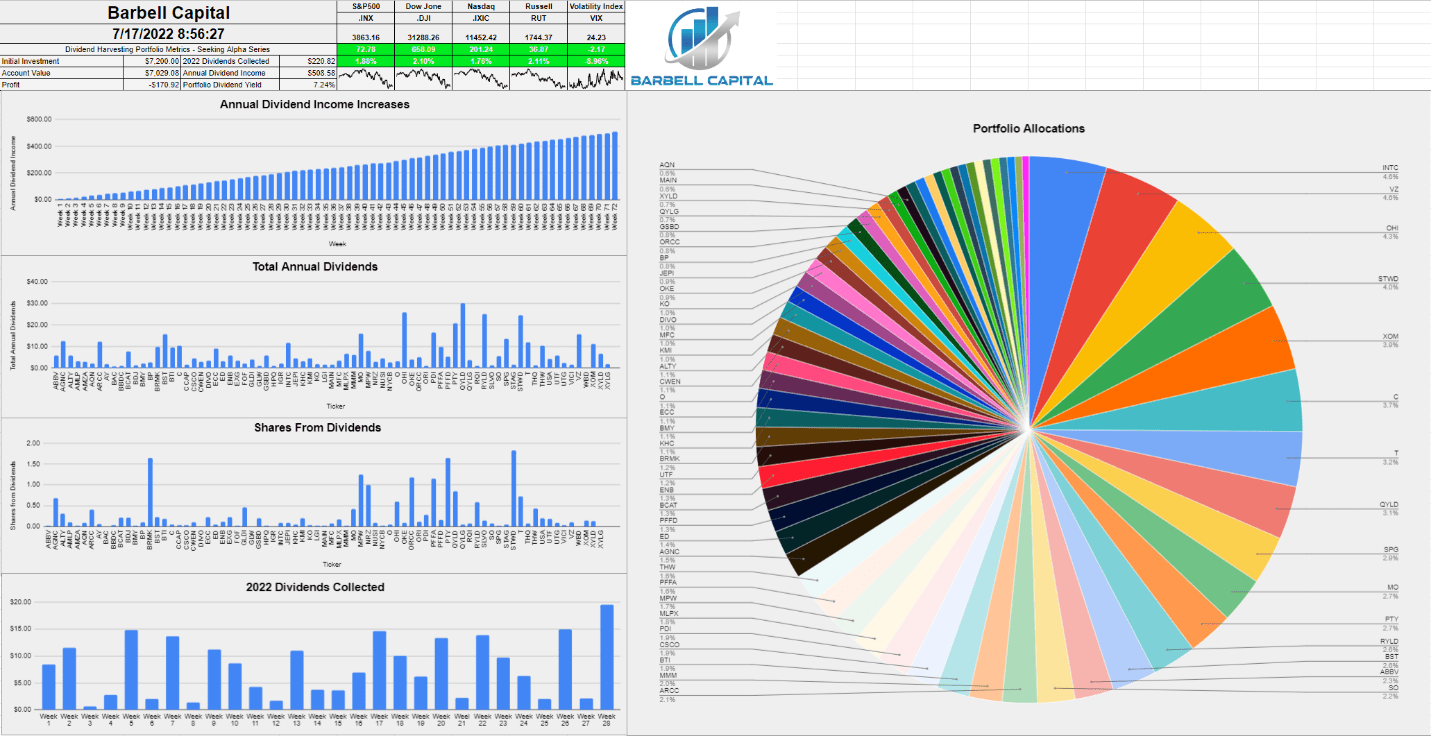
A Historical Recap Of The Dividend Harvesting Portfolio’s Investment Principals and historical Performance
Below are the fundamental rules I have put in place for this portfolio:
- Allocate $100 weekly to this portfolio
- Only invest in dividend-producing investments
- No position can exceed 5% of the portfolio
- No sector can exceed 20% of the portfolio
- All dividends & distributions are to be reinvested
Below is a chart that extends from week 1 through the current week to illustrate the Dividend Harvesting Portfolio’s Progression
- Blue line is my initial investment $100 in week 1, $1000 in week 10, etc.
- Red line is the account value at the end of each week
- Yellow line is the annual dividend income the Dividend Harvesting Portfolio was projected to generate after that week’s investments and dividends reinvested
Steven Fiorillo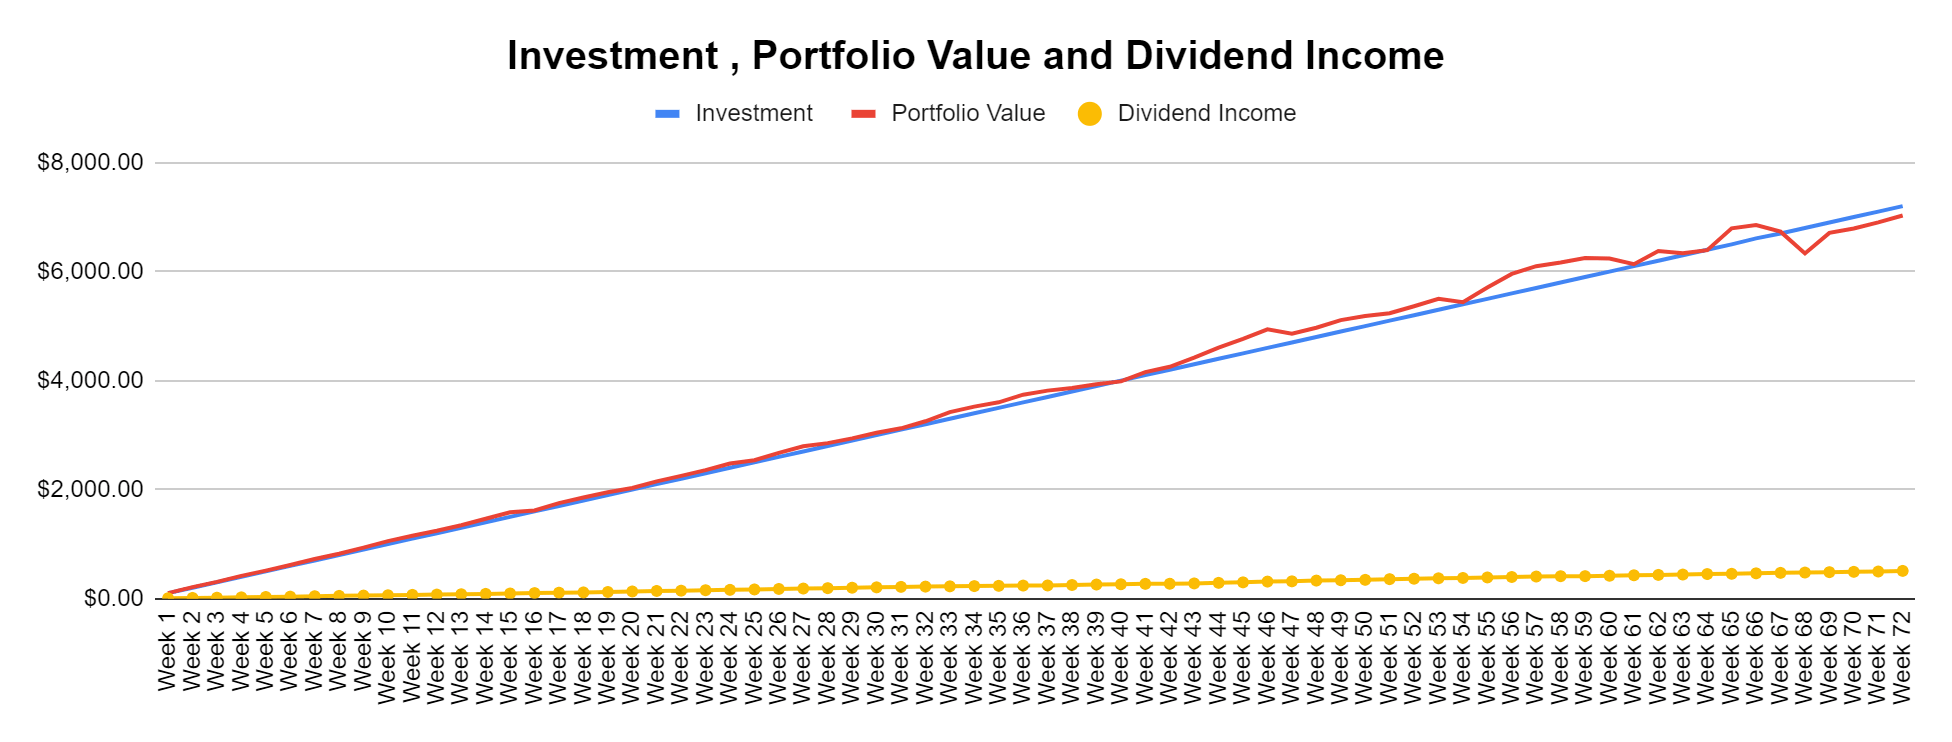
The Dividend Harvesting Portfolio Dividend Section
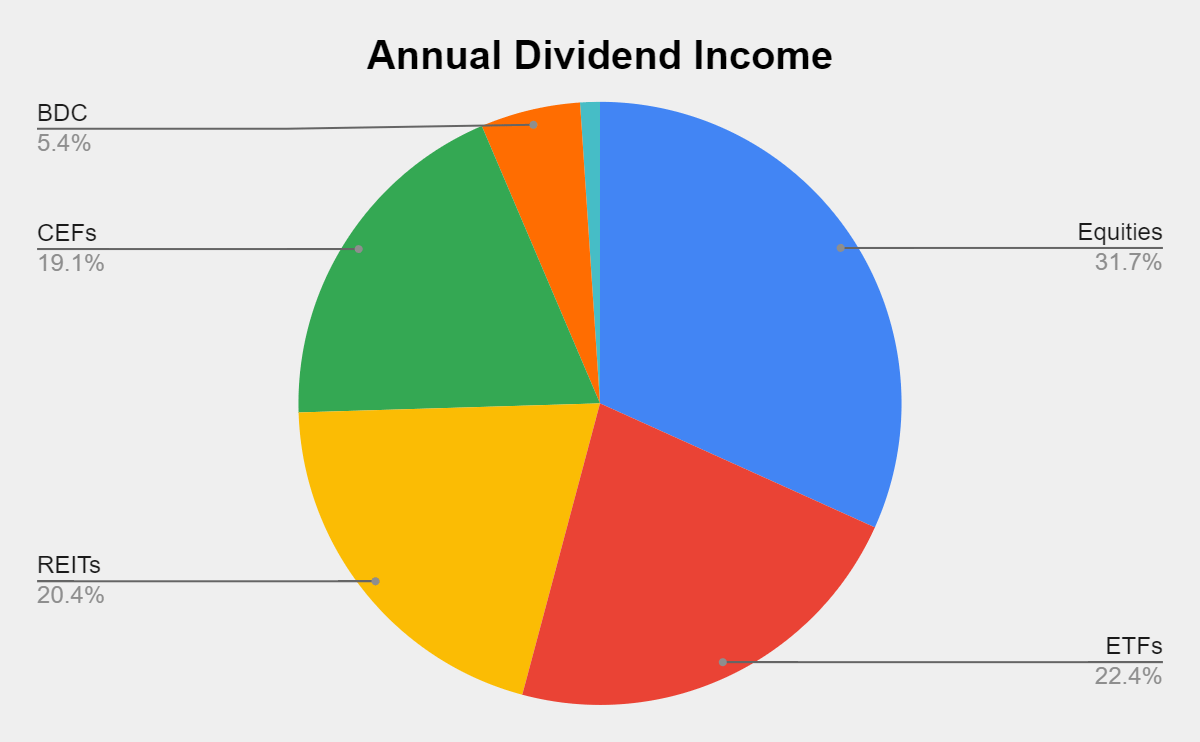
Here is how much dividend income is generated per investment basket:
- Equities $161.46 (32.40%)
- ETFs $113.93 (22.51%)
- REITs $103.60 (19.68%)
- CEFs $96.98 (19.11%)
- BDC $27.23 (5.22%)
- ETNs $5.38 (1.08%)
Steven Fiorillo Steven Fiorillo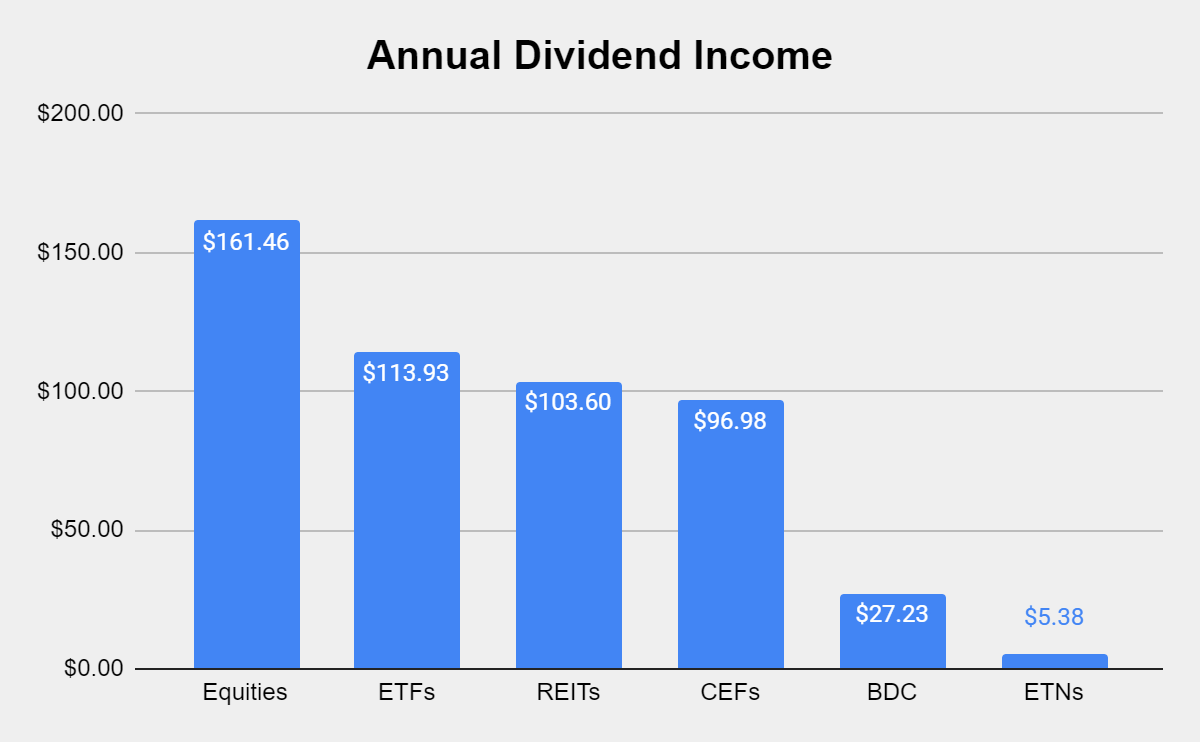
Collecting dividends can serve many functions in a portfolio. Some investors utilize dividends to supplement their income and live off. I am building a dividend portfolio for myself 30 years into the future. Since I am reinvesting every dividend, they serve multiple purposes today. In 2022 alone, I have collected $220.82 in dividend income from 264 dividends across 28 weeks. This has allowed the Dividend Harvesting portfolio to stay in the black while growing the snowball effect.
These dividends allow me to gain additional equity in my investments while increasing my future cash flow in down markets. This style of investing isn’t for everyone, but if you’re looking to generate consistent cash flow while mitigating downside risk, this method has worked for me. I am hoping to collect between $450-$500 in dividends in 2022, which will be reinvested, and finish the year generating >$700 in annual dividends.
Steven Fiorillo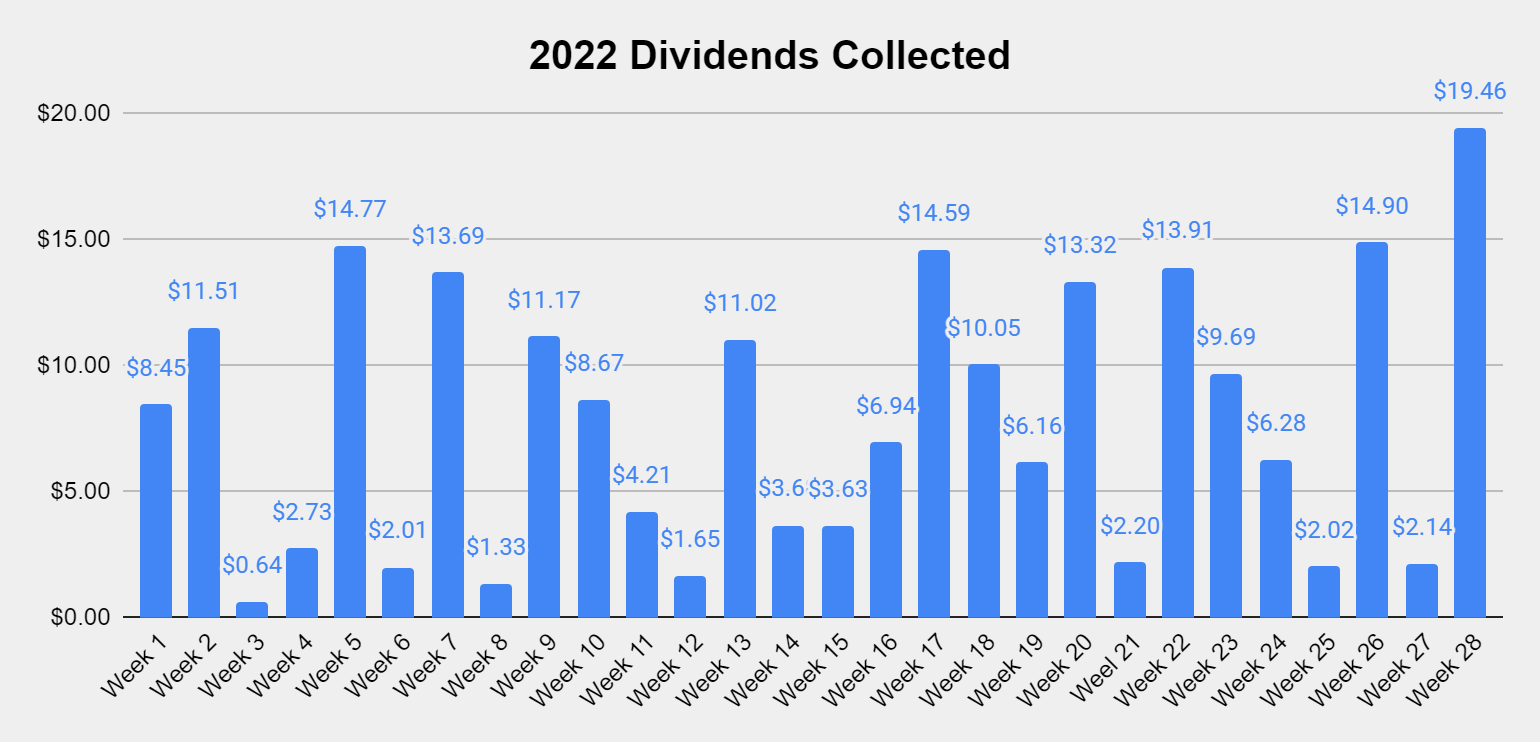
The never-ending stream of dividend income keeps growing. There are now 576 annual dividends being produced after adding IGR in week 70. Dividend income is being produced every week, and I think 600 annual dividends will be here before Labor Day. It’s going to be very interesting to see what these numbers look like several years from now.
Steven Fiorillo
The goal of generating enough income from the dividends to purchase an additional share per year has been the never-ending project of this portfolio. There are now 6 positions that are generating at least 1 share annually through their dividends, which include Starwood Property Trust (STWD), PIMCO Corporate & Income Opportunity Fund (PTY), Broadmark Realty Capital (BRMK), AGNC Investment Corp. (AGNC), the Global X Russell 2000 Covered Call ETF (RYLD), and the Global X NASDAQ 100 Covered Call ETF (QYLD). I am trying to get more of the current positions over the finish line. Eventually, more positions will generate one share per year in dividend income.
|
Shares from Dividends Annually |
||||||||||
|
0-9.9% |
10-19.99% |
20-29.99% |
30-39.99% |
40-49.99% |
50-59.99% |
60-69.99% |
70-79.99% |
80-89.99% |
90-100% |
Generating > 1 share |
|
BBDC |
FOF |
NYCB |
MO |
BST |
T |
USA |
ECC |
OHI |
PTY |
|
|
AMLP |
MLPX |
KMI |
SLVO |
PFFA |
BCAT |
ARCC |
PDI |
QYLD |
||
|
KHC |
AQN |
PFFD |
GSBD |
EXG |
GLDI |
THW |
BRMK |
|||
|
JEPI |
XYLD |
UTF |
NRZ |
ORCC |
MPW |
RYLD |
||||
|
CWEN |
BDJ |
NUSI |
VZ |
ALTY |
STWD |
|||||
|
UTG |
QYLG |
BTI |
INTC |
AGNC |
||||||
|
SO |
SPG |
MFC |
IGR |
|||||||
|
RQI |
ENB |
C |
||||||||
|
OKE |
XOM |
|||||||||
|
THQ |
CCAP |
|||||||||
|
XYLG |
AMZA |
|||||||||
|
AY |
CSCO |
|||||||||
|
STAG |
DIVO |
|||||||||
|
MMM |
BP |
|||||||||
|
VICI |
LGI |
|||||||||
|
ORI |
||||||||||
|
O |
||||||||||
|
ABBV |
||||||||||
|
MAIN |
||||||||||
|
ED |
||||||||||
|
GLW |
||||||||||
|
HPQ |
||||||||||
|
BMY |
||||||||||
|
KO |
||||||||||
|
BAC |
||||||||||
|
WBD |
||||||||||
The Dividend Harvesting Portfolio Composition
In week 72, REITs extended their lead in the top spot as they are now over a full percentage point larger than the ETF section of the Dividend Harvesting portfolio. REITs represent 17.41% of the Dividend Harvesting portfolio, while ETFs account for 16.34%. Individual equities make up 44.92% of the portfolio and generate 31.75% of the dividend income, while ETFs, CEFs, REITs, BDCs, and ETNs represent 55.08% of the portfolio and generate 68.25% of the dividend income. I have a 20% maximum sector weight, so when a singular sector gets close to that level, I make sure capital is allocated away from that area to balance things out. In 2022, I will make an effort to even out these portfolio percentages. As more capital is deployed, the bottom half of the portfolio weighting will increase.
|
Industry |
Investment |
Portfolio Total |
% of Portfolio |
|
REIT |
$1,223.44 |
$7,029.08 |
17.41% |
|
ETFs |
$1,148.55 |
$7,029.08 |
16.34% |
|
Closed End Funds |
$986.14 |
$7,029.08 |
14.03% |
|
Oil, Gas & Consumable Fuels |
$540.47 |
$7,029.08 |
7.69% |
|
Communication Services |
$531.91 |
$7,029.08 |
7.57% |
|
Financials |
$489.94 |
$7,029.08 |
6.97% |
|
Consumer Staples |
$459.81 |
$7,029.08 |
6.54% |
|
Technology |
$372.53 |
$7,029.08 |
5.30% |
|
BDC |
$312.22 |
$7,029.08 |
4.44% |
|
Utility |
$289.13 |
$7,029.08 |
4.11% |
|
Pharmaceuticals |
$233.32 |
$7,029.08 |
3.32% |
|
Industrials |
$132.86 |
$7,029.08 |
1.89% |
|
Independent Power & Renewable Electricity Producers |
$107.68 |
$7,029.08 |
1.53% |
|
ETN |
$37.41 |
$7,029.08 |
0.53% |
|
Cash |
$0.01 |
$7,029.08 |
0.00% |
Intel Corporation (INTC) has climbed into the top position by a fraction, with Verizon (VZ) in a close 2nd. I want to continue to add to INTC and VZ but will wait as they are getting close to my 5% threshold for individual positions.
|
Week 72 Top 10 By % |
|
|
INTC |
4.44% |
|
VZ |
4.43% |
|
OHI |
4.15% |
|
STWD |
3.92% |
|
XOM |
3.79% |
|
C |
3.59% |
|
T |
3.14% |
|
QYLD |
3.04% |
|
SPG |
2.77% |
|
MO |
2.64% |
Week 72 Additions
I allocated the capital in week 72 toward dollar cost averaging into existing positions that were in the red. I ended up adding to 7 individual positions, which include:
- Virtus InfraCap U.S. Preferred Stock ETF (PFFA)
- Starwood Property Trust (STWD)
- Medical Properties Trust (MPW)
- PIMCO Corporate & Income Opportunity Fund (PTY)
- Owl Rock Capital Corporation (ORCC)
- New Residential Investment (NRZ)
- Broadmark Realty Capital (BRMK)
Virtus InfraCap U.S Preferred Stock ETF
- InfraCap focuses on companies that generate and distribute modest income from their FCF while pairing income-producing investments with the ability to write options contracts to enhance the amount of income their investments generate. I have 2 ETFs that focus on Preferred Shares and wanted to slowly increase my exposure to them. I think PFFA is interesting at these levels as its yield is now 8.9%.
Starwood Property Trust
- I have said it many times before, Barry Sternlicht is one of my favorite CEOs, and I absolutely love STWD. STWD was allocating capital during the pandemic crash and positioning itself for the future. I think STWD is positioned well for the future, and I plan on compounding the dividends into new shares. STWD’s dividend wasn’t impacted during the pandemic, and its yield is 8.95% as shares have declined.
Medical Properties Trust
- I recently wrote a dedicated article on MPW, and it’s been getting a lot of traction on Seeking Alpha lately. When I rechecked my valuation sheet, MPW is trading at 8.66x price to FFO, which is the lowest among its peer group. Its yield is 7.36%, and all its metrics seem to indicate it’s undervalued.
PIMCO Corporate & Income Opportunity Fund
- I have gotten crushed on PTY as it’s been awful from a percentage basis. I will probably do a lot of research over the next several weeks and make some decisions, as PTY has been one of the worst performers throughout the portfolio. I decided to dollar cost average since shares were very low, and I am not ready to call it quits just yet on PTY
Owl Rock Capital Corporation
- ORCC is an interesting BDC that trades at a -15.79% discount to NAV while yielding 9.9%. Looking at the financials, ORCC has continued to increase its revenue, gross profit, and operating income YoY. I felt it was a good time to add to this position
New Residential Investment
- NRZ was recovering, then at the beginning of June, shares dropped from $11.47 to $8.25 in roughly a week. There was a lot of concern about the impact of rates, and since the drop NRZ has slightly rebounded. NRZ declared its next dividend at the full freight after the decline occurred and has been working on restoring its dividend to its previous level. I will probably continue to add to NRZ here and there unless I see something in one of the quarterly reports that make me change my mind.
Broadmark Realty Capital
- Brian Ward took over as CEO on 3/1/22 and spent a large portion of his career originating and overseeing institutional debt and equity investments across a wide range of commercial real estate assets. His prior role was CEO of Trimont Real Estate Advisors, a credit management and servicing company with more than $165 billion of their client’s assets under management. In Q1, BRMK generated $190 million in new originations and amendments for the quarter at an average unleveraged yield of 10.4% and grew the portfolio to $1.6 billion of loans secured by high-quality real estate with a weighted average loan-to-value ratio at origination of approximately 59.2%. Just like PTY, BRMK has been an underperformer for me, but I want to see what Mr. Ward can do with the company before I consider making some changes.
Week 73 Gameplan
I am leaning toward adding 2 new positions to the Dividend Harvesting portfolio in week 73. I have been looking at Walgreens Boots Alliance (WBA), as its yield is still above 5% and National Retail Properties (NNN), which I recently wrote an article on.
Conclusion
Thank you to everyone who continues to read the Dividend Harvesting series and leave comments. In week 72, I achieved a new milestone of generating over $500 in projected annual income. The Dividend Harvesting portfolio’s losing streak has been extended to 5 consecutive weeks now. If the markets continue to rally, I think the -$170.92 (-2.37%) will reappear quickly, and a new positive trend will be started. I am looking forward to seeing how this portfolio progresses over the next 24 weeks and where it ends up at the close of 2022.
Be the first to comment