

designer491
In a recent article, I showed how we at The Natural Resources Hub screened for top income investment ideas from the dividend kings, an elite group of stocks that have raised dividends for at least 50 consecutive years. And we picked Altria Group (MO) for high-yield investing and AbbVie (ABBV) for dividend growth investing out of 41 dividend kings.
Below, I intend to present the result of the screening of the dividend champions for the best dividend ideas. Dividend champions are companies that have raised the dividend for 25 consecutive years. As of October 2022, there are 143 dividend champions, including the dividend kings.
How do we screen the dividend champions?
As I explained in the above-cited article,
“Dividend yield is the ratio of a company’s current annual dividend compared to its current share price. Dividend growth rate is the annualized percentage rate of growth a particular stock’s dividend undergoes over a period of time, typically one year. The sum of the dividend yield and dividend growth can be called the expected total return, from which one may calculate at what share price an entry should be made so as to meet a hurdle rate of total return.”
For high-yield targets, we require a 10% hurdle rate of total return and a dividend yield not much less than the CPI, currently at 8.3%, such that the current yield, in combination with visible dividend raises in the near future, will handily beat inflation and deliver income for retirees. Targets with a hurdle rate of 10% total return should outperform S&P 500 by ~1.8%, considering the index has an average dividend yield of 1.86% and dividend growth rate of 6.37% in 2000-2021.
Four stocks meet the above criteria (Fig. 1). They are Altria; VF Corp. (VFC), maker of branded clothes and shoes; Enterprise Products Partners L.P. (EPD) and Enbridge Inc. (NYSE:ENB), both being oil and gas midstream companies.
- VFC has not been able to grow revenue over the last 10 years; and its margins are relatively low and highly variable. Years of generous dividend raises result in a hefty 81% payout, up from 33% 10 years ago.
- Energy infrastructure operations are usually a wide-moated corner of the energy industry, as I previously discussed. My favorite stocks in this space include Enterprise Products Partners, Enbridge, Magellan Midstream (MMP), ONEOK, Inc. (OKE) and Pembina Pipeline Corp. (PBA). The latter three still need to establish a long streak of dividend raises to qualify for inclusion in the dividend champions.
- Enterprise Products Partners operates in the U.S., while Enbridge operates both in Canada and the U.S. These two stocks are similar in terms of dividend yield and dividend growth rate; however, I favor Enbridge because it saves investors from the hassle of dealing with K-1 tax forms; furthermore, by creating a prohibitively-high regulatory hurdle for permitting of new energy infrastructure, Ottawa helped heighten barriers to entry, thus giving the entrenched midstream companies, such as Enbridge, an extra layer of protection from competition.
Fig. 1. Scatter plot of dividend champions in terms of dividend yield and 10-year dividend growth rate, with high-yield and dividend-growth investing targets highlighted and the star denoting the 20-year average of S&P 500 (Laurentian Research for The Natural Resources Hub based on data sourced from Seeking Alpha and company financial filings)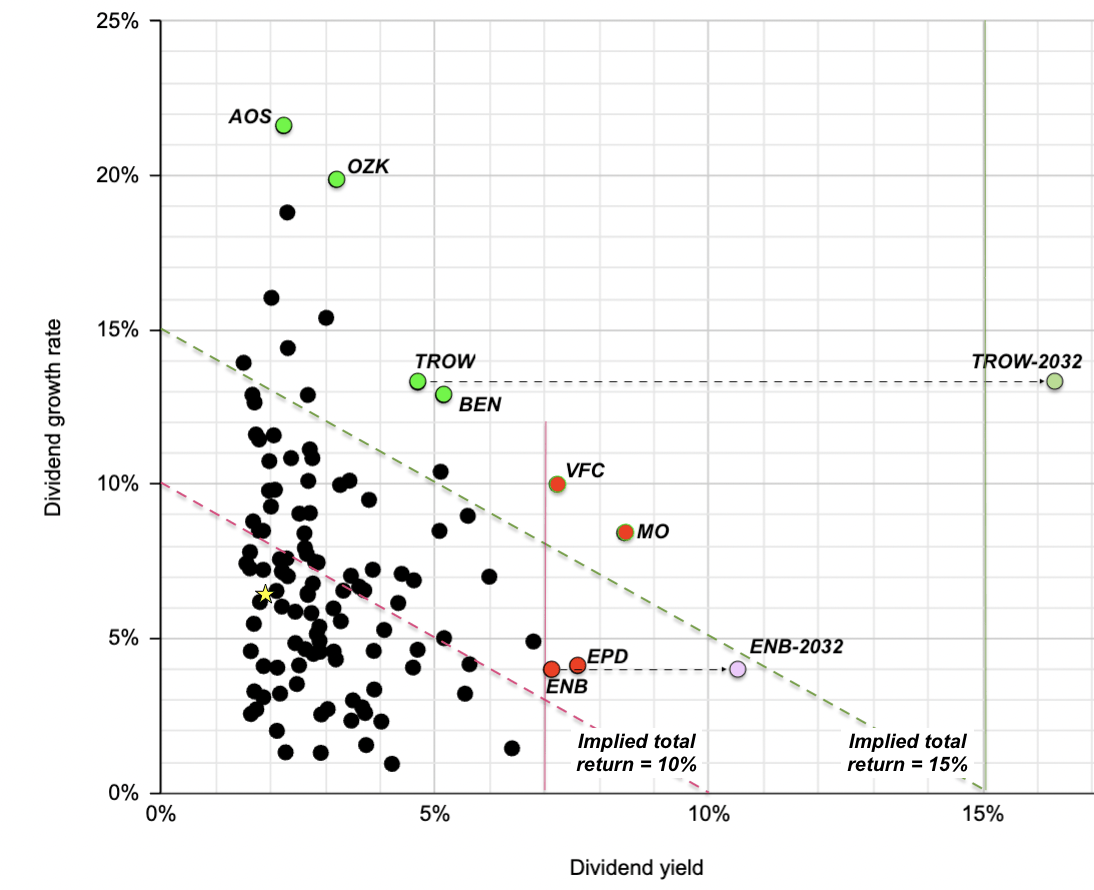
For dividend-growth targets, we require a >15% rate of total return per year and a >15% dividend yield on cost in 10 years, and we prefer current dividends, rather than future dividend increase, to be a big part of the future dividend yield on cost. Dividend growth investing works the best for future or early retirees, who have many years to compound dividend growth.
These dividend-growth criteria lead us to six stocks, namely, water heater and boiler manufacturer A. O. Smith Corp. (AOS); Little Rock, AR-based Bank OZK (OZK); apparel-maker VFC, as discussed above; tobacco company Altria, which uniquely qualifies as both a high-yield and dividend-growth stock; and mutual fund firms T. Rowe Price Group, Inc. (NASDAQ:TROW) and Franklin Resources, Inc. (BEN).
- Both A. O. Smith and Bank OZK can no longer raise dividends as rapidly as they used to. The former increased dividends by ~30% per year 10 years ago, but the dividend growth rate has dropped to lower single-digit in percentage in recent years. The latter increased dividends by 30-40% in the early 2010s but only by single-digit in percentage in last few years.
- Franklin Resources struggled to grow the top line between 2014 and 2020, while T. Rowe Price achieved steady growth in revenue in the last 10 years. The recent market downturn resulted in steep decline of assets under management (aka, AUM) for both companies. The AUM for Franklin Resources were US$1.39 billion as of August 31, 2022, while those for T. Rowe Price were US$1.23 trillion as of September 30, 2022. According to Seeking Alpha data, T. Rowe Price is more profitable than Franklin Resources, leading in gross margin (60% vs. 43%), EBITDA margin (50% vs. 29%), net margin (33% vs. 20%), and ROE (25% vs. 14%). I pick T. Rowe Price as the top dividend growth stock.
Enbridge
Growth
Over the last 10 years, Enbridge grew revenue at a CAGR of 4.8%, EBITDA at 11.7%, net income at 18.3%, and EPS by 8.7%. EBITDA margins improved during that time from 11.5% to 22.4%.
- For 2022, Enbridge guided toward C$15.0-15.6 billion in adjusted EBITDA, up year-over-year from C$14 billion, and per-share distributable cash flow at C$5.20-5.50, up from C$4.96 or ~7.9%. Enbridge aims to grow per-share distributable cash flow at a CAGR of 5-7% through 2024, a goal that is supported by a pipeline of projects, including booming LNG export in the U.S. Gulf Coast and BC, Canada (the Woodfibre LNG project, to be on-stream by 2027).
- Enbridge plans to pay out C$7 billion in dividends in 2022, reflecting a 3% per-share dividend growth at 65% cash flow dividend payout, and buy back C$150 million worth of shares. Its forward yield is at 7.1% as of October 21, 2022.
Valuation
At a forward EV/EBITDA of 12.6X, Enbridge seems to be perfectly priced to the forward dividends (US$2.67 per share) and the 3% per-share dividend growth guidance, for a high-yield investor who expects a 10% total return. Enbridge appears to be more expensive than the other high-quality midstream stocks (averaging 10.3X). For an adequate margin of safety, one may consider an entry in the neighborhood of US$30 per share.
However, if you just want to beat the 8.3% CPI, my calculation indicates you could buy the stock all the way up to US$50 per share.
Fig. 2. Stock chart of Enbridge, dividend back-adjusted, shown with the WTI benchmark oil price (modified after Seeking Alpha and Barchart)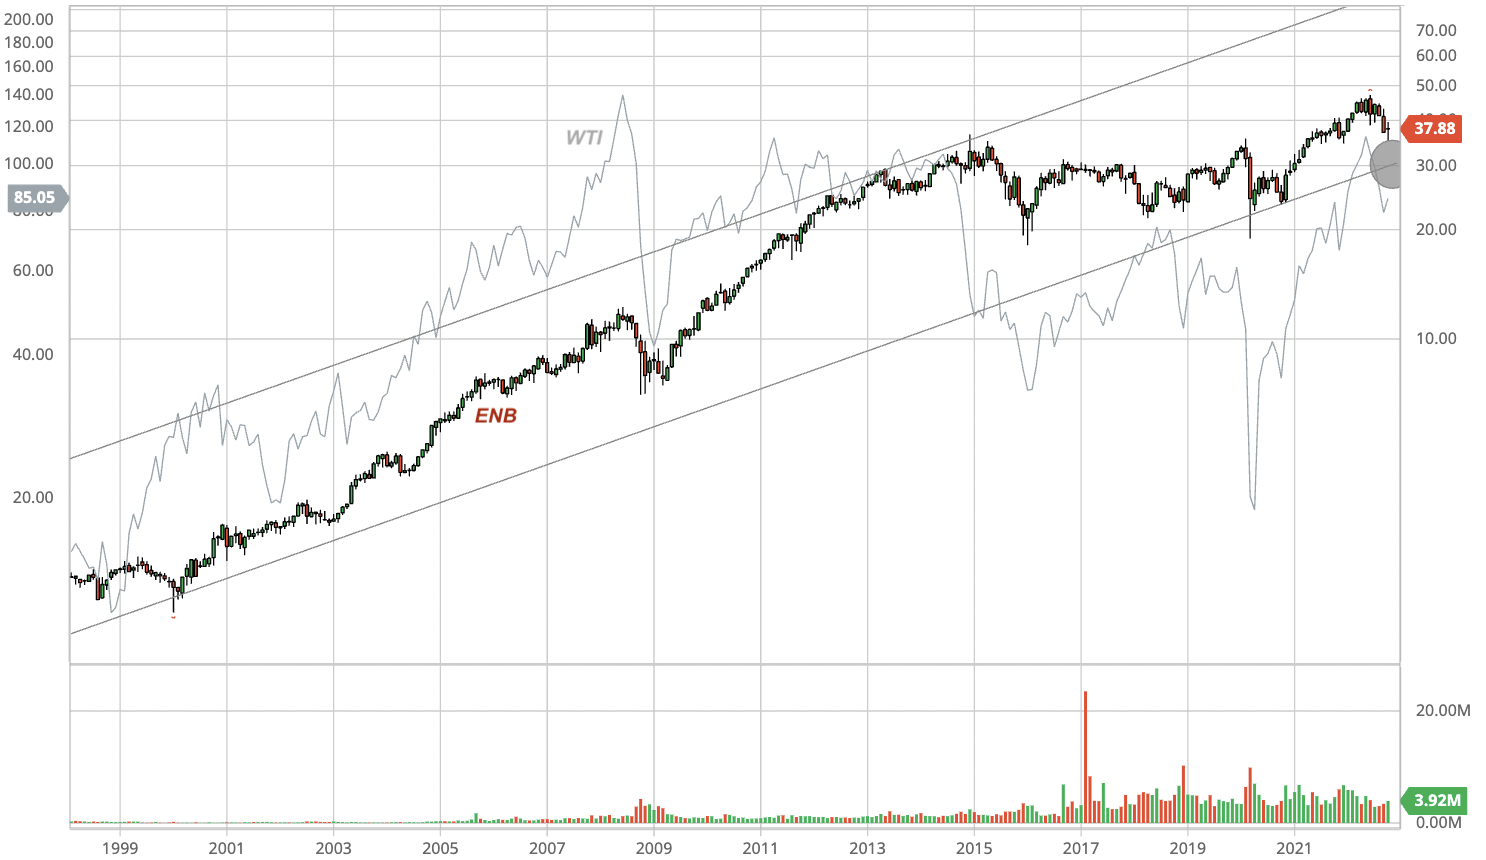
Risks
Enbridge does expose investors to the following risks:
- Enbridge often trades with the oil prices, even though it has minimal commodity price exposure (Fig. 2). It is also exposed to the volatility as seen in the CND-USD exchange rate.
- Approximately 65% of its EBITDA is derived from assets with revenue inflators, and 15% of its EBITDA is sourced from assets with regulatory mechanisms for recovering rising costs, for a total of ~80% under inflation protections. In other words, the remaining 20% of its EBITDA is subject to inflation, including rising material and labor costs.
- As a pipeline operator, Enbridge runs the risk of oil spillage.
- Enbridge currently has a BBB+ stable or comparable credit rating from the credit rating agencies, and would like to keep debt/EBITDA below 4.7X by year-end 2022. To that end, in late September 2022, Enbridge reached an agreement with 23 First Nation and Métis communities, whereby the indigenous groups will buy a combined 11.57% interest in seven pipelines operated by the company in the Athabasca region for C$1.12B (or US$816 million).
T. Rowe Price
Growth
In the last 10 years, T. Rowe Price managed to grow revenue at a CAGR of 8.8%, EBITDA at 9.3%, net income at 10.1% and, due to share buybacks, EPS at 11.1%. It was able to maintain relatively stable margins. Besides, it converted an average of 97% of net income into leveraged free cash flow, which suggests high-quality earnings.
Underpinned by profitable growth, T. Rowe Price was able to raise dividends at a CAGR of 12.2% during that time while keeping the payout between 33% and 45%.
Supposing it maintains the historical dividend growth rate, T. Rowe Price will be yielding 16.3% on cost by 2032 (Fig. 1).
Valuation
T. Rowe Price is currently valued at a P/E of 9.5X or an EV/EBITDA multiple of 5.9X, both on a trailing 12-month basis. These multiples are 40-44% below the 5-year averages, and are either near or at the lowest level in the last 10 years.
The main reason that T. Rowe Price trades at such low multiples is the 52% selloff from the recent peak (Fig. 3). Because its revenue is in direct correlation to the assets under management, a decline in the AUM is bound to have an impact on its financial performance. Its AUM fell from US$1.69 trillion as of December 31, 2021, to US$1.23 trillion as of September 30, 2022, a decline of 58%.
Fig. 3. Stock chart of T. Rowe Price, dividend back-adjusted, shown with SPY (modified after Seeking Alpha and Barchart)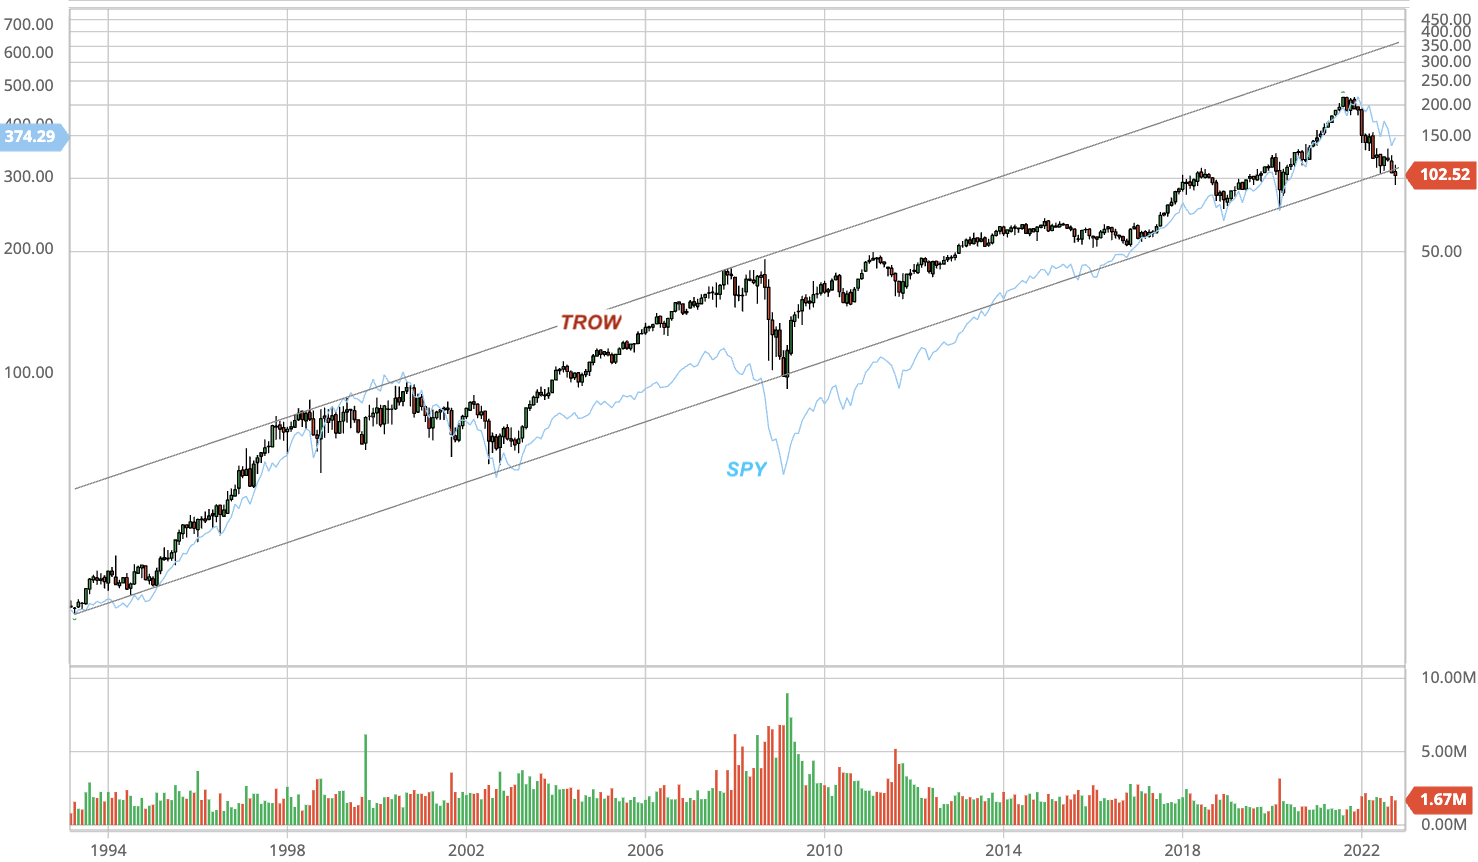
However, as a fellow Seeking Alpha author pointed out, multiple previous bear markets – including the Great Depression and the global financial crisis – seem to suggest that share price collapses tend to be short-lived and followed by rapid recovery and new all-time highs. The current pullback is likely no exception.
The challenge is to time an advantageous entry. My calculation suggests, for an investor with a 15% hurdle rate of total return, T. Rowe Price currently offers a 37% discount, large enough for such a high-quality business with decades of profitable growth.
Risks
The primary risk for dividend growth investors is T. Rowe Price may not be able to raise the dividends for an extended period of time. That seems highly unlikely. Firstly, T. Rowe Price had US$2.1 billion in cash and only US$307 million in total debt as of the 2Q2022, equivalent to US$7.9 per share of net cash, which can be distributed as dividends. Secondly, T. Rowe Price made US$3.90 per share in net income in the 1H2022. Even if it only makes US$0.45 per share in each of the 3Q and 4Q of 2022 – i.e., a 86% decline from the 4Q2021, a low probability event – the US$4.80 per share dividends are still fully covered.
Investor takeaways
Like the dividend kings, the dividend champions are rich in high-quality high-yield and DGI ideas.
Our screening of the dividend champions generates two ideas that are in or near the window of opportunity:
- Enbridge is for high-yield investors. For an investor with a 10% hurdle total return, a large enough margin of safety may appear if the stock pulls back to ~US$30 per share.
- T. Rowe Price is a great dividend growth investing target. For a long-term dividend growth investor in want of a 15% total return, the stock is undervalued.
Should a global recession occur, a generational opportunity may arise for income investors to make an entry into these two dividend champions.
Be the first to comment