

Lemon_tm
Overview
In this series of articles, I will be reviewing Dividend Champions from a specific industry and selecting stocks as long-term buys, current holds, or stocks to avoid based on a variety of financial and valuation metrics. More information regarding the Dividend Champions list can be found here.
I believe that one of the best ways to improve is by looking back and reviewing your past work. Because of this for the first five articles of this series, I will be looking back at the prior articles I wrote on this subject five years ago. For Part 3, I will be looking at Dividend Champions from the Chemicals industry. The related article from five years ago can be found here.
Prior Article Review
In the original article from 2017, there were 6 chemicals Dividend Champion stocks that I reviewed. Those stocks included:
- Air Products and Chemicals (APD)
- H.B. Fuller (FUL)
- RPM International (RPM)
- Clorox Company (CLX)
- Ecolab (ECL)
- Stepan Company (SCL)
Based on the metrics I used to review the stocks, the top two scoring stocks were Air Products and Chemicals and Clorox. The worst-scoring stock was RPM International. When looking at each stock’s total returns since the publication of the article, the scoring system did not perform as well as I hoped it would. Some of the rankings were pretty accurate, but two of them were big misses.
Score Ranking vs Total Returns
In the table below, I am listing the 6 stocks in order of total returns since the original article publication five years ago and comparing that to the score ranking (1 is the highest, 6 lowest) it received at that time.
| Stock | Total Return Since 11/13/2017 | Score Ranking from 2017 Article |
| RPM International | 91.21% | 6 |
| Air Products and Chemicals | 69.82% | 1 |
| Stepan Company | 24.24% | 5 |
| H.B. Fuller | 23.96% | 4 |
| Ecolab | 17.66% | 3 |
| Clorox | 16.03% | 2 |
As stated earlier, some of the rankings in my prior article were spot on, while a few others did not hit the mark. On the positive side, my highest-scoring stock from the article, Air Products and Chemicals, has had the second-best performance in its stock over the past five years. Stepan Company, H.B. Fuller, and Ecolab performed in the reverse order in terms of total returns but the differences are small enough that I feel that the rankings were still a useful guide.
On the negative side, RPM International was my lowest-scoring stock of the original article and it has seen the highest returns since publication. The other big miss would be Clorox. It was my 2nd highest-ranked stock and has seen the worst overall total returns during this time period.
Analyzing the Misses
In determining the rankings of the original article, I ranked each stock based on the following criteria: Revenue Growth, Earnings Growth, ROA, ROE, ROIC, Dividend Yield, PE Ratio, and Price to Book value.
Updating The Scoring System
Each of the metrics I used in the original article will continue to be used; however, I have applied the following adjustments based on the review of results from the first two parts of this series of articles:
- Revenue/Earnings Growth – The time frame of these 2 metrics will be shortened from 5 years to 3 years to place more importance on recent growth
- Dividend Growth – This metric will be weighted so that its impact on the total score is reduced by 50%.
- PE Ratio – In the original article, I ranked the stocks based on the trailing PE ratio. For this new series of articles, I will be using its normalized PE ratio to help determine the company’s long-term value.
- Price to Book Value – This metric will be weighted in the same manner as dividend growth
In addition to these updates, I will be adding two additional metrics from YCharts to the rankings of these stocks:
- Fundamental Score – additional details on this score can be found here.
- Momentum Score – additional details on this score can be found here.
New to part three will be a few additional changes to metrics based on analyzing the misses in relation to RPM International and Clorox. In reviewing the original scores, I noticed that RPM had the lowest or second-lowest ranking in all of the ROA, ROE, and ROIC categories and the fact that it scored the highest in revenue growth was not enough to keep it from the bottom of the pack. In addition, Clorox scored the highest or second highest in these same metrics, while ranking 4th in terms of revenue and earnings growth. I think the changes outlined above along with a similar weighting to the ROA, ROE, and ROIC metrics for this industry will result in a more reliable long-term outlook.
Stock Changes
As in the prior article, I will only be ranking Dividend Champion stocks. Out of the 6 reviewed from the original article, only 5 of those remain on the Dividend Champion stocks list (as of 9/30/2022) with Clorox no longer listed. There are four additional stocks now and they include:
The New Metrics
Revenue Growth
This chart shows the nine stocks and their revenue growth over the past three years.
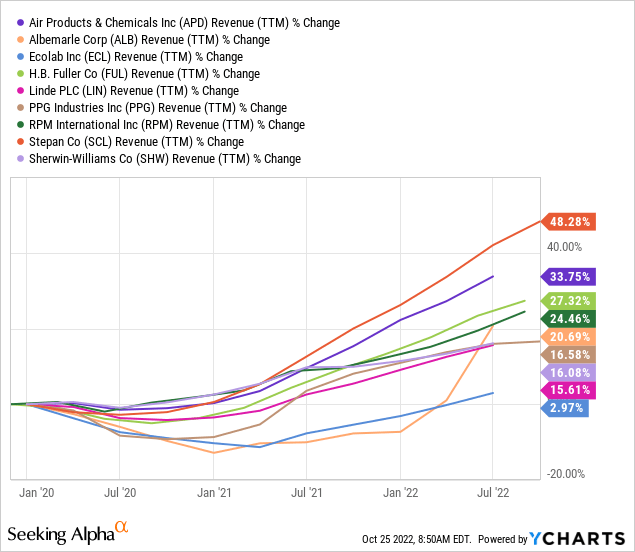
You can see that Stepan has seen the most revenue growth, while Ecolab has seen the lowest growth with only a 2.97% increase during this time.
Earnings Growth
This chart shows the nine stocks and their earnings growth over the past three years.
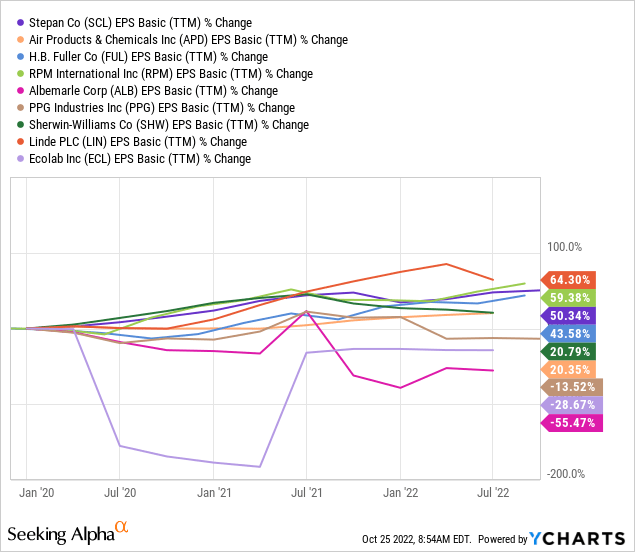
Unlike revenue growth, which saw each of the nine stocks with positive growth over the past three years, you can see in this chart that three of the stocks have seen negative earnings growth during this time, with Albemarle seeing the biggest drop in earnings.
Return on Assets
This chart shows the ROA value of each of the nine stocks.
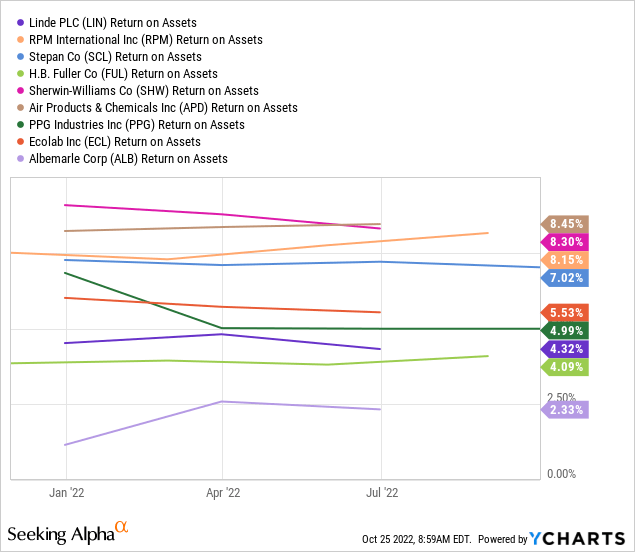
Air Products and Chemicals has the highest current ROA value at 8.45%, while Albemarle has the lowest value at 2.33%.
Return on Equity
This chart shows the nine stocks and their related ROE values.
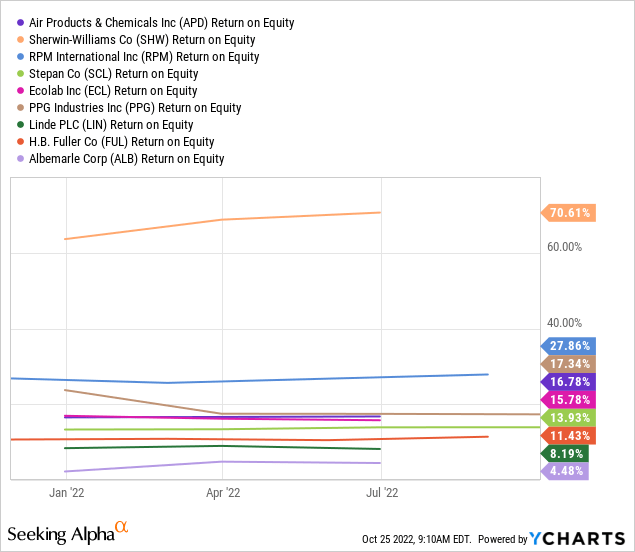
The range of values is fairly wide between the nine stocks with Sherwin- Williams having the highest value at 70.61% and Albemarle once again coming in at the bottom of the pack with a value of 4.48%
Return on Invested Capital
This chart shows the ROIC value for each of the nine stocks.
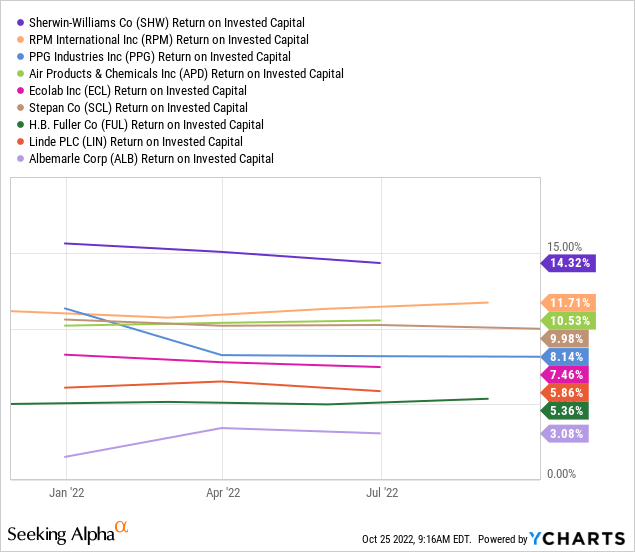
The ROIC rankings came in nearly identical to the ROE rankings with only a few stocks changing spots.
Dividend Yield
This chart shows the current dividend yield of each of the nine stocks.
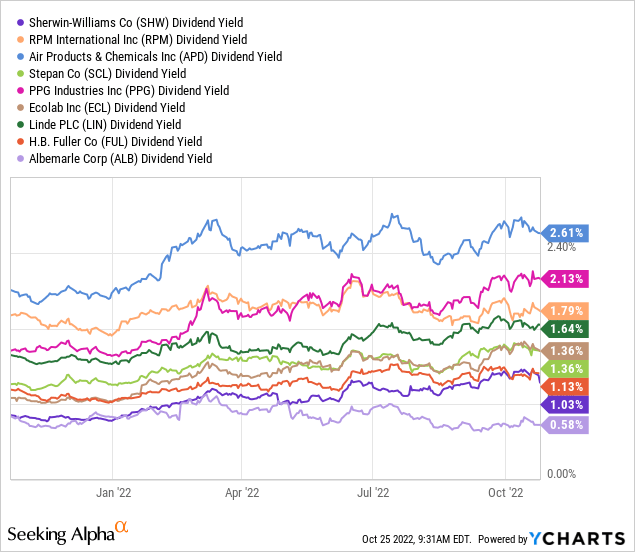
Air Products and Chemicals has the highest yield at 2.61%, while Albemarle has the lowest yield at 0.58%.
Dividend Growth
In terms of dividend growth over the past five years, the nine stocks are sorted below in order of highest growth.
- Sherwin-Williams – 111.80%
- Air Products and Chemicals – 70.53%
- Stepan – 62.22%
- Linde – 48.57%
- PPG – 37.78%
- RPM International – 31.25%
- H.B. Fuller – 26.67%
- Ecolab – 24.39%
- Albemarle – 23.44%
Normalized PE ratio
This chart shows the normalized PE ratio for each of the nine stocks.
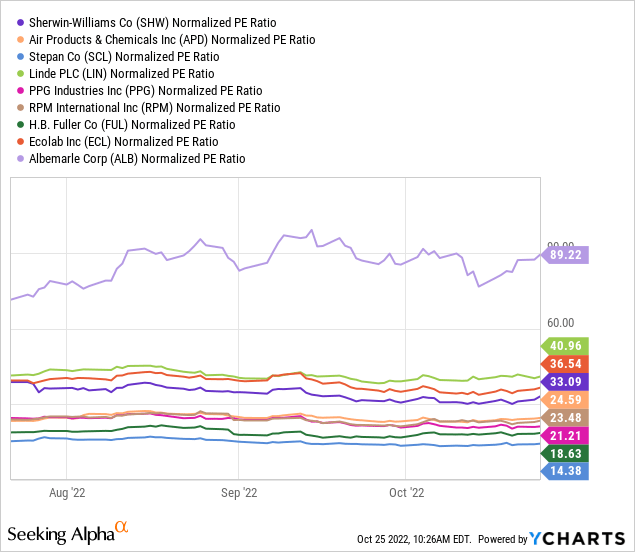
Stepan has the most attractive PE ratio, while Albemarle has the last attractive current normalized PE ratio.
Price to Book Value
The chart below shows the nine stocks in relation to their current Price to Book Values.
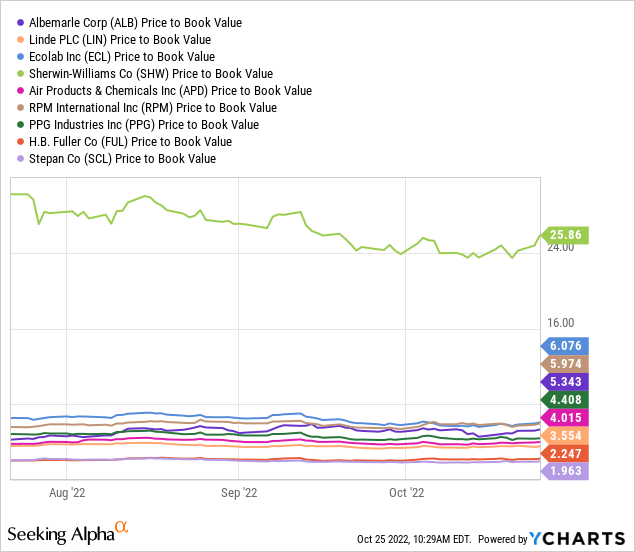
For this valuation metric, Stepan once again comes in as the most attractively valued, while Sherwin-Williams shows at the least attractively valued based on Price to Book value.
Fundamental Score
In terms of fundamental scores, PPG Industries and Stepan are the two stocks with the highest score of 10. Four stocks (Sherwin-Williams, RPM International, Air Products and Chemicals, and H.B. Fuller) have scores of 9 and the remaining three stocks each had a fundamental score of 8.
Momentum Score
Regarding momentum scores, no stock had a score of 10, but two of them (RPM International and Albemarle) had scores of 9. Air Products and Chemicals and H.B. Fuller each had scores of 8. Stepan and Linde had scores of 7 and the remaining three stocks each had a score of 5.
Score Rankings
In the table below, you will see the 9 stocks sorted in terms of total overall scores. I used pretty much the same system I used in my prior articles with the few adjustments mentioned before. For example, the stock with the highest revenue growth will have a score of 16, while the stock with the lowest revenue growth will have a score of 1. These ranking scores are divided by two for both the Dividend Growth and Price to Book Value metrics and the three ROA, ROE, and ROIC metrics. In addition, the two new metrics (Fundamental Score and Momentum Score) will not be scored based on ranking, instead, the actual scores will be added to each stock’s overall score to determine the rankings.
| Revenue Growth 3 year | Ranking | Earnings Growth 3 year | Ranking | Return on Assets | Ranking | Return on Equity | Ranking | Return on Invested Capital | Ranking | Dividend Yield | Ranking | Dividend Growth | Ranking | Forward PE ratio | Ranking | Price to Book Value | Ranking | Fundamental Score | Momentum Score | Total Score | |
| Stepan Company | 48.28% | 9 | 50.34% | 7 | 7.02% | 3 | 13.93% | 2 | 9.98% | 3 | 1.37% | 4.5 | 62.22% | 3.5 | 14.38 | 9 | 1.96 | 4.5 | 10 | 7 | 62.5 |
| Air Products and Chemicals, Inc. | 33.75% | 8 | 20.35% | 4 | 8.45% | 4.5 | 16.78% | 3 | 10.53% | 3.5 | 2.61% | 9 | 70.53% | 4 | 24.61 | 5 | 4.01 | 3 | 9 | 8 | 61 |
| RPM International Inc. | 24.46% | 6 | 59.38% | 8 | 8.15% | 3.5 | 27.86% | 4 | 11.71% | 4 | 1.80% | 7 | 31.25% | 2 | 23.46 | 6 | 5.96 | 1.5 | 9 | 9 | 60 |
| PPG Industries, Inc. | 16.58% | 4 | -13.52% | 3 | 4.99% | 2 | 17.34% | 3.5 | 8.14% | 2.5 | 2.13% | 8 | 37.78% | 2.5 | 21.21 | 7 | 4.41 | 2.5 | 10 | 5 | 50 |
| H.B. Fuller Company | 27.32% | 7 | 43.58% | 6 | 4.09% | 1 | 11.43% | 1.5 | 5.36% | 1 | 1.13% | 3 | 26.67% | 1.5 | 18.63 | 8 | 4.01 | 3.5 | 9 | 8 | 49.5 |
| The Sherwin-Williams Company | 16.08% | 3 | 20.79% | 5 | 8.30% | 4 | 70.61% | 4.5 | 14.32% | 4.5 | 1.11% | 2 | 111.80% | 4.5 | 33.06 | 4 | 25.79 | 0.5 | 9 | 5 | 46 |
| Linde plc | 15.61% | 2 | 64.30% | 9 | 4.32% | 1.5 | 8.19% | 1 | 5.86% | 1.5 | 1.64% | 6 | 48.57% | 3 | 40.93 | 2 | 3.55 | 4 | 8 | 7 | 45 |
| Ecolab Inc. | 2.97% | 1 | -28.67% | 2 | 5.53% | 2.5 | 15.78% | 2.5 | 7.46% | 2 | 1.37% | 4.5 | 24.39% | 1 | 36.51 | 3 | 6.07 | 1 | 8 | 5 | 32.5 |
| Albemarle Corporation | 20.69% | 5 | -55.47% | 1 | 2.33% | 0.5 | 4.48% | 0.5 | 3.08% | 0.5 | 0.58% | 1 | 23.44% | 0.5 | 89.22 | 1 | 5.34 | 2 | 8 | 9 | 29 |
Conclusion
The top 3 stocks
Looking at the table above, you can see that the three stocks with the highest overall scores were very close to each other, separated by less than 3 points. These stocks include:
- Stepan – Total score of 62.5
- Air Products and Chemicals – Total score of 61
- RPM International – Total score of 60
The bottom 2 stocks
The score range from the top stocks to the bottom is fairly drastic. The two lowest scoring stocks include:
- Ecolab – Total score of 32.5
- Albemarle – Total score of 29
The remaining 4 stocks
The remaining four stocks are truly in the middle in terms of total scores with significant separation from both the top 3 stocks and the bottom 2. The four in between stocks include:
- PPG Industries – Total score of 50
- H.B. Fuller – Total score of 49.5
- Sherwin-Williams – Total score of 46
- Linde – Total score of 45
Final Thoughts
Air Products and Chemicals was my highest ranking stock in the original article published 5 years ago and saw the 2nd best return during that time period. In this new article and with the updated metrics, APD is the 2nd highest ranked stock and remains a great option for long term investors. Stepan is ranked just slightly higher due in part to its strong revenue growth and attractive valuation. I believe that all three top scoring stocks should be considered buys for long term investors.
In terms of the bottom two stocks, I think they both should be avoided. Albemarle scored last in 8 of the 11 scored metrics and Ecolab didn’t perform much better with the worst revenue growth and second worst earnings growth out of the nine reviewed stocks.
I believe the four middle of the pack stocks remain decent options for individual investors based on their goals. For example, Sherwin-Williams might be attractive to a dividend growth investor because it has seen very impressive dividend growth over the past five years. However, income investors might find its current yield of 1.11% too low to consider. Linde has the lowest overall score of the middle four stocks but has seen the best earnings growth over the past three years.
As always I suggest individual investors perform their own research before making any investment decisions. For part 4 of this series, I will be looking back at my article reviewing Dividend Champion stocks within the various food industry sectors and creating new rankings based on the current Dividend Champions within these sectors.
Be the first to comment