

adaask
Both Western Midstream Partners, LP (NYSE:WES) and Kinder Morgan, Inc. (NYSE:KMI) have investment-grade credit ratings, vaulting them into the upper echelon of quality midstream MLPs (AMLP). Both also happen to offer mouthwatering distribution yields, with WES boasting a 7.1% distribution yield and KMI boasting a 5.9% dividend yield.
In this article, we will review their Q2 results and then compare them side by side and offer our take on which one is a better buy.
Q2 Results
WES has put up solid Q2 results. Highlights from the quarter included:
- Solid underlying fundamentals that prompted management to reaffirm guidance.
- Fairly aggressive unit repurchases and debt paydown during the quarter. As a result, management believes it will be able to continue aggressively and opportunistically repurchasing units moving forward given its strong balance sheet position.
- Management also tentatively plans on paying out an enhanced distribution in the second half of the year assuming underlying business performance remains strong.
It was another steady-as-she-goes quarter for WES, as the company continues to generate a lot of cash which it is using to further deleverage, buy back units, and pay out a handsome distribution to unitholders while also pursuing high return, low risk organic growth projects.
Meanwhile, KMI posted strong results that prompted management to increase full-year guidance. In particular, distributable cash flow per share increased by 16% year-over-year and management pointed to the company’s inflation resistance on the earnings call:
We’re facing some cost headwinds, mostly because of added work this year. While costs are up, we’re actually doing very well in holding back the impacts of inflation. It’s hard to measure precisely, but based on our analysis, we are well below the headline PPI numbers that you’re seeing. And actually, we appear to be experiencing less than half of those increases. That’s due to much good work by our procurement and operations teams, and much of this good performance is attributable to our culture. We are frugal with our investors’ money.
This positive performance in the face of inflation is largely due to the fact that their cash flows are largely indexed to inflation. As management stated on the earnings call when asked about inflation impacts on cash flows:
we implemented the rate increase on July 1st of 8.7% across our assets. And based on where it’s tracking right now, I think that assuming PPI continues where it is and that we would implement the full thing, which is what we would expect, it’s somewhere in the neighborhood of 15% next year.
Business Model
Both businesses are primarily investments in natural gas and NGL midstream infrastructure. WES is much smaller than KMI (a $17.6 billion enterprise value compared to a $74.5 billion enterprise value) and its assets are located in Texas, New Mexico, the Rocky Mountains, and North-central Pennsylvania.
WES’s best assets are located in the Delaware Basin where it possesses a leading position as low-emission oil gatherer, three-stream midstream provider, water gatherer and disposer, and a gas processer. The vast majority of its cash flow is commodity price resistant. As it states in its 2021 10-K:
We believe a substantial majority of our cash flows are protected from direct exposure to commodity-price volatility, as 93% of our wellhead natural-gas volume (excluding equity investments) and 100% of our crude-oil and produced-water throughput (excluding equity investments) were serviced under fee-based contracts for the year ended December 31, 2021. In addition, we mitigate volumetric risk through minimum-volume commitments and cost-of-service contract structures. For the year ended December 31, 2021, 81% of our natural-gas throughput, 96% of our crude-oil and NGLs throughput, and 100% of our produced-water throughput were supported by either minimum-volume commitments with associated deficiency payments or cost-of-service commitments.
Meanwhile, KMI boasts the largest natural gas transmission network as well as the number one CO2 transportation business, the number one independent refined products transportation network, and the largest independent terminal business on the North American continent. This gives it compelling economies of scale and irreplaceable mission-critical competitive positioning. In fact, it transports roughly 40% of the United States’ total natural gas consumption and exports, making it a leader in arguably the world’s most important single energy resource in the coming decades.
Furthermore, ~97% of its cash flow comes from take-or-pay fee-based/hedged contracts, rendering it fairly resistant to commodity price and macroeconomic volatility.
While both business models are quite solid, we give the edge to KMI here due to its vastly superior size which improves its cash flow stability and also gives it some competitive advantages.
Balance Sheet
As was already stated, both WES and KMI have investment-grade credit ratings, though KMI’s (BBB) is one notch better than WES’s (BBB-).
Both businesses are also well-positioned in terms of leverage ratios, with WES being one of the lowest in the industry at under 3.4x and KMI set to end the year below 4.3x.
Meanwhile, WES has over $1.8 billion in liquidity (over 10% of current enterprise value) with no meaningful debt maturities until 2025 with the vast majority of its debt maturing in 2028 or later. KMI has $1.1 billion in cash on hand and what it characterizes as “ample liquidity” overall, though it did not disclose an exact number in its latest quarterly report.
Overall, both businesses have very solid balance sheets. WES has a significantly lower leverage ratio, while KMI has a higher credit rating. That said, we believe KMI earns a higher credit rating by virtue of its larger asset portfolio and longer operating history, so we think that WES actually has a slightly superior balance sheet. As a result, we give WES a slight edge here.
Distribution Safety
Both businesses boast very safe distributions. Based on expected 2022 distributable cash flow per unit and their current respective quarterly distribution rates, WES’s coverage ratio is 2.3x and KMI’s coverage ratio is 2.0x. Based on expected 2023 distributable cash flow per unit and their current respective quarterly distribution rates, WES’s coverage ratio increases to 2.4x and KMI’s coverage ratio increases to 2.1x. Overall, we rate their distribution safeties as being exceptionally strong, but give a slight edge to WES here.
Track Record
KMI is infamous among many long-suffering investors for brutally slashing its payout a number of years ago after management insisted it was safe. Then, in recent years, it has failed to deliver on its initially announced aggressive dividend growth rate. Meanwhile, WES – despite having some past dividend cut drama of its own – has significantly outperformed KMI since both of them have traded publicly.
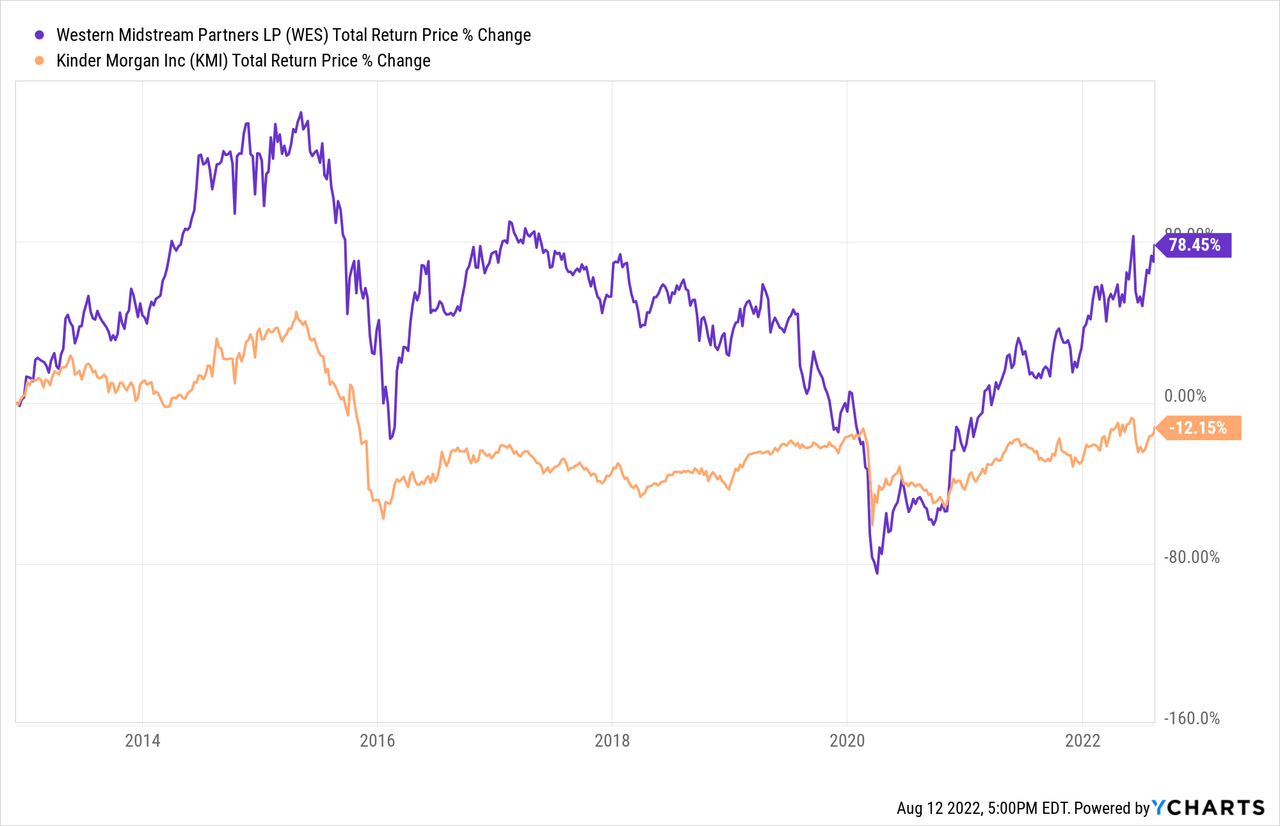
Of particular interest, however, is that WES crashed much harder than KMI did during the energy crisis of 2020 and has significantly outperformed KMI since then as well. As a result, it may be inferred that management views WES as higher risk than KMI. Overall, we give the track record edge to WES given its significantly superior total return performance over the course of its public existence as well as in recent years.
Valuation
Here is a side-by-side comparison of the two businesses based on several valuation metrics:
| WES | KMI | |
| EV/EBITDA | 7.9x | 9.9x |
| EV/EBITDA (5-Yr Avg) | 9.8x | 10.3x |
| P/DCF | 6.2x | 8.3x |
| Distribution Yield | 7.1% | 5.9% |
Overall, WES looks to be the clear winner in terms of cheaper valuation, as it is also trading at a larger discount to its historical average EV/EBITDA multiple than KMI is, despite recently aggressively hiking its distribution, paying down debt aggressively, buying back units hand-over-fist, and management strongly hinting at an enhanced distribution later this year. That said, KMI remains an attractive value relative to its recent value, especially considering the favorable environment and outlook for the business which, if anything, should lead to it commanding a premium valuation at the moment.
Investor Takeaway
Both WES and KMI offer investors similar investment theses: investment grade balance sheets and high-quality midstream asset portfolios with checkered pasts that include massive distribution cuts. However, both have undergone impressive turnarounds that have involved aggressive debt reduction efforts by both. Now, with their investment grade balance sheets secured and both businesses gushing free cash flow, they are now both growing their payouts and buying back equity.
That said, investors should keep the following factors in mind when deciding which to invest in:
(1) WES is meaningfully cheaper and offers a much higher yield.
(2) KMI has a better diversified portfolio of assets, and its equity price has held up better during periods of volatility in the recent past. As a result, it is likely a more conservative bet.
(3) WES issues a K1 tax form, whereas KMI issues a 1099.
Overall, we prefer WES to KMI at the moment, but rate both as Buys.
Be the first to comment