

Lemon_tm
Overview
In this series of articles, I will be reviewing Dividend Champions from a specific industry and selecting stocks as long-term buys, current holds, or stocks to avoid based on a variety of financial and valuation metrics. More information regarding the Dividend Champions list can be found here.
I believe that one of the best ways to improve is by looking back and reviewing your past work. Because of this for the first five articles of this series, I will be looking back at the prior articles I wrote on this subject five years ago. For Part 1, I will be looking at Dividend Champions from the Banking industry. The related article from five years ago can be found here.
Prior Article Review
In the original article from 2017, there were 12 banking Dividend Champion stocks that I reviewed. Those stocks included:
- 1st Source (SRCE)
- Chesapeake Financial (OTCQX:CPKF)
- Commerce Bancshares (CBSH)
- Community Trust (CTBI)
- Eagle Financial Services (OTCQX:EFSI)
- Farmers & Merchants (OTCQX:FMCB)
- First Financial (THFF)
- People’s United Bancorp – acquired in 2021 by M&T Bank
- Tompkins Financial (TMP)
- UMB Financial (UMBF)
- United Bankshares (UBSI)
- Westamerica Bancorp (WABC)
Based on the metrics I used to review the stocks, the top four scoring stocks were Farmers & Merchants, Chesapeake Financial, Commerce Bancshares, and Eagle Financial Services. The worst-scoring stock was Westameria Bancorp. When looking at each stock’s total returns since the publication of the article, the scoring system performed well, but not as well as I would have liked to see. (I am removing “People’s United Bancorp” from further analysis since it was acquired in 2021 (in my original article it was ranked 9th out of 12)).
Score Ranking vs Total Returns
In the table below, I am listing the 11 remaining stocks in order of total returns since the original article publication five years ago and comparing that to the score ranking (1 is the highest, 11 lowest) it received at that time.
| Stock | Total Return Since 10/13/2017 | Score Ranking from 2017 Article |
| Commerce Bancshares | 68.01% | 3 |
| Farmers & Merchants | 59.52% | 1 |
| Eagle Financial Services | 41.67% | 4 |
| UMB Financial | 27.43% | 10 |
| United Bankshares | 26.98% | 7 |
| 1st Source | 21.29% | 8 |
| Community Trust | 15.49% | 6 |
| Westamerica Bancorp | 14.51% | 11 |
| First Financial | 13.92% | 9 |
| Chesapeake Financial | 6.88% | 2 |
| Tompkins Financial | 4.08% | 5 |
As stated earlier, some of the rankings in my prior article were spot on, while a few others did not hit the mark. On the positive side, my highest-scoring stock from the article, Farmers & Merchants, has had the second-best performance in its stock over the past five years. Commerce Bancshares and Eagle Financial services have had the best and third-best returns and were ranked 3rd and 4th in my article. Also, a lot of the middle-of-the-pack stocks I feel were ranked appropriately.
On the negative side, two higher-ranked stocks, Chesapeake Financial (ranked 2nd) and Tompkins Financial (ranked 5th) have had the worst stock returns during this time. The only other miss I would say was that my lowest-scoring stock, Westamerica Bancorp, has performed better than expected based on the ranking.
Analyzing the Misses
In determining the rankings of the original article, I ranked each stock based on the following criteria: Revenue Growth, Earnings Growth, ROA, ROE, ROIC, Dividend Yield, PE Ratio, and Price to Book value.
Tompkins Financial and Chesapeake Financial
When looking at the scoring of these two stocks, nothing jumps out as clear triggers that would have caused these two stocks to have scored high while performing low, but there are a few items to consider. I think the biggest item to consider is that, while I ranked each stock on the criteria outlined above, there was no weighting applied to these criteria, meaning that revenue growth and dividend growth were given the same weight when determining the overall score and rankings of the stocks. For example, dividend growth is important, but is not as impactful to future success as recent revenue or earnings growth.
Another area in which I think the rankings could be improved upon is by looking at a shorter period of time when ranking revenue and earnings growth. Both of these were previously looking at the past five years. For this new series of articles, I will be shortening the time frame from 5 years to 3 years to place a higher emphasis on more recent growth.
Westamerica Bancorp
As stated previously, Westamerica was my worst-ranking stock in that 2017 article but performed better than three of my higher-ranking stocks in terms of total returns since article publication. In the article, this stock scored last in revenue growth, earnings growth, P/E ratio, and Price to Book Value. Shortening the time frame looked at for revenue and earnings growth (from 5 years to 3 years) would have helped Westmarica Bancorp’s rating slightly but not by much. However, the weighting of the dividend growth metric along with the valuation metrics would also have improved its ranking.
Updating The Scoring System
I will be using a similar ranking system as I used 5 years ago with a few tweaks that I hope will only improve the results in terms of predicting future returns. Each of the metrics I outlined above will continue to be used; however, the following adjustments will be applied:
- Revenue/Earnings Growth – The time frame of these 2 metrics will be shortened from 5 years to 3 years to place more importance on recent growth
- Dividend Growth – This metric will be weighted so that its impact on the total score is reduced by 50%.
- P/E Ratio – In the original article, I ranked the stocks based on the trailing P/E ratio. For this new series of articles, I will be using its normalized P/E ratio to help determine the company’s long-term value.
- Price to Book Value – This metric will be weighted in the same manner as dividend growth
In addition to these updates, I will be adding two additional metrics from YCharts to the rankings of these stocks:
- Fundamental Score – additional details on this score can be found here.
- Momentum Score – additional details on this score can be found here.
Stock Changes
As in the prior article, I will only be ranking Dividend Champion stocks. Out of the 12 reviewed from the original article, only 8 of those remain on the Dividend Champion stocks list (as of 9/30/2022) and they include:
- Commerce Bancshares (CBSH)
- Community Trust Bancorp (CTBI)
- 1st Source Corporation (SRCE)
- First Financial Corporation (THFF)
- Tompkins Financial Corporation (TMP)
- United Bankshares, Inc. (UBSI)
- UMB Financial Corporation (UMBF)
- Westamerica Bancorp (WABC)
However, 8 additional stocks have become Dividend Champions bringing the total number of reviewed stocks for this article to 16. The additional stocks include:
- Arrow Financial Corporation (AROW)
- BancFirst Corporation (BANF)
- Community Bank System (CBU)
- Cullen/Frost Bankers (CFR)
- Enterprise Bancorp (EBTC)
- The First of Long Island (FLIC)
- Bank OZK (OZK)
- Southside Bancshares (SBSI)
The New Metrics
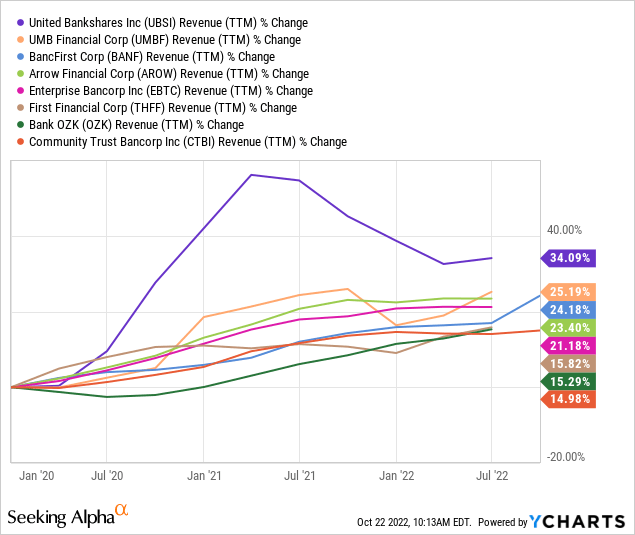
Revenue Growth
The first chart shows the 8 stocks with the highest revenue growth over the past three years with United Bankshares leading the way.
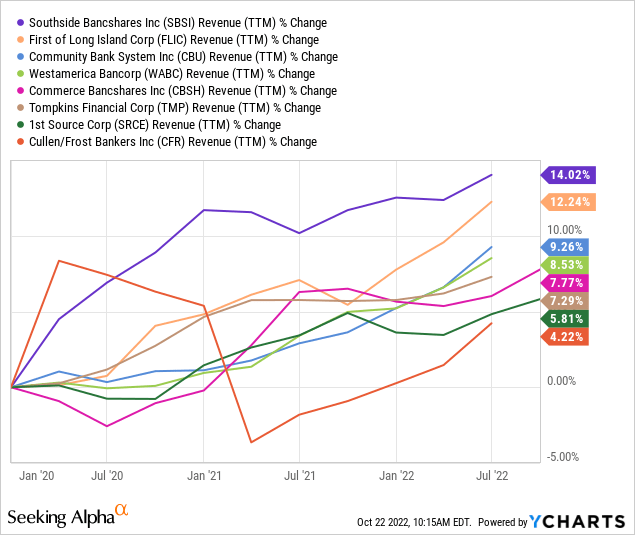
This second chart shows the 8 stocks with the lowest revenue growth over the past three years with Cullen/Frost Bankers at the bottom of the pack.
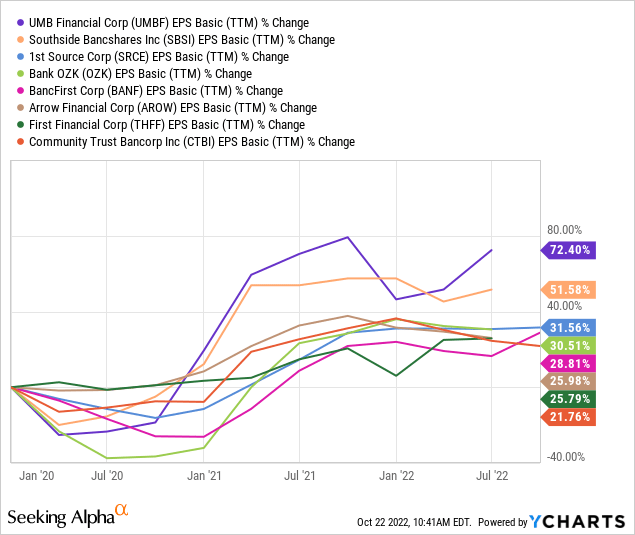
Earnings Growth
This first chart shows the top 8 stocks in terms of earnings growth over the past three years. While United Bancshares led the way in terms of revenue growth, it didn’t crack the top 8 in terms of earnings growth with UMB Financial taking the top spot.
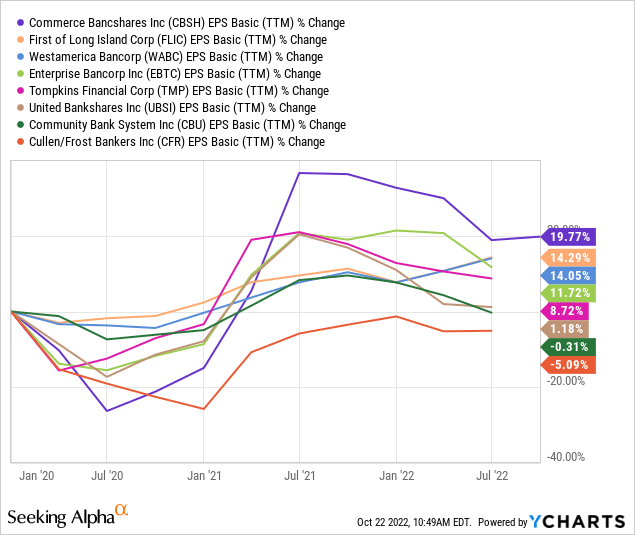
The second chart shows the bottom 8 stocks in terms of earnings growth over the past 3 years with both Community Bank System and Cullen/Frost Bankers seeing negative growth during this time period.
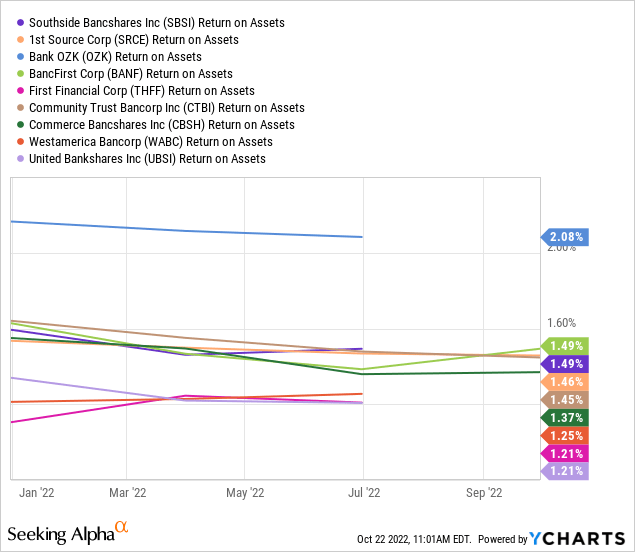
Return on Assets
The first chart shows the top 9 stocks in terms of ROA with Bank OZK having the highest ROA value. First Financial and United Bankshares tied at the bottom of the top stocks with a ROA value of 1.21%.
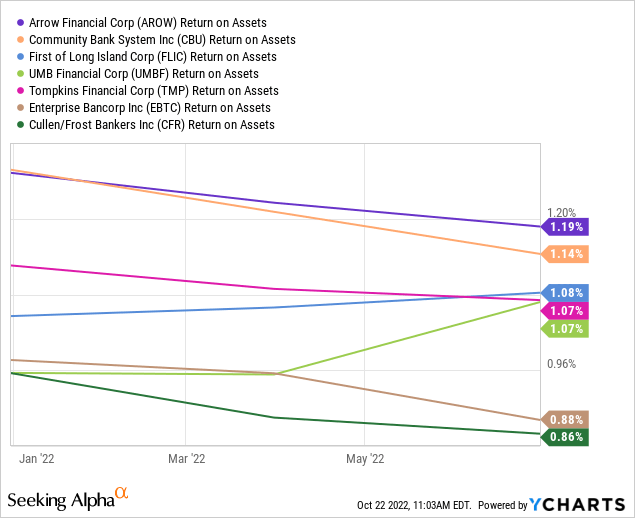
The second chart shows the remaining 7 stocks with Enterprise Bancorp and Cullen/Frost Bankers being the only two stocks with a ROA value under 1%.
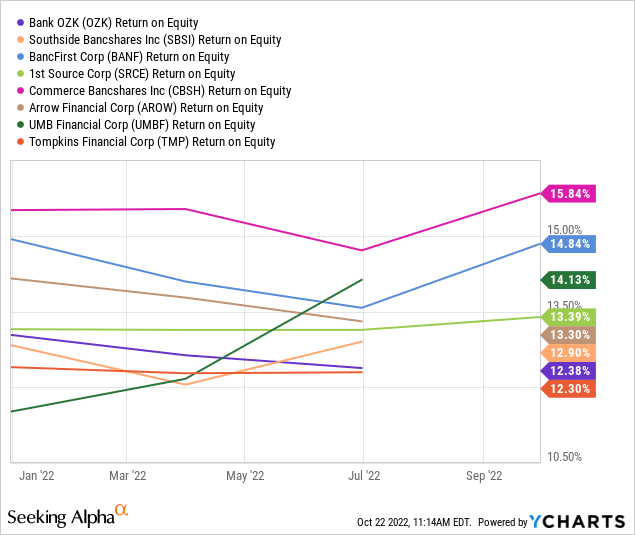
Return on Equity
The first chart shows the top 8 stocks in terms of ROE, with Commerce Bancshares leading the way.
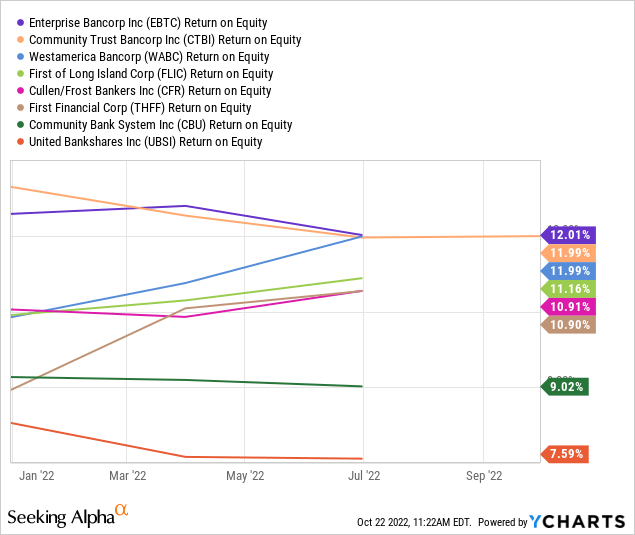
The second chart shows the bottom 8 stocks in terms of ROE, with Community Bank System and United Bankshares being the only two stocks with ROE values below 10%.
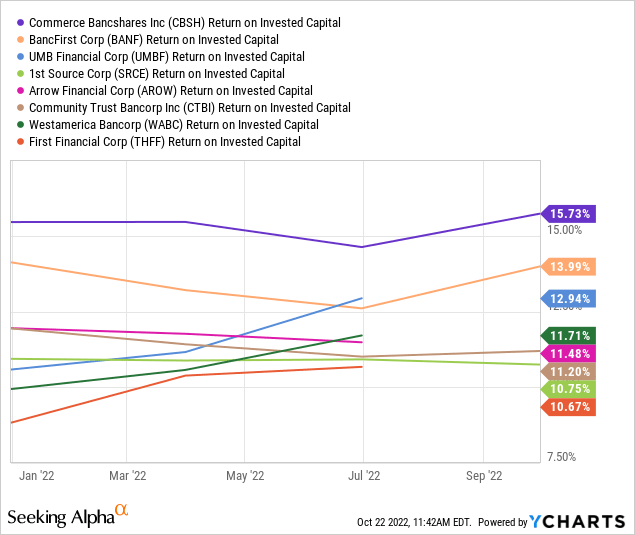
Return on Invested Capital
The first chart shows the top 8 stocks based on ROIC, with Commerce Bancshares coming out on top with a ROIC value of over 15%.
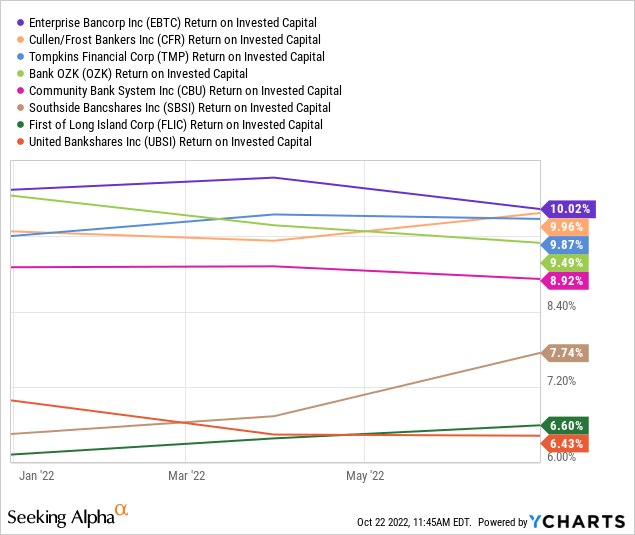
The second chart shows the bottom 8 stocks, with United Bankshares once again coming in at the bottom.
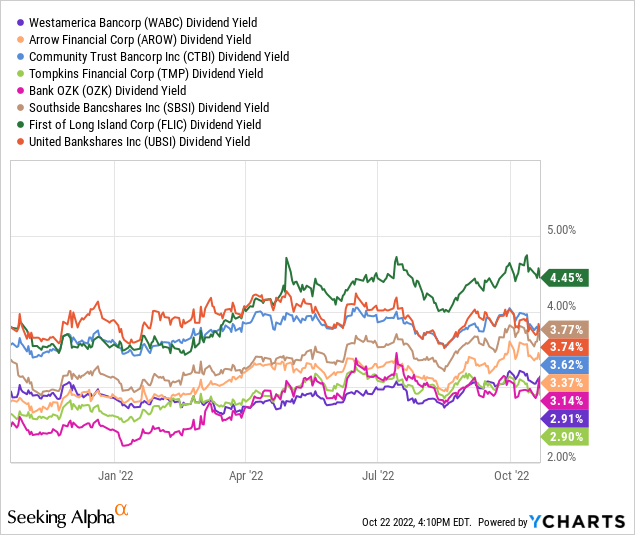
Dividend Yield
The first chart shows the top 8 dividend-yielding stocks, with First of Long Island being the only stock with a current yield over 4%.
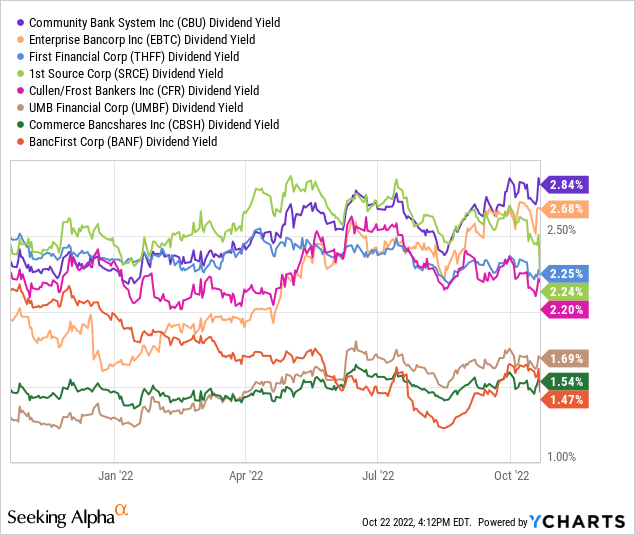
The second chart shows the remaining 8 stocks with UMB Financial, Commerce Bancshares, and BancFirst being the 3 stocks with current yields under 2%.
Dividend Growth
The level of dividend growth for these 16 stocks has a wide range over the past five years. The order of stocks as seen below is in order of highest growth during this period:
- BancFirst – 90.48%
- Bank OZK – 73.68%
- 1st Source – 60.00%
- Cullen/Frost Bankers – 52.63%
- Enterprise Bancorp – 51.85%
- Commerce Bancshares – 50.32%
- The First of Long Island – 40.00%
- UMB Financial – 34.55%
- Community Trust Bancorp – 33.33%
- Community Bank System – 29.41%
- Arrow Financial – 21.55%
- Tompkins Financial – 21.28%
- Southside Bancshares – 13.33%
- First Financial – 8.00%
- United Bankshares – 5.88%
- Westamerica Bancorporation – 5.00%
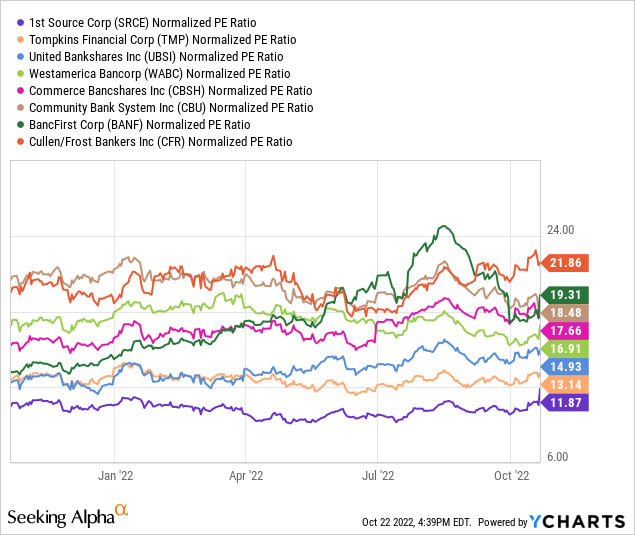
Normalized P/E ratio
The first chart shows the top 8 stocks in terms of Normalized P/E ratio with First of Long Island Corp having the best valuation.
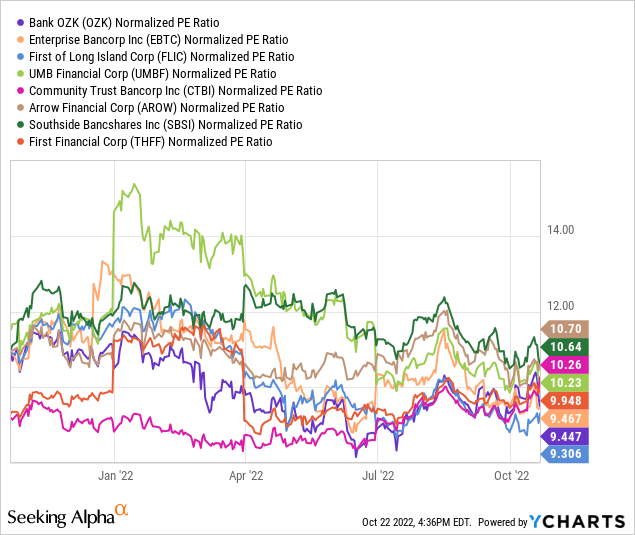
The second chart shows the remaining 8 stocks with Cullen/Frost Bankers having the least attractive valuation at over 21x.
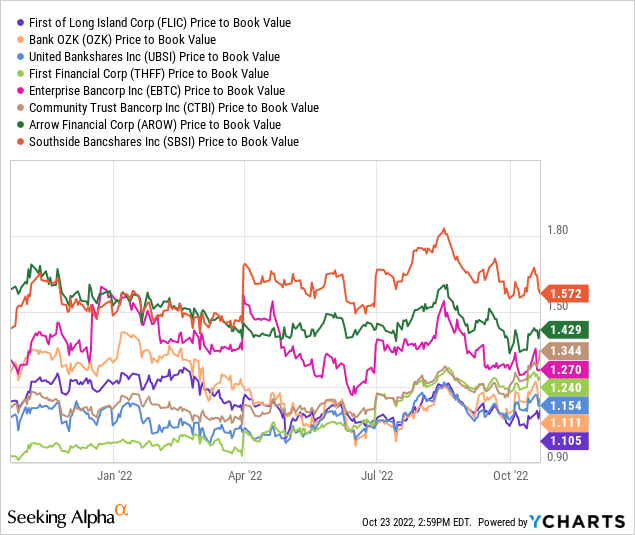
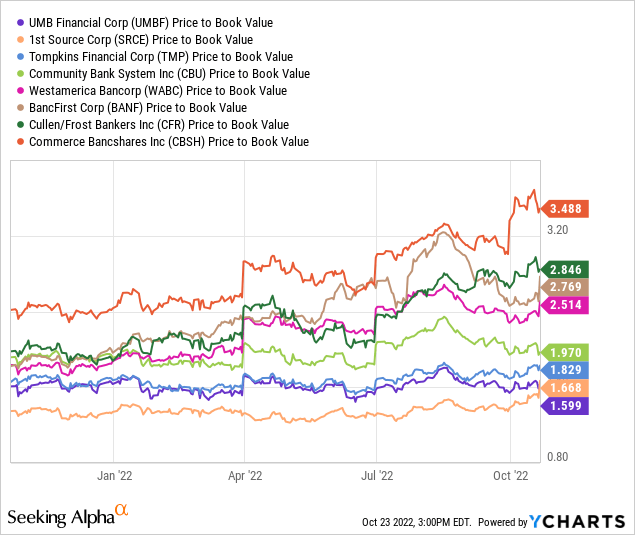
Price to Book Value
The first chart shows the top 8 stocks based on Price to Book Value, with First of Long Island and Bank OZK tying for the top spot.
The second chart shows the remaining 8 stocks, with Commerce Bancshares having the only Price to Book Value over 3x.
Fundamental Score
When reviewing YCharts Fundamental Score for each of these stocks, it became clear that all of the stocks had fairly strong scores with each stock coming in with a fundamental score of 7, 8, or 9.
The two stocks with scores of 7 include: Westamerica Bancorp and BancFirst
Five stocks had scores of 8 and they include: Tompkins Financial, Southside Bancshares, Arrow Financial, Community Trust Bancorp, and First of Long Island.
The remaining nines stocks all had fundamental scores of 9.
Momentum Score
Similar to the fundamental scores, each stock had fairly strong momentum scores.
The only stock with a momentum score of 10 is BancFirst America.
Four stocks had momentum scores of 7: Tompkins Financial, Arrow Financial, First of Long Island, and Community Bank System.
Four stocks also had momentum scores of 8: Westamerica Bancorp, UMB Financial, Enterprise Bancorp, and Bank OZK.
The remaining 7 stocks had momentum scores of 9.
Score Rankings
In the table below, you will see the 16 stocks sorted in terms of total overall scores. I used pretty much the same system I used in my prior articles with the few adjustments mentioned before. For example, the stock with the highest revenue growth will have a score of 16, while the stock with the lowest revenue growth will have a score of 1. These ranking scores are divided by two for both the Dividend Growth and Price to Book Value metrics. In addition, the two new metrics (Fundamental Score and Momentum Score) will not be scored based on ranking, instead, the actual scores will be added to each stock’s overall score to determine the rankings.
| Revenue Growth 3 year | Ranking | Earnings Growth 3 year | Ranking | Return on Assets | Ranking | Return on Equity | Ranking | Return on Invested Capital | Ranking | Dividend Yield | Ranking | Dividend Growth | Ranking | Forward PE ratio | Ranking | Price to Book Value | Ranking | Funamental Score | Momentum Score | Total Score | |
| Bank OZK | 15.29% | 10 | 30.51% | 13 | 2.08% | 16.0 | 12.38% | 10.0 | 9.49% | 5 | 3.14% | 11 | 73.68% | 7.5 | 9.45 | 15 | 1.11 | 7.75 | 9 | 8 | 112 |
| UMB Financial Corporation | 25.19% | 15 | 72.40% | 16 | 1.07% | 3.5 | 14.13% | 14.0 | 12.94% | 14 | 1.69% | 3 | 34.55% | 4.5 | 10.23 | 12 | 1.60 | 4.00 | 9 | 8 | 103 |
| Southside Bancshares, Inc. | 14.02% | 8 | 51.58% | 15 | 1.49% | 14.5 | 12.90% | 11.0 | 7.74% | 3 | 3.77% | 15 | 13.33% | 2.0 | 10.64 | 10 | 1.57 | 4.50 | 8 | 9 | 100 |
| BancFirst Corporation | 24.18% | 14 | 28.81% | 12 | 1.49% | 14.5 | 14.84% | 15.0 | 13.99% | 15 | 1.47% | 1 | 90.48% | 8.0 | 19.31 | 2 | 2.77 | 1.50 | 7 | 10 | 100 |
| Arrow Financial Corporation | 23.40% | 13 | 25.98% | 11 | 1.19% | 7.0 | 13.30% | 12.0 | 11.48% | 12 | 3.37% | 12 | 21.55% | 3.0 | 10.7 | 9 | 1.43 | 5.00 | 8 | 7 | 99 |
| Community Trust Bancorp, Inc. | 14.98% | 9 | 21.76% | 9 | 1.45% | 12.0 | 11.99% | 6.5 | 11.20% | 11 | 3.62% | 13 | 33.33% | 4.0 | 10.26 | 11 | 1.34 | 5.50 | 8 | 9 | 98 |
| 1st Source Corporation | 5.81% | 2 | 31.56% | 14 | 1.46% | 13.0 | 13.39% | 13.0 | 10.75% | 10 | 2.24% | 5 | 60% | 7.0 | 11.87 | 8 | 1.67 | 3.50 | 9 | 9 | 94 |
| First Financial Corporation | 15.82% | 11 | 25.79% | 10 | 1.21% | 8.5 | 10.90% | 3.0 | 10.67% | 9 | 2.25% | 6 | 8% | 1.5 | 9.95 | 13 | 1.24 | 6.50 | 9 | 9 | 87 |
| The First of Long Island Corporation | 12.24% | 7 | 14.29% | 7 | 1.08% | 5.0 | 11.16% | 5.0 | 6.60% | 2 | 4.45% | 16 | 40% | 5.0 | 9.31 | 16 | 1.11 | 7.75 | 8 | 7 | 86 |
| Enterprise Bancorp, Inc. | 21.18% | 12 | 11.72% | 5 | 0.88% | 2.0 | 12.01% | 8.0 | 10.02% | 8 | 2.68% | 7 | 51.85% | 6.0 | 9.47 | 14 | 1.27 | 6.00 | 9 | 8 | 85 |
| Commerce Bancshares, Inc. | 7.77% | 4 | 19.77% | 8 | 1.37% | 11.0 | 15.84% | 16.0 | 15.73% | 16 | 1.54% | 2 | 50.32% | 5.5 | 17.66 | 4 | 3.49 | 0.50 | 9 | 9 | 85 |
| United Bankshares, Inc. | 34.09% | 16 | 1.18% | 3 | 1.21% | 8.5 | 7.59% | 1.0 | 6.43% | 1 | 3.74% | 14 | 5.88% | 1.0 | 14.93 | 6 | 1.15 | 7.00 | 9 | 9 | 76 |
| Westamerica Bancorporation | 8.53% | 5 | 14.05% | 6 | 1.25% | 10.0 | 11.99% | 6.5 | 11.71% | 13 | 2.91% | 10 | 5.00% | 0.5 | 16.91 | 5 | 2.51 | 2.00 | 7 | 8 | 73 |
| Tompkins Financial Corporation | 7.29% | 3 | 8.72% | 4 | 1.07% | 3.5 | 12.30% | 9.0 | 9.87% | 6 | 2.90% | 9 | 21.28% | 2.5 | 13.14 | 7 | 1.83 | 3.00 | 8 | 7 | 62 |
| Community Bank System, Inc. | 9.26% | 6 | -0.31% | 2 | 1.14% | 6.0 | 9.02% | 2.0 | 8.92% | 4 | 2.84% | 8 | 29.41% | 3.5 | 18.48 | 3 | 1.97 | 2.50 | 9 | 7 | 53 |
| Cullen/Frost Bankers, Inc. | 4.22% | 1 | -5.09% | 1 | 0.86% | 1.0 | 10.91% | 4.0 | 9.96% | 7 | 2.20% | 4 | 52.63% | 6.5 | 21.86 | 1 | 2.85 | 1.00 | 9 | 9 | 45 |
Conclusion
The top 4 stocks
Looking at the table above, you can see that the four stocks with the highest overall scores include:
- Bank OZK – Total Score of 112
- UMB Financial – Total Score of 103
- Southside Bancshares, Inc. – Total Score of 100
- BancFirst Corp – Total Score of 100
I feel that each of these four stocks are great long-term buy options for investors but selecting which one or which ones to pick will depend on the specific investor’s goals. Value investors may want to avoid BancFirst. While it has the highest Momentum Score of the 16 stocks reviewed it is also one of the most expensive stocks based on PE ratio and Price to Book Value. Income investors may want to focus on Bank OZK and Southside Bancshares as these are the two stocks out of the top four that have dividend yields over 3%. And growth investors may want to consider UMB Financial. While it does have a lower dividend yield (under 2%), it does have the highest earnings growth and second-highest revenue growth over the past three years out of the 16 reviewed stocks.
The bottom 4 stocks
The score range from the top stocks to the bottom is fairly drastic. The four lowest score stocks include:
- Westamerica Bancorp – Total Score of 73
- Tompkins Financial – Total Score of 62
- Community Bank System – Total Score of 53
- Cullen/Frost Bankers – Total Score of 45
Out of the bottom 4 stocks, I would definitely avoid Community Bank System and Cullen/Frost Bankers. I don’t see anything in these two stocks that would give an investor a reason to choose these stocks over the other and it just so happens that these were the only 2 stocks out of the 16 that have had negative earnings growth over the past three years.
Tompkins Financial was one of my higher-ranked stocks in the original article I published five years ago but was the worst-performing stock during that time with just over a 4% return over five years. I can’t recommend buying Tompkins Financial this time around but I think it is still a stock that can be held in a diversified long-term portfolio. While its growth has not been strong it has been consistently positive. Its dividend yield is close to 3% and it’s right in the middle of the pack in terms of valuation.
Westamerica Bancorp was one of the worst-ranked stocks in my original article but has performed decently over the past five years. Its Momentum Score of 8 shows that this trend can continue. It is another stock I would consider as a hold.
The Remaining Eight
The remaining eight stocks I believe are suitable long-term investment options as well depending on what the individual investor is looking for. Income investors might want to look at First of Long Island with its dividend yield of nearly 4.5%, while dividend growth investors might want to take a look at 1st Source which has grown its dividend by over 60% over the past five years. For investors looking at balance sheets, Commerce Bancshares might be a good bet, considering its impressive returns on assets, equity, and invested capital.
I look forward to comparing the results of this article in another five years and as always, I suggest individual investors perform their own research before making any investment decisions.
Editor’s Note: This article discusses one or more securities that do not trade on a major U.S. exchange. Please be aware of the risks associated with these stocks.
Be the first to comment