

cemagraphics
When we see divergences building, more times than not, it’s the warning sign of a trend change. We are seeing this now across bellwether stocks, varying sectors, and global markets. Many risk assets as well as global markets did not follow the S&P 500 (SPY) to new lows last week. Instead, they are signaling that a new push higher is likely to follow.
Divergences are important to track. There is always a leading market that can provide advanced warning that a top or bottom is ahead. For example, from the COVID low in 2020 through February of 2021, all major global indexes were moving up together. When you see an all-encompassing trend, it tends to be a powerful one, much like we saw into early 2021.
China then topped in late February and began making a series of lower highs, while the rest of the global market continued higher. One after the other – Australia, Japan, Germany, etc. – they all topped throughout 2021, while the U.S. markets continued higher. This was a warning sign that the first deep correction in the S&P 500 was imminent since the COVID lows.
I/O Fund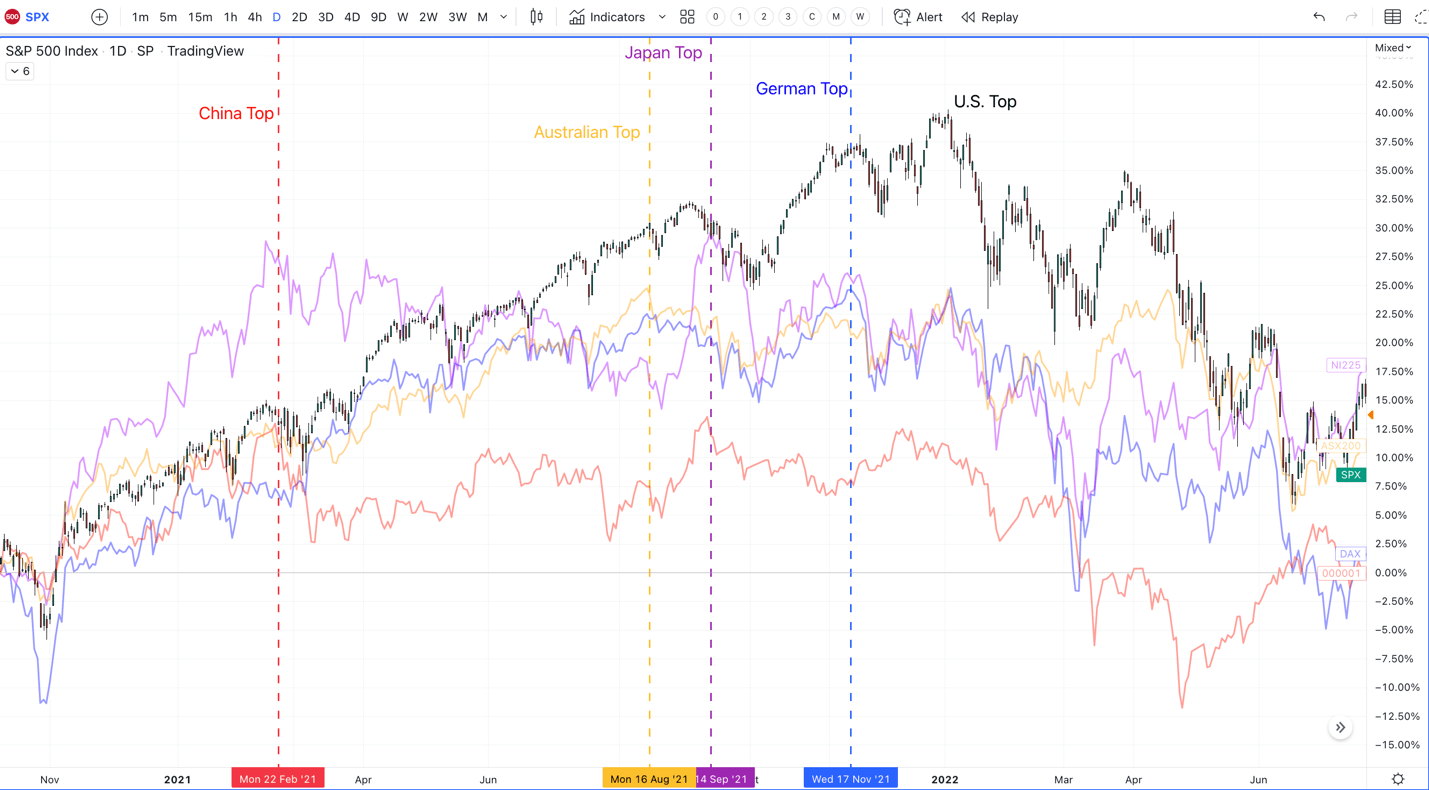
Today, we are seeing the same pattern play out, yet in reverse. Japanese markets bottomed in March, followed by China, Australia and now Germany.
I/O Fund
Furthermore, we are seeing multiple key sectors within the U.S. not follow the S&P 500 down to a new low last week. Transportation stocks, High Beta and Small Caps have been leading the markets since 2021, and last week, when the S&P 500 made a new low, these risk-on markets made a new high.
I/O Fund 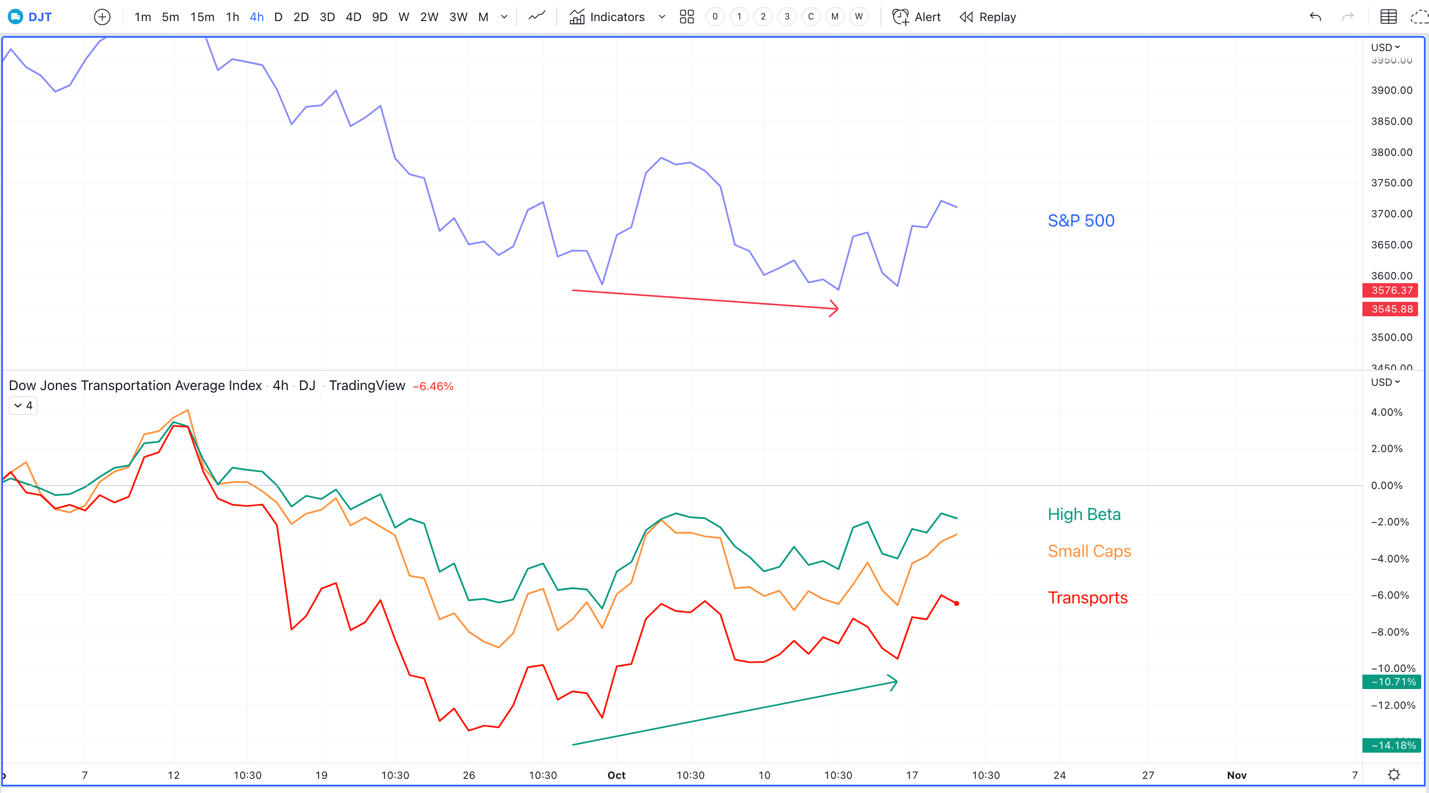
These types of patterns tend to signal a trend change is brewing. Nothing is guaranteed, but even if the market does drop to a new low, we will only see these divergences grow, setting up for a sharp rally into year-end. I do believe many stocks and some markets have bottomed, and those are the ones that tend to lead going into the next uptrend.
Recently, along with divergence patterns, we are seeing rare extremes in sentiment. For example, the AAII investor sentiment survey is a reasonable gauge on what retail is expecting 6 months out in the market. Last week we saw a reading of 60.87% of those surveyed had a bearish outlook on the markets over the next 6 months. For reference, the last time we saw a sentiment reading this low was nearly 2 weeks before the March low in 2009. It’s also one of the highest readings in bearish sentiment in the survey’s history.
I/O Fund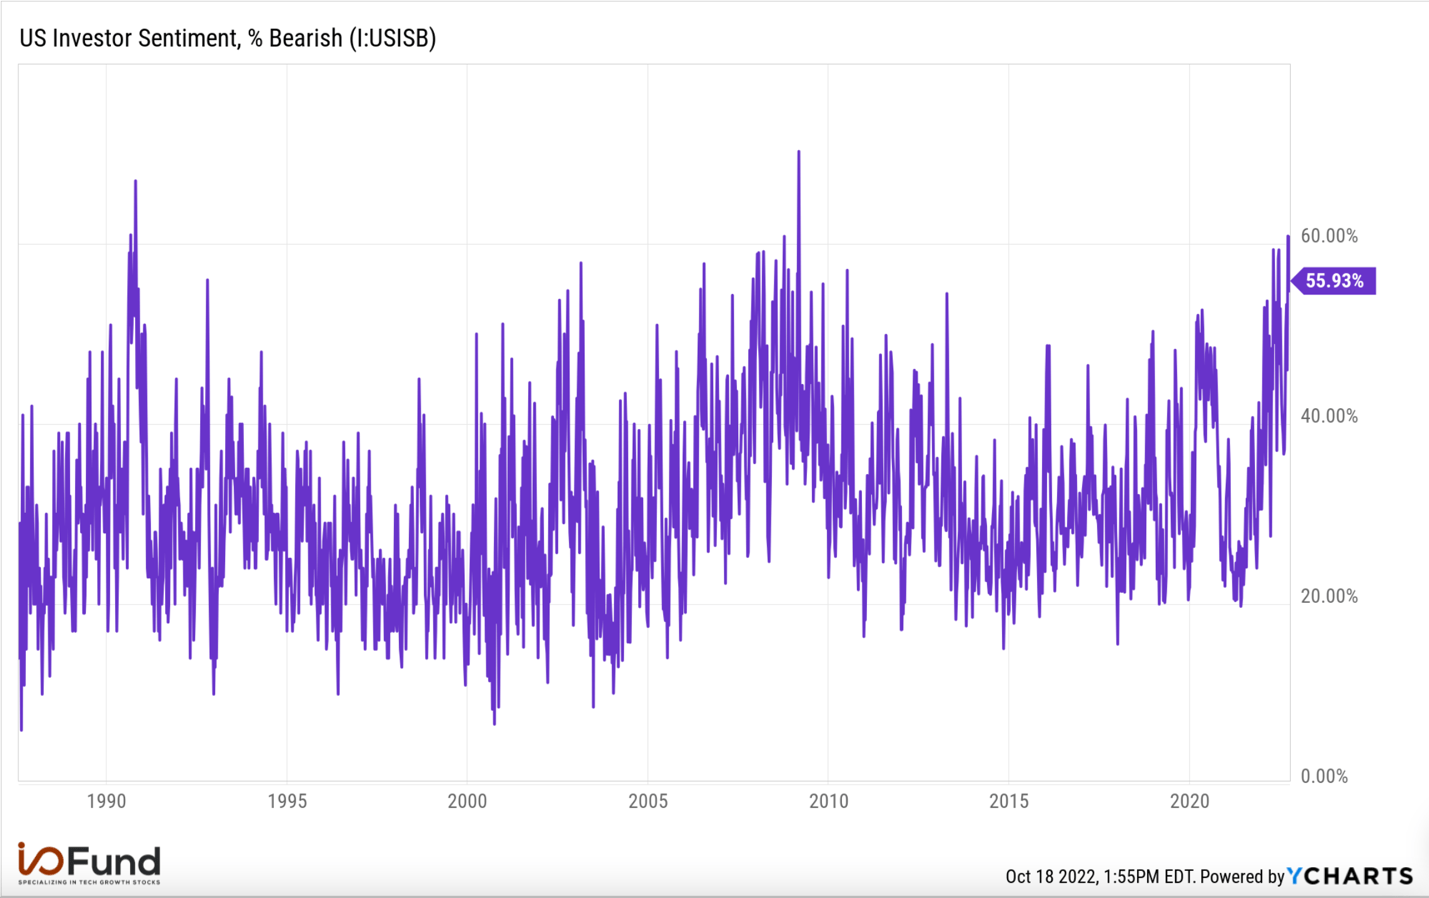
Even more important, this extreme sentiment was backed up by real dollars last week. According to Jason Goepfert of Sentiment Trader for the first time in history, retail traders bought over 3 times the amount of puts than calls last week.
It’s not only retail that is scrambling to buy insurance for another low. Fund managers have taken their cash position to the highest in 21 years, exceeding all of 2008, 2009 and 2001.
I/O Fund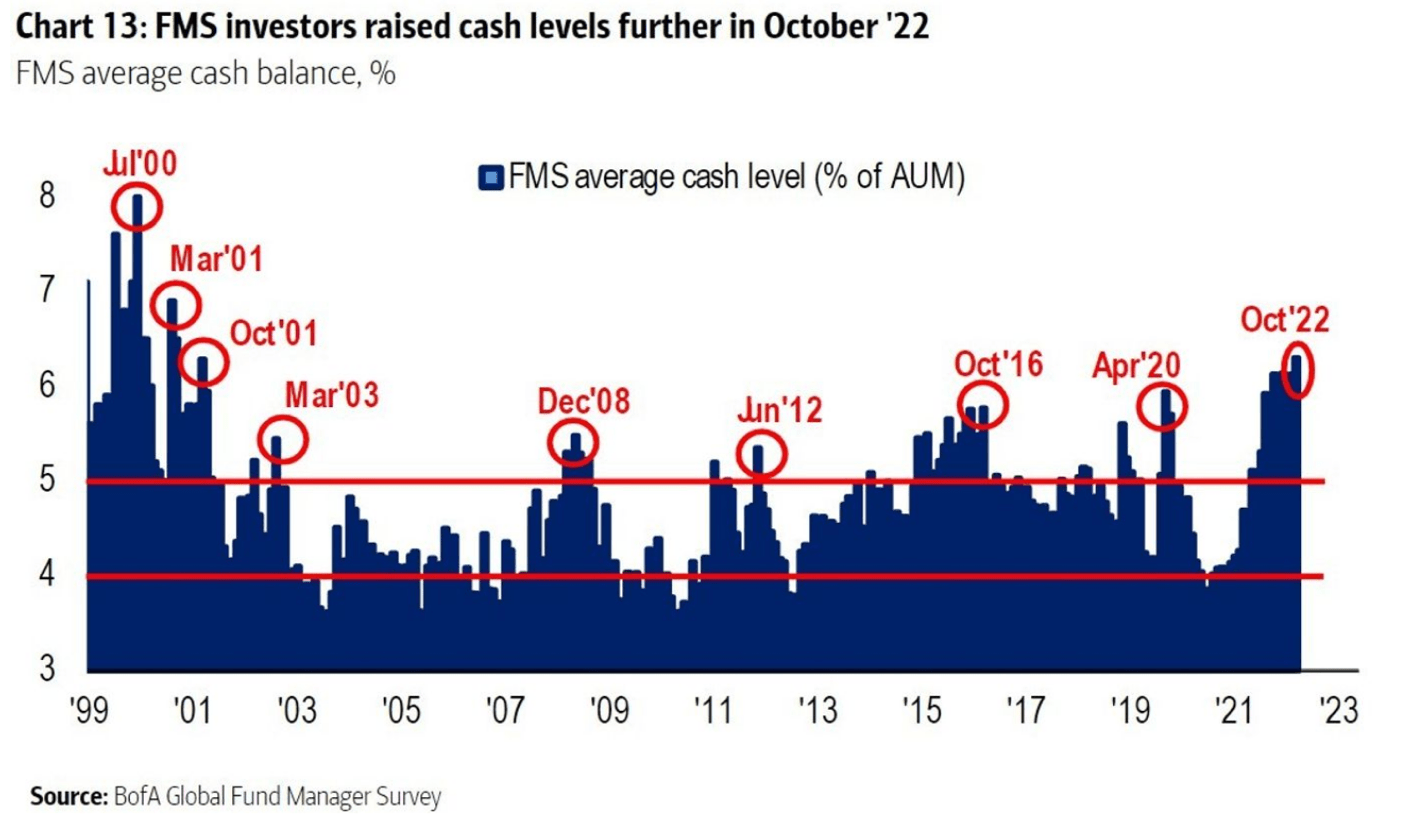
Markets top with exuberance and bottom in despair. No one really knows if this is a bottom, but what is certain is that the level of despair and bearish bets have exceeded levels that have marked prior lows.
Where Will the Market Go Next
Two weeks ago, we provided succinct risk levels and also provided our expectation that the market looks like it wants to make at least one more low:
“If the coming bounce can break above 3800, then a major low is likely developing. However, once SPX pushes into 3730, the risk will be elevated, as the above structure does not look complete until we get at least into the 3550 range.”
Today, we have met our target, as the market appears to have exhausted to the downside. The below chart is quite busy, so I will take it one point at a time, but we now have a new range as well as evidence that a new uptrend is developing.
I/O Fund
First off, we have been stuck in a downtrend channel since the August high. There have been multiple attempts to break out of this channel, all have failed and led to new lows. Note how we have broken out of the downtrend channel. I circled this move, and it’s also worth noting that we gapped over the channel on heavy volume and are holding it, so far. More times than not, when we see the channel broken, it’s signaling a trend reversal is in process.
Secondly, note the key reversal bar on the day of the low. This is called a bullish engulfing candlestick. It is when a candle stick covers the entire high and low from the day before. What determines if this pattern is strong is how many days does it cover and is it on heavy volume? October 13th covered 3 days prior and was on exceptional volume, which makes this a strong reversal pattern.
That being said, the price range that will determine a meaningful low being in is SPX 3830 – 3640. Whatever level breaks first will determine the counts above. If we do breakdown from here, the below SPX levels I’m targeting are 3345, 3280. Even if this does happen, the divergences and sentiment are so strong that it will only set up another buying opportunity.
On the other hand, our base case is that we do breakout above the 3765-3830 region. If this does happen, we expect a multi-month rally to take us into year-end.
In conclusion, we are seeing the types of extreme sentiment readings as well as divergences that mark a reversal. We are also seeing the market shrug off horrible inflation data. Since the PPI and CPI numbers came in hotter than expected, the market is up 6.5%. The last time we saw these patterns was in mid-June, just before the market moved up 18% in less than 2 months. Will this market THE low or will it just another bear market rally? Follow me for updates.
On Thursday, October 20th at 2:30 pm Eastern, we will be providing our weekly market webinar where we will discuss recent earnings reports, as well as analyzing specific stock charts. Our goal is to provide context, as well as identify actionable exits and entries for investors. We have used this information to successfully hedge our portfolio multiple times in 2022, as well as build positions at key levels.
Be the first to comment