

hapabapa
Q2 recap and thesis
At this point, investors have had plenty of time to digest the Q2 results for both Walt Disney (NYSE:DIS) and Netflix (NASDAQ:NFLX). Note that for DIS, the recent earnings report (“ER”) was for its FY Q3. To briefly recap, NFLX reported a stronger-than-expected quarter. In particular, its subscriber loss was less severe than it previously anticipated. It lost “only” 970k net subscribers after warning it would lose about 2M earlier. Such relative outperformance gave the market a huge relief and its share prices soared by more than 8% after the ER.
The performance for DIS is more upbeat in the absolute sense. Its Q2 revenue rose by 26% YoY and the revenues from its Experiences and Products segment soared as much as 70% YoY as the pandemic impacts keep fading and its parks keep resuming normal operation.
More crucially, its total subscriptions also surpassed Netflix for the time in Q2 2022. It reported a total subscriber of 221.1 million during its Q2 2022 ER and passed Netflix’s 220.67 million (according to its most recent report).
This brings me to the central thesis of this article. Even though the market showed a bifurcated response as if DIS has won and NFLX has lost, I see the bifurcation only as the mark for the beginning of the real war between these two media giants. Going forward, I anticipate seeing that they further converge and compete in many more common areas (streaming, ad, TV, et al.). The war is far from over, and it remains to be seen if DIS’s more diversified model can indeed create a long-term strategic advantage.
Market sentiment bifurcation
You can see the market sentiment clearly from the price actions below. Both stocks have been under pressure since the beginning of the year, together with the overall market. However, the market is obviously much more concerned about NFLX than DIS. NFLX has lost as much as ~70% since the beginning of the year after its Q1 ER (which will require a rally of more than 230% to break even). Even after the strong rallies since its Q2 ER, NFLX is suffering a loss of more than 58% (which will take about a rally of 138% to break even). In contrast, DIS has “only” lost about 21% YTD, compared to the overall market’s loss of 9.4%.
Such bifurcations in their share prices are for good reasons, as we will see next.
Seeking Alpha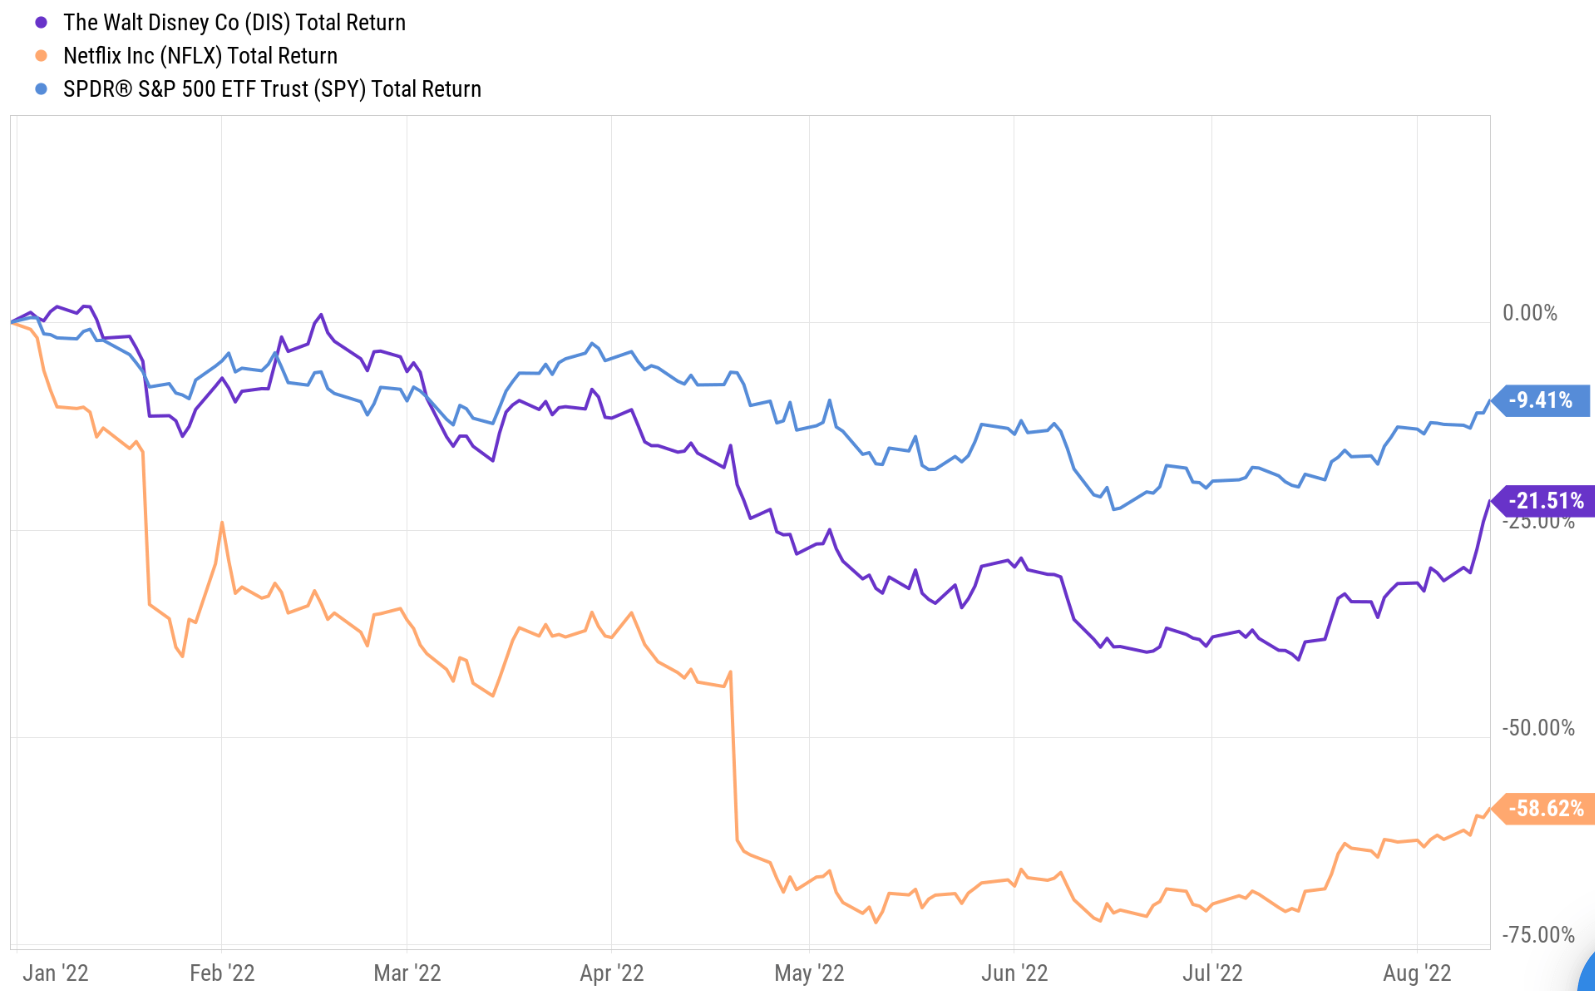
Fundamental bifurcation
What lies behind the bifurcated price actions is bifurcated fundamentals. As shown in the table below, DIS reported strong growth both in the past quarter and also in the past nine months. DIS enjoys a fundamental advantage of operating two complementary and mutually enhancing segments: its Media segment and its Parks. The media segment creates the content people (especially kids) love, which in turn generates waves to push customers to its parks. The pandemic, of course, severely disrupted its park operation. But I see that only as a temporary speed bump. In the long term, I see the mutual enhancement between these two segments to continue.
All told, over the past 9 months, its total revenue increased by 30% compared to the same period last year. And note that the parks segment soared by more than 90%. Its total income improved by 70% also. And again, its parks turned from a $169M loss in 2021 to a $6.3B profit in 2022.
DIS Q2 ER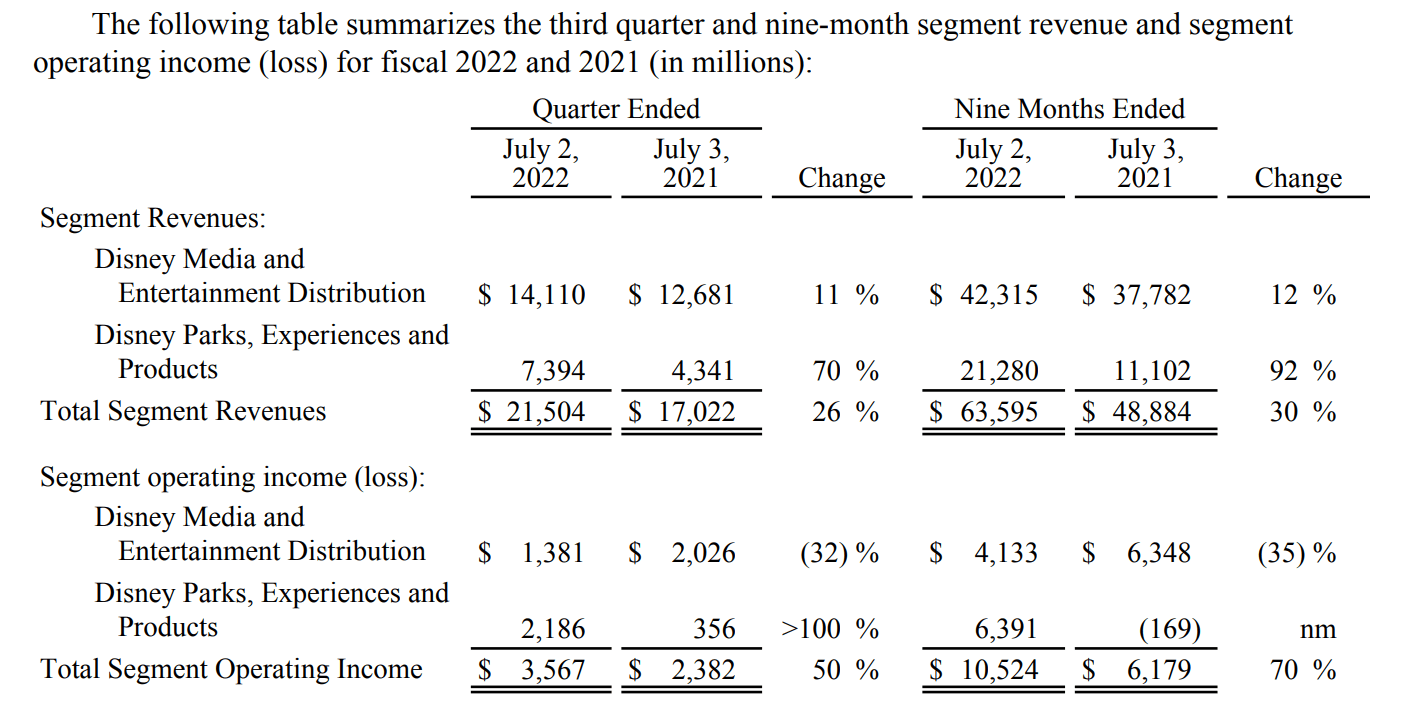
The picture for NFLX is less rosy. As aforementioned, to me, the essence of its Q2 ER is “better than expected”. As you can see from the summary results (taken from its Q2 shareholder letter), the top line grew moderately (8.6% YoY). To be fair, the foreign exchange created a 4% headwind, so the revenue growth would be 13% on a constant currency basis. But then, DIS revenue growth would higher too on a constant currency basis. The bottom-line numbers are even more concerning. Operating income came in at $1.58B, a 15% decline from Q2 2021’s $1.84B and a 20% sequential decline from its Q1 2022’s $1.97B. Operating margin contracted to 19.8% from 25.2% a year ago and 25.1% a quarter ago. And of course, as aforementioned, on top of these issues, the business is losing subscribers at a concerning rate as it commented in its shareholder letter:
Our challenge and opportunity are to accelerate our revenue and membership growth by continuing to improve our product, content, and marketing as we’ve done for the last 25 years, and to better monetize our big audience.
NFLX Q2 shareholder letter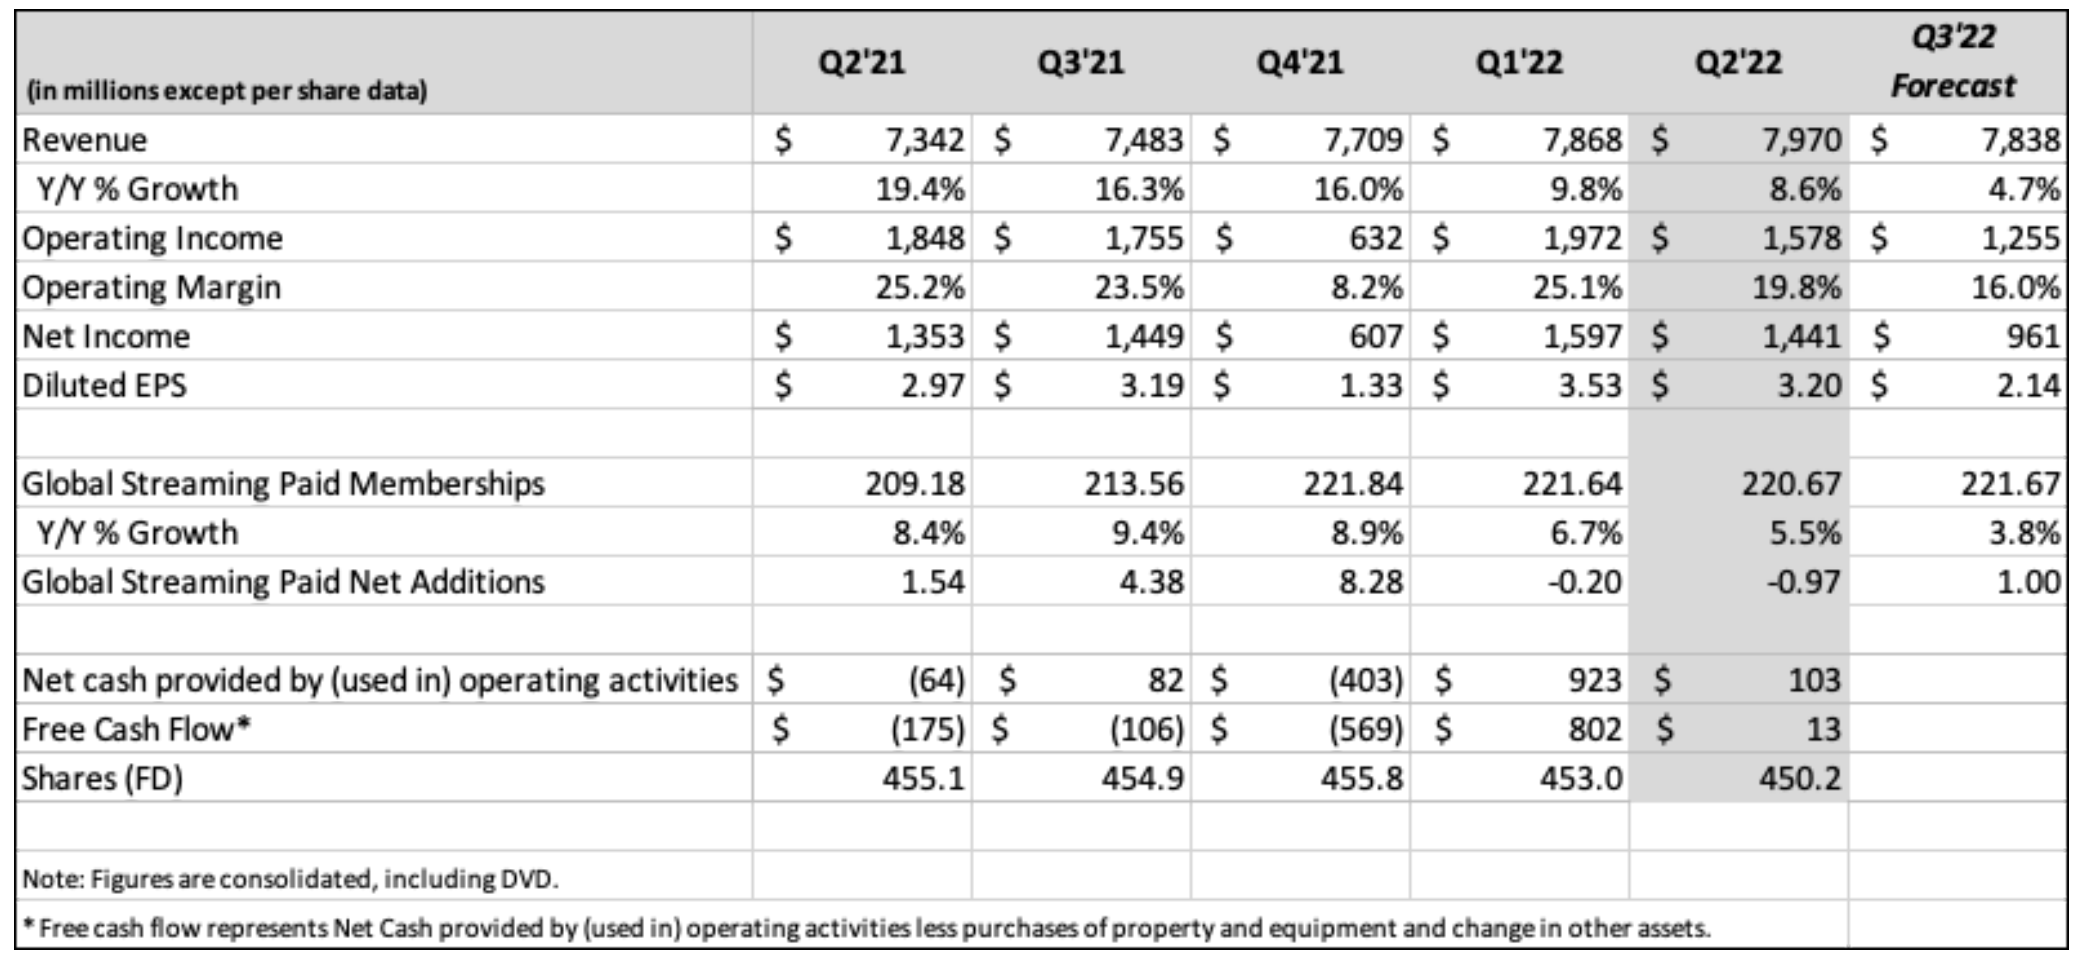
Valuation bifurcation
Due to the above bifurcation in their fundamentals, the market’s response to their valuations has already bifurcated. As you can recall, not that long ago, NFLX has been trading in the triple-digit P/E while DIS’s average P/E over the past few years has been only around 18x. Even at the beginning of 2022, NFLX was trading nearly at 60x P/E. Now, as you can see from the following chart, the picture is reversed. DIS is trading at a P/E of 31.5x, about a 30% premium above NFLX’s 24.3x.
Seeking Alpha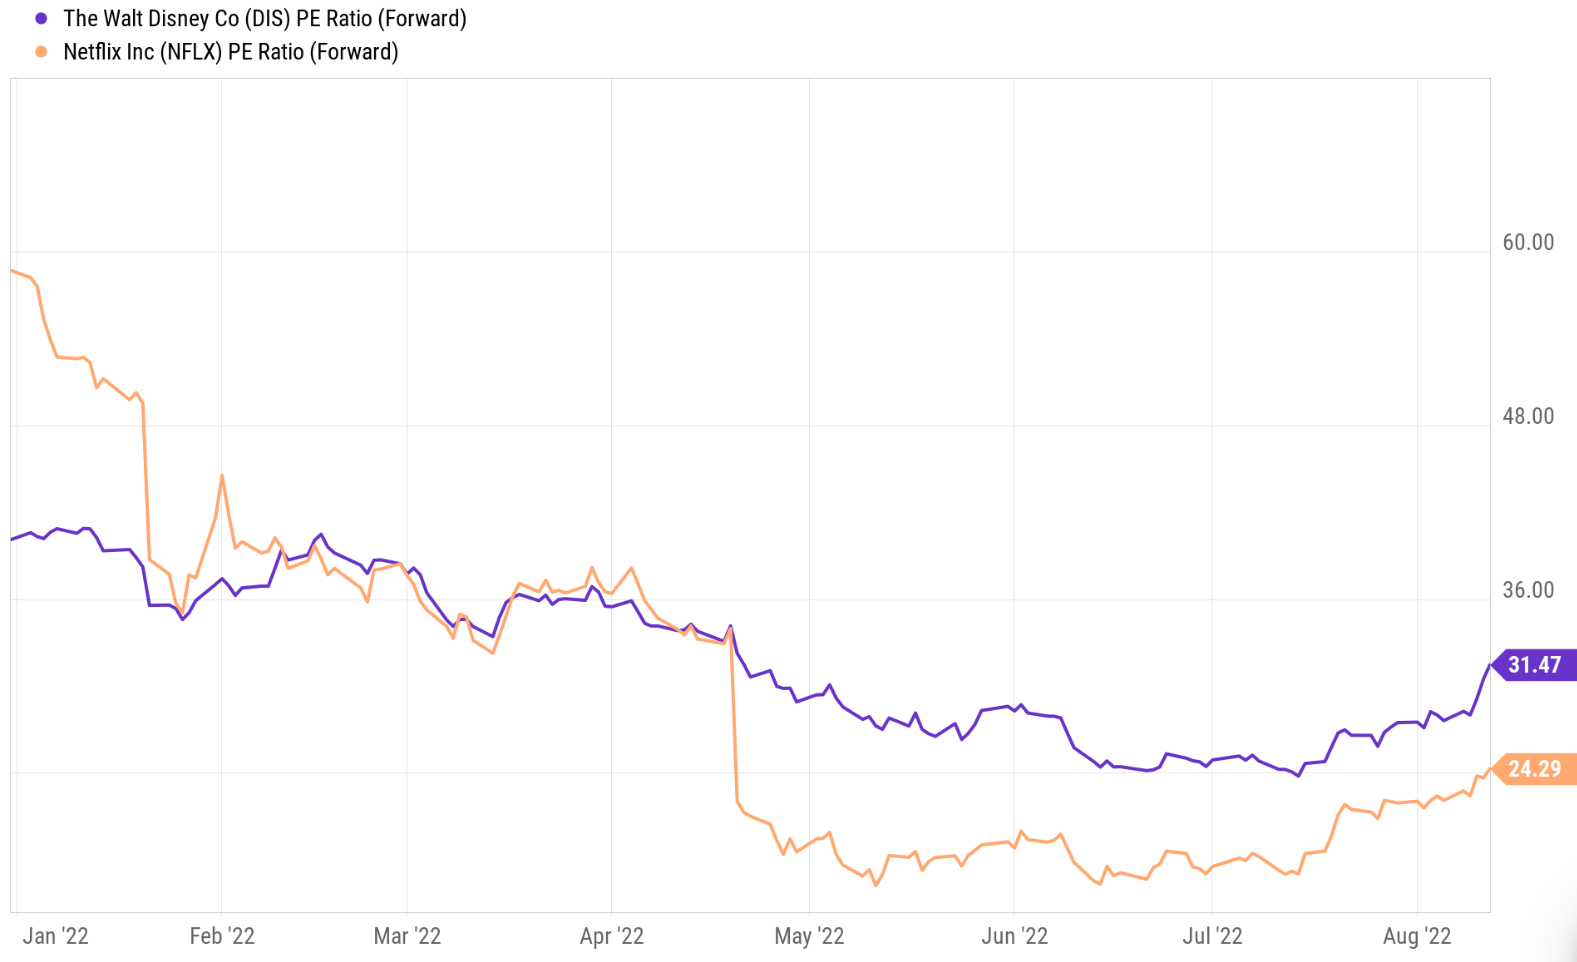
The real war has just begun
However, to me, all of these bifurcations do not mean that DIS has won and NFLX lost. To me, they only serve as the mark for the beginning of the real war between these two media giants. Now, NFLX finally has an opponent in the streaming space with an equal number of subscribers. And going forward, I anticipate seeing more intense competition on many more fronts.
For example, both have announced plans to experiment with an ad plan. DIS has announced a plan to launch two models. The model with advertising (Disney+ Basic) will charge $7.99/month, while the ad-free plan (Disney+ Premium) will charge $10.99/month, a 38% price increase. NFLX has the same plan essentially, the lower-priced model will include advertising-supported offerings, and the existing plan will remain ad-free. NFLX’s global ARM has grown at a 5% CAGR from 2013 to 2021, supporting the decision to give consumers a choice of a lower-priced option with advertisements.
In the TV space, NFLX enjoys a lead. In the US, the most competitive TV market in the world, NFLX attracts the most TV viewing time during the 2021-22 TV season (see chart below provided by Nielsen). NFLX reported a total of 1,334 billion minutes of viewing time, leading the second and third places (CBS and NBC, respectively) by a wide margin.
To further leverage its TV advantage, in February, Netflix started testing its Fast Laughs feature on TV. Previously, the Fast Laughs feature was only available to some iPhone users. And the feature is now here for an expanded audience. This feature provides Netflix users with funny short video content to compete with similar features from TikTok and YouTube (more on this in the risk section later).
Nielsen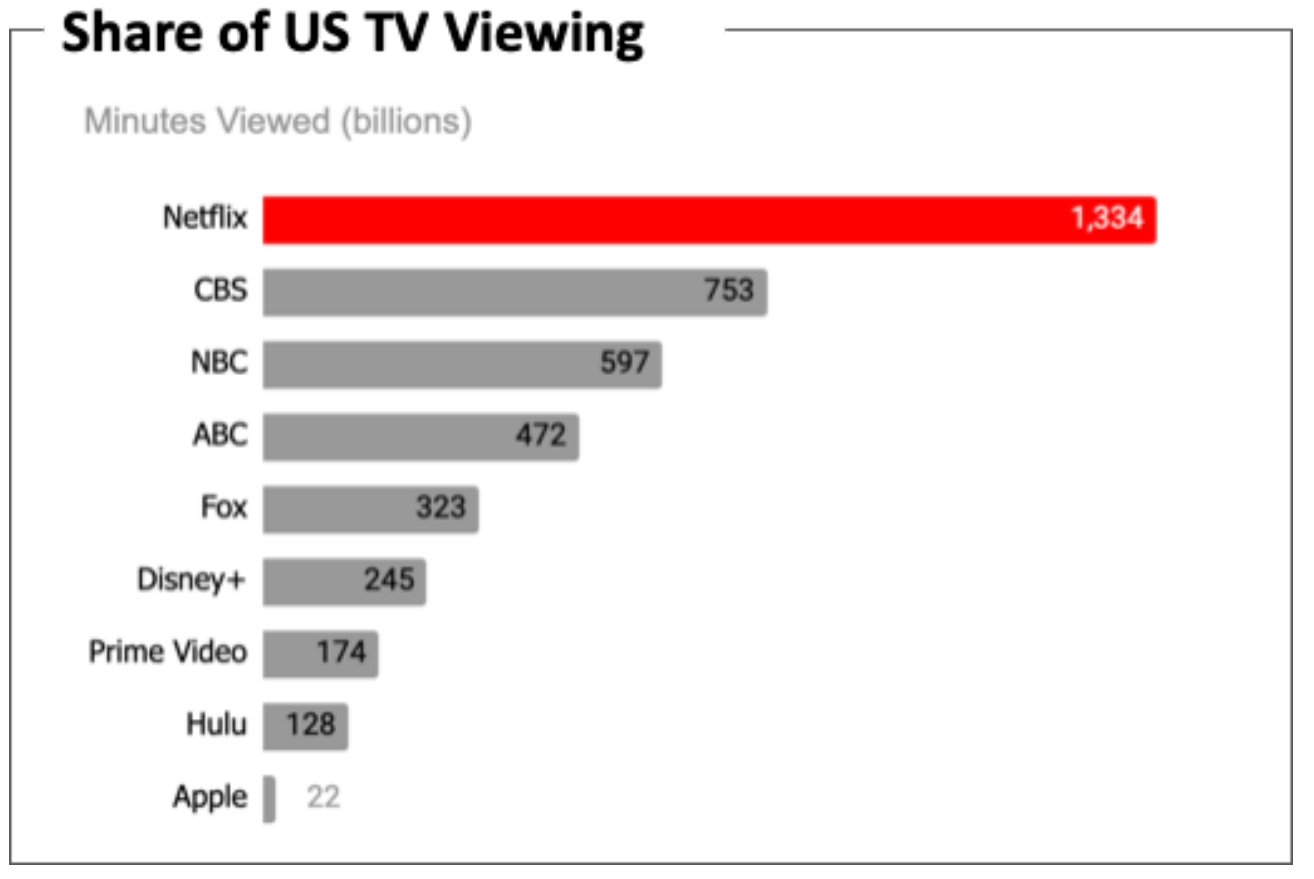
Lastly, as a pure streaming player, NFLX also enjoys better operating efficiency. In the next chart, you can see that NFLX’s current asset turnover rate (0.75x), or asset utilization rate, is almost 1.8x higher than DIS’s (0.40x). Also, the NFLX historical average of 0.78x is substantially higher than DIS, even before DIS’s parks were disrupted by the pandemic (which sent the asset turnover rates to a bottom of 0.28x). You can also see that DIS is yet to fully recover from the pandemic as the parks and movies theater have not returned to their pre-pandemic levels.
Seeking Alpha
Final thoughts and other risks
To summarize, the market responses toward DIS and NFLX have been quite bifurcated in several important ways as if DIS has won the war and NFLX has lost. But I see the bifurcation only serving as the mark for the beginning of the real war between these two media giants. I see NFLX now finally has an opponent with equal subscribers. Going forward, I anticipate competition to further intensify on multiple fronts (streaming, ad, TV, et al.), and I see each have its advantages and weakness.
Finally, risks. The risks because of the competition between NFLX and DIS have been detailed by other SA articles already. Here I will just focus on risks external to both. As with many other industries, their real trouble often lies outside of their internal competition. And to me, other media platforms such as TikTok and YouTube represent larger risks than their internal competition. According to data from Data.ai, TikTok’s average monthly usage time per household reached 23.6 hours in Q2 2022, and YouTube reached 23.2 hours. These numbers translate into about an average of almost 50 minutes a day on each of the platforms (or 100 minutes combined). That’s the length equivalent to 2~3 episodes of TV shows or a full movie. In the end, our attention will be the ultimate limited resource – no technology can give us more “attention” capacity and enlarge the pie. If TikTok or YouTube grabs more of our attention, that must come from somewhere else.
Be the first to comment