

Sundry Photography
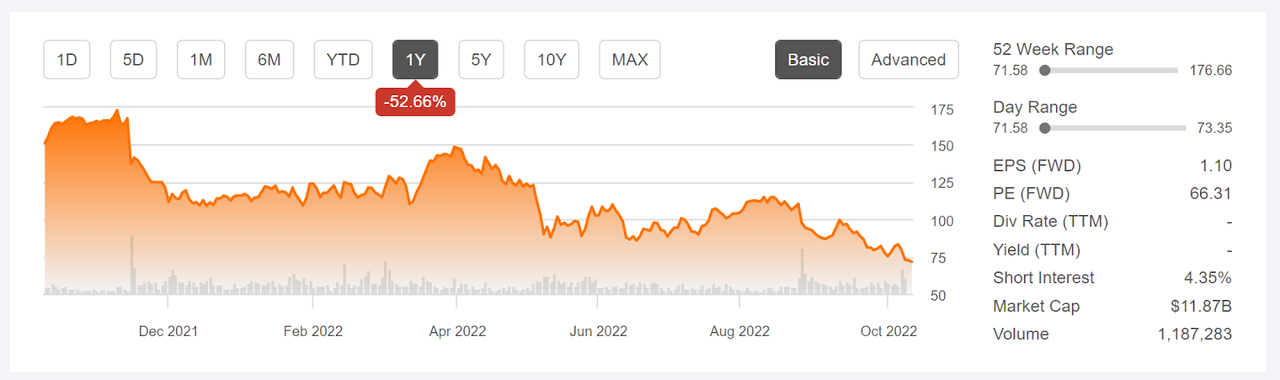
Since closing at $110.36 on April 24, 2022, Splunk (NASDAQ:SPLK) has fallen 34% over a period of six weeks. The shares have been in a persistent decline over the past year, but the recent drop is especially rapid. SPLK fell by more than 8% on Friday, Oct. 7, apparently triggered by UBS downgrading the stock from buy to neutral. There have been a number of downgrades since late August, when the company reported slower-than-expected growth in annual recurring revenue.
Seeking Alpha
12-Month price history and basic statistics for SPLK (Source: Seeking Alpha)
Splunk has been in turmoil for quite some time, with the CTO leaving the company in April of 2021 and the CEO replaced in November of 2021. Most recently, the CFO has announced that he is resigning in early November.
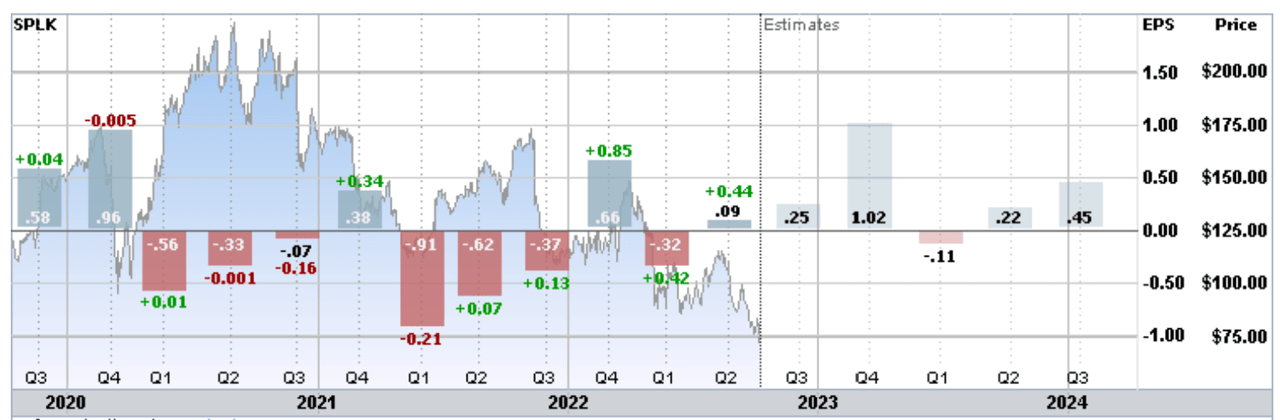
SPLK’s quarterly earnings have been extremely volatile in the past three years. There’s no evidence of consistent, sustainable growth. Revenues have been in a downward trend over the past three to five years, although the YoY revenue growth is improving.
ETrade
Historical (3 years) and estimated future quarterly EPS for SPLK. Green (red) values are the amounts by which EPS beat (missed) the consensus expected value (Source: ETrade)
The value of a stock represents the discounted value of expected future earnings. The value of stocks like SPLK that have little or no current earnings are highly sensitive to interest rates because the compounding effect of rising rates has an amplified impact on earnings that are expected to be realized further into the future. While there are a variety of valuation models, rising rates will have a major impact on SPLK’s estimated fair value.
I last wrote about SPLK on April 5, 2022, at which time I maintained a neutral/hold rating on the shares and the shares were trading at $146-$147. At that time, the Wall Street analyst consensus rating on SPLK was a buy. Slowing revenue growth was already evident, however, which was a concern. In analyzing a stock, I put considerable weight on the market-implied outlook, a probabilistic price forecast that represents the consensus view among buyers and sellers of options.
The market-implied outlook for SPLK was bearish, with high volatility. This situation, with a bullish Wall Street consensus outlook and a bearish market-implied outlook, had been the case since at least early 2021. I compromised with maintaining the neutral overall rating on SPLK. Over the six months since my April analysis, SPLK has declined by about 50%.
For readers who are unfamiliar with the market-implied outlook, a brief explanation is needed. The price of an option on a stock is largely determined by the market’s consensus estimate of the probability that the stock price will rise above (call option) or fall below (put option) a specific level (the option strike price) between now and when the option expires. By analyzing the prices of call and put options at a range of strike prices, all with the same expiration date, it’s possible to calculate a probabilistic price forecast that reconciles the options prices. This is the market-implied outlook. For a deeper explanation and background, I recommend this monograph published by the CFA Institute.
I have calculated updated market-implied outlooks for SPLK and I have compared these with the current Wall Street consensus outlook in revisiting my overall rating.
Wall Street Consensus Outlook for SPLK
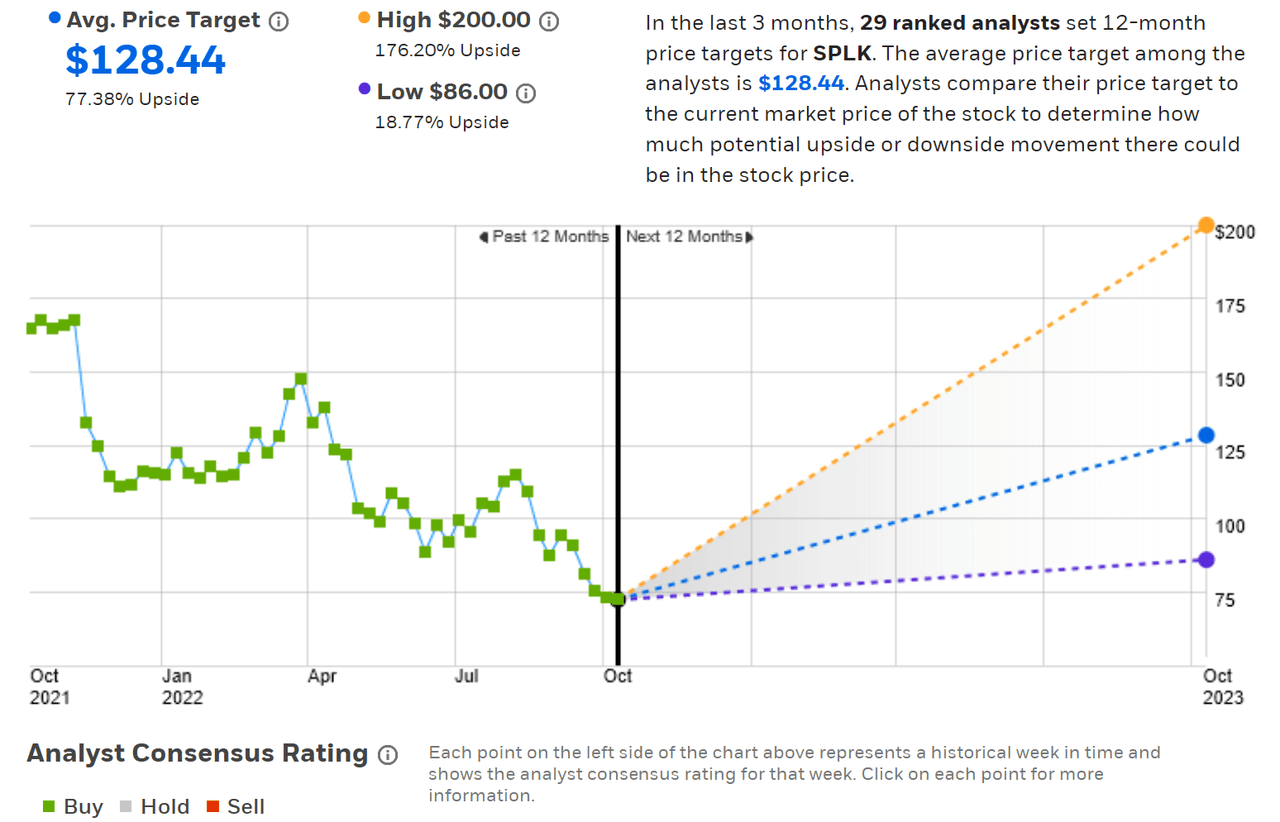
ETrade calculates the Wall Street consensus outlook for SPLK using price targets and ratings from 29 ranked analysts who have published their views within the past three months. The consensus rating is a buy and the consensus 12-month price target is 77.4% above the current share price. It’s important to note that the consensus rating has been bullish for all of the past 12 months, during which the share price has fallen from a high of around $170 down to the current level of $72-$73.
There’s also a high dispersion in the individual analyst price targets, ranging from a high or $200 to a low of $86, reducing confidence in the meaningfulness of the consensus as a predictor. One study found that there’s a negative correlation between the return implied by the consensus price target and subsequent returns for a stock when dispersion is high. As a rule of thumb, I largely discount the consensus price target when the highest price target is more than twice the lowest and SPLK exceeds this threshold.
ETrade
Wall Street analyst consensus rating and 12-month price target for SPLK (Source: ETrade)
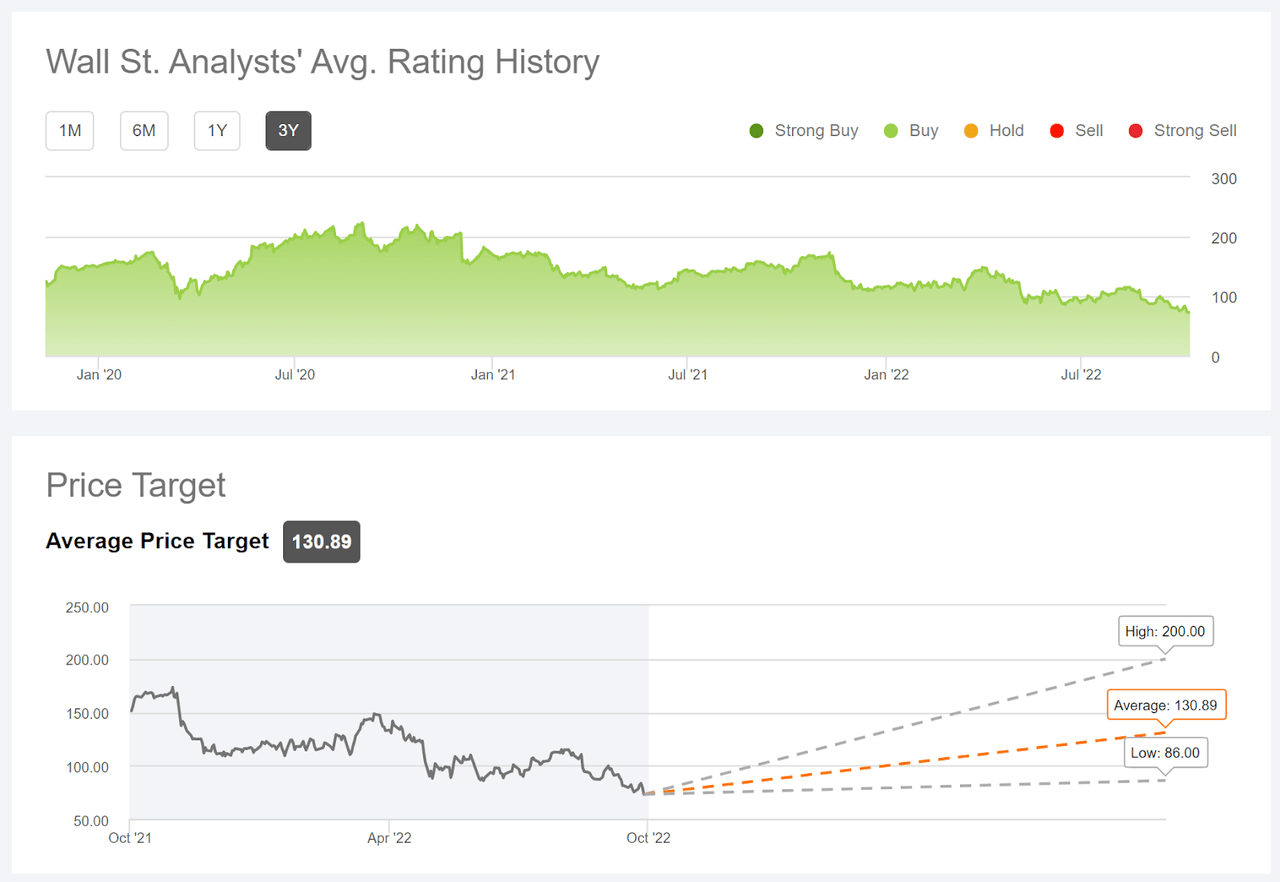
Seeking Alpha’s version of the Wall Street consensus outlook for SPLK is calculated using the views of 38 analysts who have published price targets and ratings over the past 90 days. The consensus rating is a buy and the consensus 12-month price target is 80.7% above the current share price. The chart from Seeking Alpha shows that the consensus rating has been a buy for all of the past three years, a period over which SPLK has returned -15.6% per year.
Seeking Alpha
Wall Street analyst consensus rating and 12-month price target for SPLK (Source: Seeking Alpha)
On the positive side, both Seeking Alpha and ETrade agree that the Wall Street consensus rating for SPLK is a buy and both calculate a consensus 12-month price target that is 79% above the current share price. On the negative side, the Wall Street consensus outlook has been unwavering in its bullish view on SPLK even as the shares have fallen 50% over the past year. In addition, the high dispersion among the individual analyst price targets means that the consensus price target is probably not a useful predictor.
Market-Implied Outlook for SPLK
I have calculated the market-implied outlook for SPLK for the 3.3-month period from now until Jan. 20, 2023, using the prices of call and put options that expire on this date. I would have liked to also calculate a market-implied outlook for SPLK later in 2023 (e.g. using longer-dated options), but the open interest and trading volume for options with later expiration dates drops off too much to make such analysis meaningful at later dates in 2023.
The trading volume and open interest for options that expire in January of 2024 is higher than for any dates in 2023 after January, so I have also calculated the market-implied outlook for the 15.2-month period from now until Jan. 19, 2023, the date that these options expire. The trading volume and open interest for the January 2024 options is much thinner than for the January 2023 options, so the nearer-term outlook is considered more representative of broad opinion.
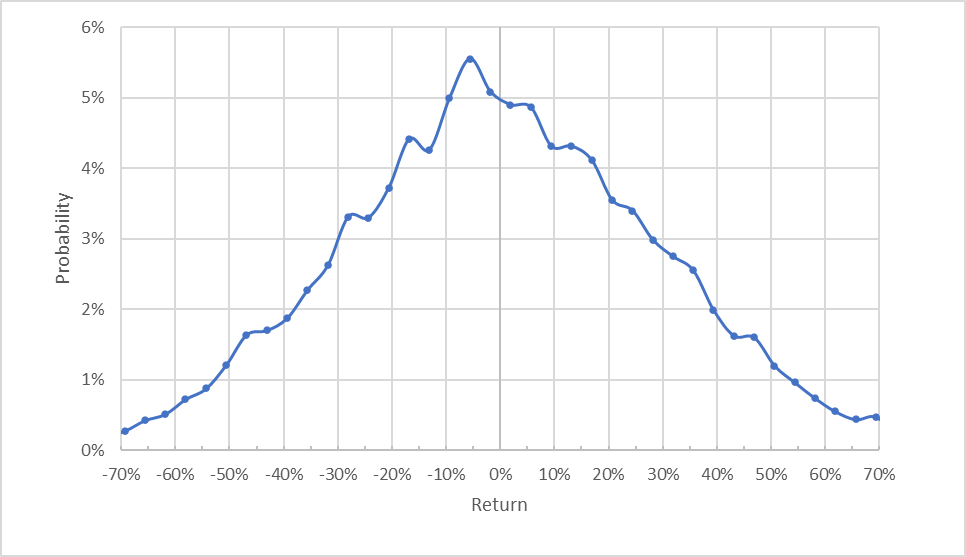
The standard presentation of the market-implied outlook is a probability distribution of price return, with probability on the vertical axis and return on the horizontal.
Geoff Considine
Market-implied price return probabilities for SPLK for the 3.3-month period from now until January 20, 2023 (Source: Author’s calculations using options quotes from ETrade)
The outlook for the next 3.3 months is tilted to favor negative returns. The maximum probability outcome corresponds to a return of -5.6%. The expected volatility calculated from this distribution is 64.9% (annualized). Back at the start of April, the expected volatility was 44% (annualized), so the market’s assessment of future uncertainty for SPLK has gone up substantially. Much, if not all, of this gain in volatility is attributable to the increased volatility in the broader market, with the VIX rising about 50% over this period.
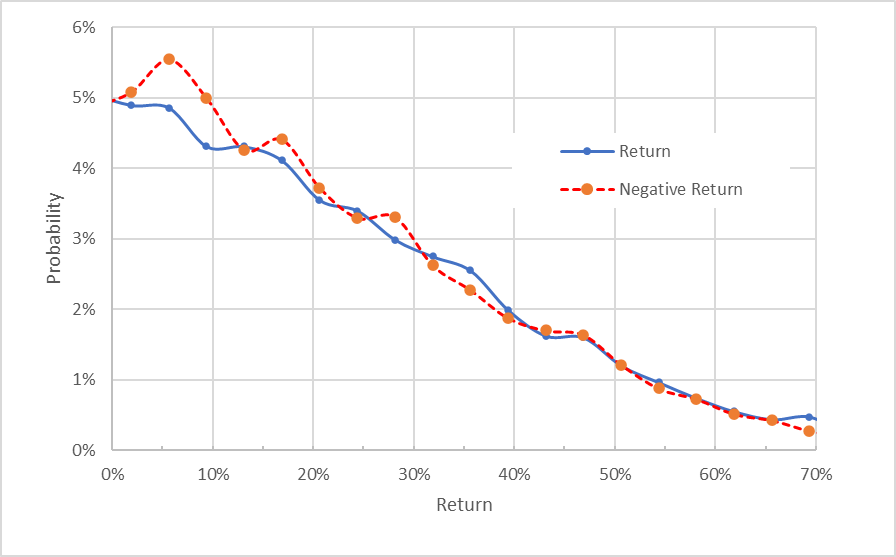
To make it easier to compare the relative probabilities of positive and negative returns, I rotate the negative return side of the distribution about the vertical axis (see chart below).
Geoff Considine
Market-implied price return probabilities for SPLK for the 3.3-month period from now until January 20, 2023. The negative return side of the distribution has been rotated about the vertical axis (Source: Author’s calculations using options quotes from ETrade)
This view shows that the probabilities of negative returns are higher than the probabilities of positive returns of the same size for returns in the range of +/-20% (the dashed red line is consistently at or above the solid blue line over the left 2/7 of the chart above). For larger-magnitude returns, the probabilities are quite evenly matched.
Theory indicates that the market-implied outlook is expected to have a negative bias because investors, in aggregate, are risk averse and thus tend to pay more than fair value for downside protection. There’s no way to measure the magnitude of this bias, or whether it’s even present, however. The expectation of a negative bias in the outlook leads me to conclude that the best interpretation of this market-implied outlook is neutral.
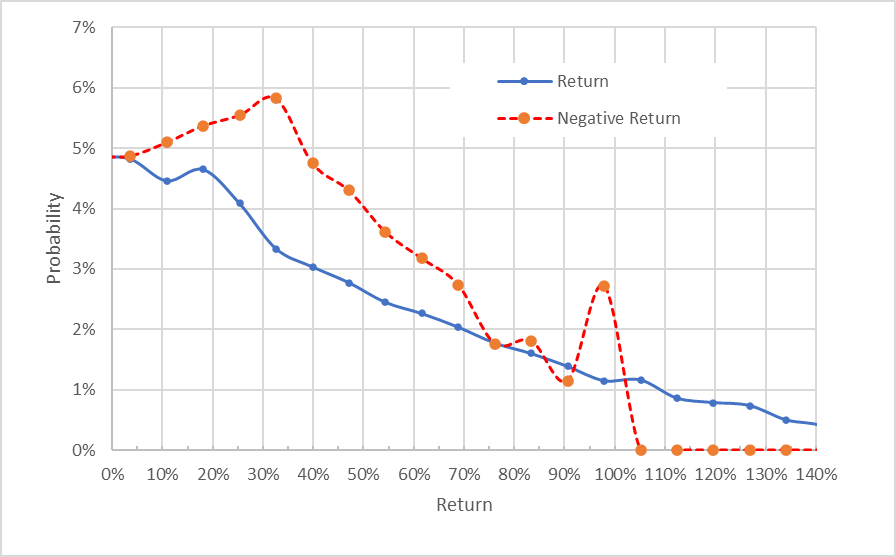
The market-implied outlook for the 15.2-month period from now until Jan. 19, 2024, is considered less meaningful than the shorter-term outlook, as noted previously. This longer outlook is much more bearish, with substantially elevated probabilities of negative returns, as compared to positive returns of the same size. The expected volatility calculated from this distribution is 55.6% (annualized), somewhat lower than for the short-term outlook, but still high. Even considering the possibility of a negative bias, I interpret this market-implied outlook as solidly bearish.
Geoff Considine
Market-implied price return probabilities for SPLK for the 15.2-month period from now until January 19, 2024. The negative return side of the distribution has been rotated about the vertical axis (Source: Author’s calculations using options quotes from ETrade)
The market-implied outlook for the 3.3 months until Jan. 20, 2023, is neutral with high volatility. The market-implied outlook for the 15.2 months until Jan. 19, 2024, is bearish, with high volatility (albeit lower than for the nearer-term outlook). I put more weight on the 3.3-month outlook than on the 15.2-month outlook, as discussed previously.
Summary
Splunk is working through a difficult period in which earnings have been volatile and a number of key executives have departed. The Wall Street analysts’ prevailing view has been overly optimistic in the past year or more, discounting the potential fallout of the company’s travails. By contrast, the options market has been bearish since I first calculated the market-implied outlook for SPLK in March of 2021.
SPLK is down more than 50% over the past 12 months, but the Wall Street consensus rating continues to be bullish and the consensus 12-month price target is 79% above the current share price. That said, the dispersion in the price targets from individual analysts is so high that the consensus is unlikely to be a meaningful guide to future performance. The market-implied outlook for SPLK to January of 2023 is neutral, with expected volatility of 64.9%. This suggests that the recent declines in SPLK (down more than 30% in the past six weeks) have fully priced in the current news. The market-implied outlook to January of 2024, however, is substantially bearish. I am maintaining a neutral / hold rating on SPLK for the time being, but I plan to revisit this early in 2023.
Be the first to comment