

naphtalina/iStock via Getty Images
The SPDR Dow Jones Industrial Average ETF (NYSEARCA:DIA) is once again showing signs of a potential short-term market top. Major market peaks of the past have been characterized by weakness in the Transports even as the Industrials have traded at or near all-time highs, which is the case today. The underperformance of the Dow Transportation Index and the recent rise in the Dow Industrial’s valuations suggest now is a good time to exit long positions or enter shorts.
The DIA ETF
The SPDR Dow Jones Industrial Average ETF seeks to provide investment results that correspond to the performance of the Dow Jones Industrial Average. As a price-weighted index rather than a market capitalization-weighted index, the Dow Jones Industrial Average has a much lower weighting of Tech stocks due to its notable exclusion of Google, Amazon, and Facebook, and its much lower weighting of Apple, which commands less than a 3% share.
With the recent underperformance of tech stocks, the Information Technology sector no longer has the largest weighting in the index, which sits at just 19%, compared to 26% of the S&P500. The Dow’s largest sector is Health Care, which commands a 22% weighting on the index. Financials make up the third largest sector with a weighting of 16%, which is significantly higher than the sector’s 11% weighting in the S&P500. a significant 15% share. The higher weighting of Financials and lower weighting of Tech stocks largely explains the higher dividend yield on the Dow Industrials relative to the S&P 500, although the yield advantage has fallen sharply over the past few months due to the outperformance of the Dow. The current dividend yield on the Dow sits at 2.1%, while the DIA ETF pays a yield of 1.9%.
Dow Theory Divergence Is In Place Once Again
The recent outperformance of the Dow Industrials relative to the Dow Transports is potentially bearish signal, suggesting a short-term market top in the former. While the Industrials hit a marginal new high on November 30, the Transports failed to confirm the recovery in a similar fashion to the price action seen at the market top in January.
Dow Industrials Vs Dow Transports (Bloomberg)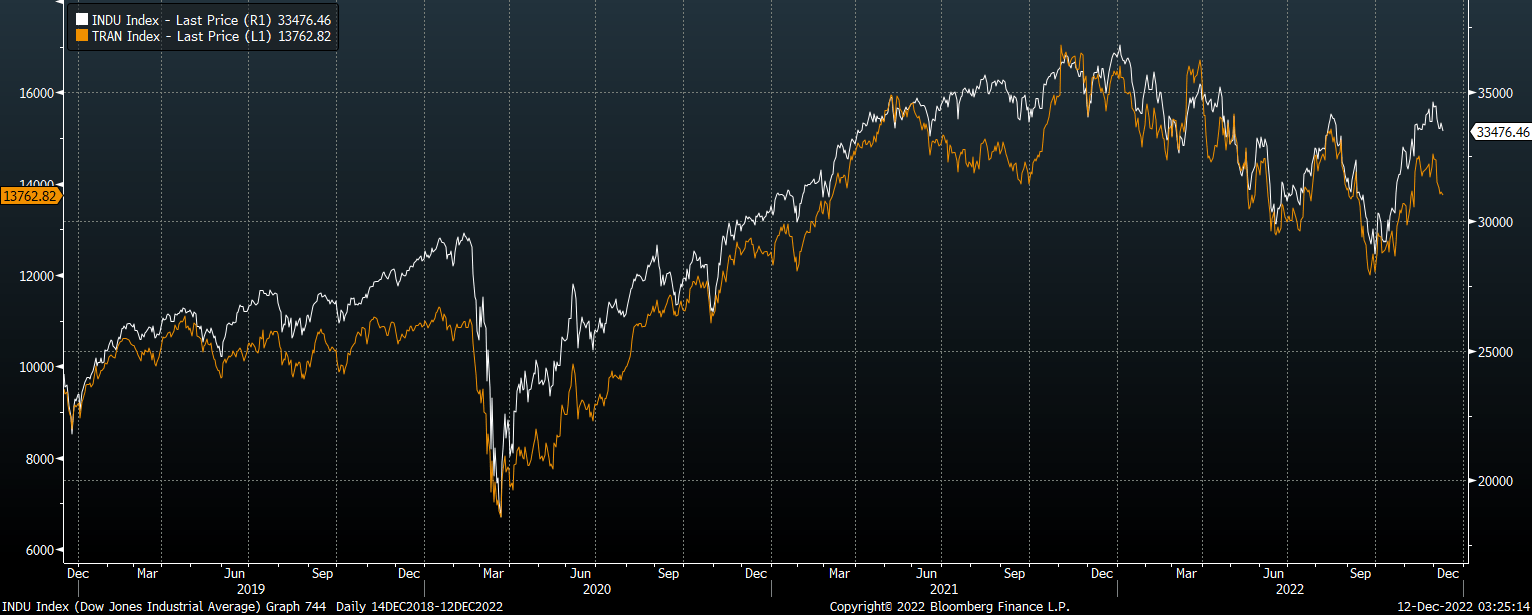
As I argued in ‘DIA: Another Dow Theory Sell Signal‘, a major market top in the Industrials has almost never occurred in the absence of underperformance in the Transports sector, and while there are a lot of false sell signals in the data, if we tighten the criteria to periods where the Industrials are trading above their 200-day exponential moving average and the Transports are trading below theirs, as is the case today, as is the case today, we find that returns over the next 12 months have been significantly below average. Since 1946, such periods have periods have produced 12-month returns of 5.5% compared with over 8% during all other periods. The failure of the Dow Industrials to hold above their August highs is another bearish signal that suggests another wave of selling is likely.
Valuations Are Back To Extreme Levels
The recent rally in the Dow has left the index extremely overvalued once again, which is a significant long-term headwind. After falling to a price/earnings ratio of 16.1x at the September lows, the ratio has since risen back to 19.3%, putting it in the top decile of valuations seen over the past two decades. While the forward price/earnings ratio is slightly lower at 18.3%, it remains historically overvalued and is higher than that of the S&P500 despite the lower weighting of growth stocks.
Dow Industrials PE And PS Ratios (Bloomberg)
These price/earnings ratios are particularly elevated when we consider that profit margins remain near their all-time highs. The price/sales ratio, for instance, which has been a far better gauge of the Dow’s true valuation over the long term, sits at 2.2x, which is 70% higher than the level seen at the previous major market peak seen in 2007. A decline in valuations back to 2007 peak levels would be enough to wipe out the equivalent of 25 years of dividend payments at the current meagre yield of 2.1%.
Summary
The recent strength in the Dow Industrials has occurred despite renewed weakness in the Dow Transportation index, which is a potential warning sign for the former. When we add in the fact that the Dow Industrials has been unable to hold on to its August highs, this suggests near term weakness. The poor near-term outlook is also joined by a weak long-term outlook owing to the index’s extreme valuations. I am therefore once again entering a short position in the DIA, anticipating a move back down to the August lows around 29,000.
Be the first to comment