

lucky336
Investment Thesis
True to its name, the WisdomTree U.S. Quality Dividend Growth Fund (NASDAQ:DGRW) is a high-quality U.S. equity ETF that has delivered 12.40% annual dividend growth over the last five years. Its 0.28% expense ratio may be a little high, but it’s one of only a handful of dividend ETFs to make monthly distributions. With $6.33 billion in assets under management, DGRW is in the conversation as one of the best dividend growth ETFs available, arguably behind peers like VIG, DGRO, NOBL, and SCHD.
While I think DGRW’s dividend growth abilities are strong, investors should consider its low 2.17% starting dividend yield and how long it will take to achieve a desirable income. It’s also worth aiming for a balanced portfolio using other non-dividend-related metrics, including volatility, sales and earnings growth, and valuation. After assessing my fundamental analysis, you’ll find DGRW lacking in a few critical areas compared to its peers, and I hope this explains why I’ve decided to limit my rating to a hold.
ETF Overview
Strategy and Performance
DGRW tracks the WisdomTree U.S. Quality Dividend Growth Index, selecting U.S. dividend-payers based on long-term earnings growth and three-year average return on assets and equity. There’s little discrimination, as DGRW holds nearly 300 companies. Instead, the Index weights constituents based on aggregate future one-year cash dividend payments, known as a dividend-dollar weighting scheme. This strategy allows low-yielding companies like Apple (AAPL) to receive a high weight due to their size. It’s a compromise between growth and value, and perhaps one reason why DGRW has followed the SPDR S&P 500 ETF (SPY) so well since its May 2013 launch. The following performance chart compares the two ETFs alongside the similar yielding Vanguard Dividend Appreciation ETF, VIG and the iShares Core Dividend Growth ETF, DGRO.
Portfolio Visualizer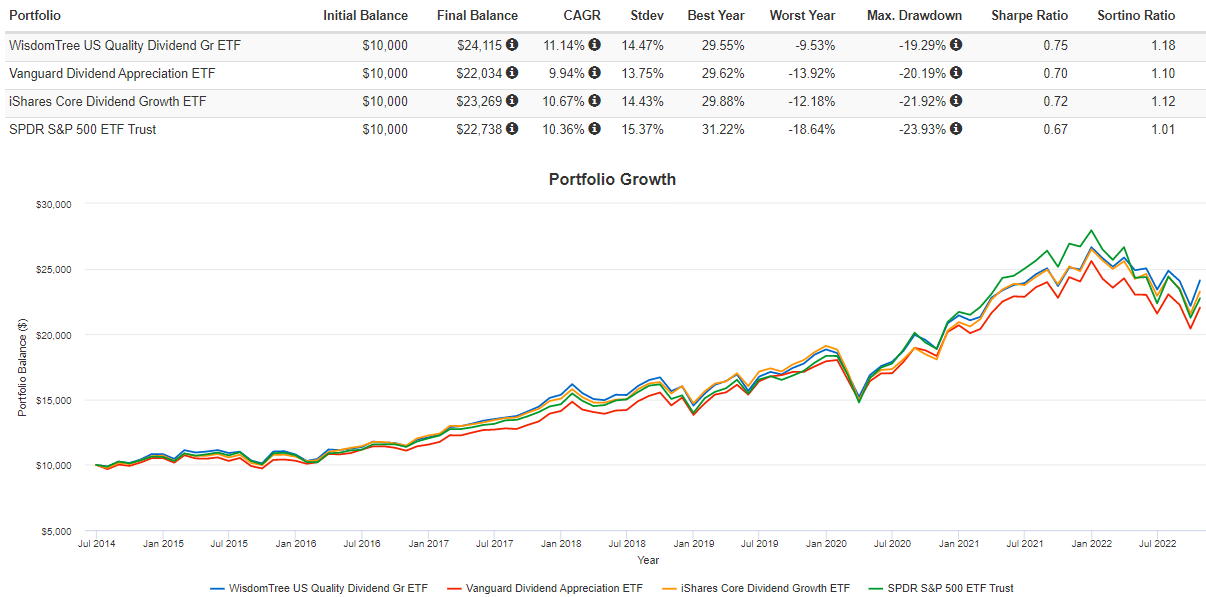
DGRW’s returns and risk-adjusted returns were the strongest, gaining an annualized 11.14% through October 26, 2022. Shareholders will particularly appreciate its 1.18 Sortino Ratio, suggesting a good level of downside protection. As I’ll highlight later, DGRW’s 0.85 five-year beta is the lowest of the four, and while there are other less volatile options, there are usually sacrifices on diversification.
Furthermore, DGRW’s month-to-month drawdowns are generally less. DGRW lost 16.85% through this year’s first nine months, besting these three peers as highlighted below. VIG did a bit better in Q1 2020, outperforming DGRW by 2.13%, but DGRW still beat DGRO and SPY by 2.63% and 0.14%.
Portfolio Visualizer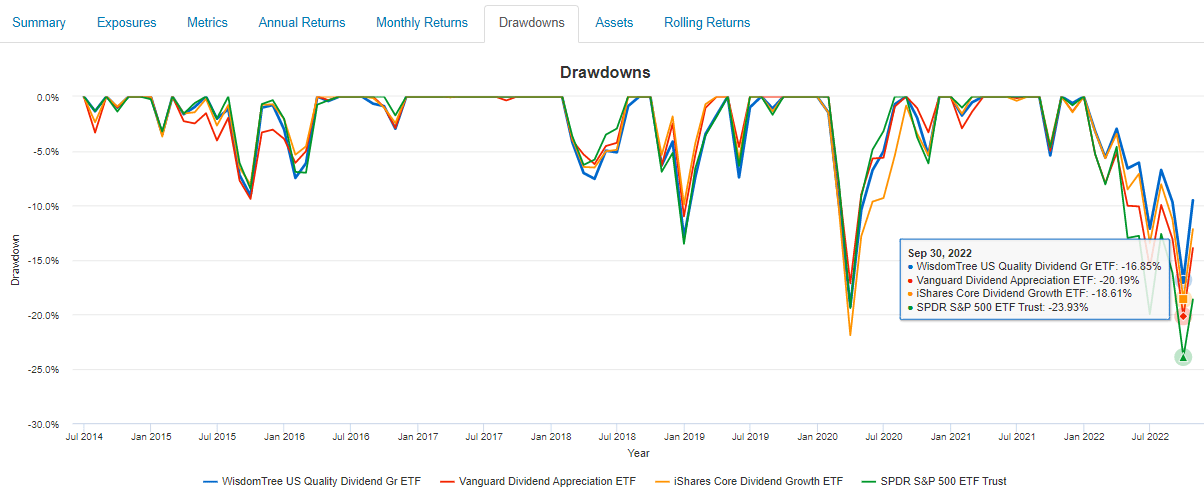
Dividends and Dividend Growth
Seeking Alpha’s Dividend Grade for DGRW is a B, but the metrics I focus on most are the current dividend yield and the long-term dividend growth rates. Ideally, they’ll work together to make DGRW a good income investment as an investor approaches retirement. With some early planning, you can avoid chasing high-yield stocks or relying on high-fee closed-end funds.
Seeking Alpha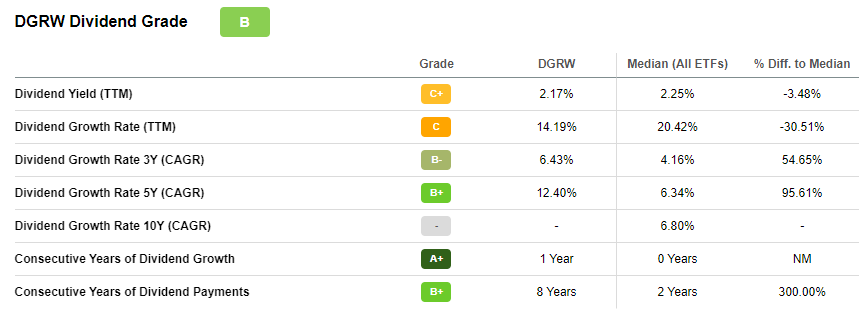
Since it’s DGRW’s key attraction, let’s start with dividend growth. The listed 12.40% five-year dividend growth rate accurately represents its long-term growth rate. Based on the 101 months between May 2014 and October 2022, I calculated an annualized 12.27% growth rate based on trailing twelve-month distributions of $0.48087 and $1.27349. For context, I did 102-month calculations for VIG, SPY, and SCHD and came up with annualized growth rates of 8.58%, 6.97%, and 11.91%. For DGRO, for the 87 months between June 2015 and September 2022, it was 9.36%. Finally, for the 96 months between September 2014 and September 2022 for NOBL, the growth rate was 12.46%. Therefore, DGRW achieves this primary objective.
The question is if it’s enough to offset its low starting yield of 2.17%. I believe it’s not. VIG, NOBL, DGRO, and SCHD, have trailing dividend yields of 1.97%, 2.05%, 2.37%, and 3.42%. SCHD is the outlier with both a high yield and a double-digit dividend growth rate, and it’s proven the most beneficial for income investors. Consider this portfolio income chart on a $10,000 investment for DGRW, NOBL, and SCHD. SCHD’s 2022 income of $607, which covers three-quarters of the year, is 53% better than DGRW’s $396.
Portfolio Visualizer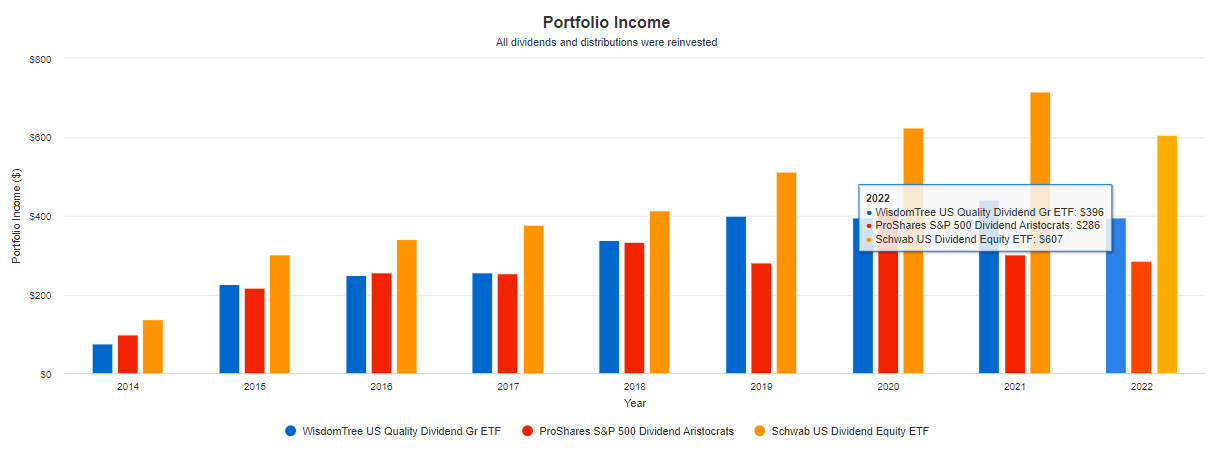
Barring significant changes to either fund, it will take a lot of work to catch up to SCHD. DGRW investors need a longer time horizon to make it worthwhile, and each investor will need to work out for themselves when they plan to switch from reinvesting dividends to taking cash payments.
ETF Analysis
I’ve established that DGRW’s low yield is a headwind, but that doesn’t make it a bad investment. As mentioned before, DGRW’s downside protection is a great reason to own. Investors should also consider other features like diversification, the potential for capital appreciation, valuation, and overall quality. I’ve highlighted these features in the table below, which covers DGRW’s top 25 holdings. I’ve also provided summary metrics for the peer group to help you make the best decision.
The Sunday Investor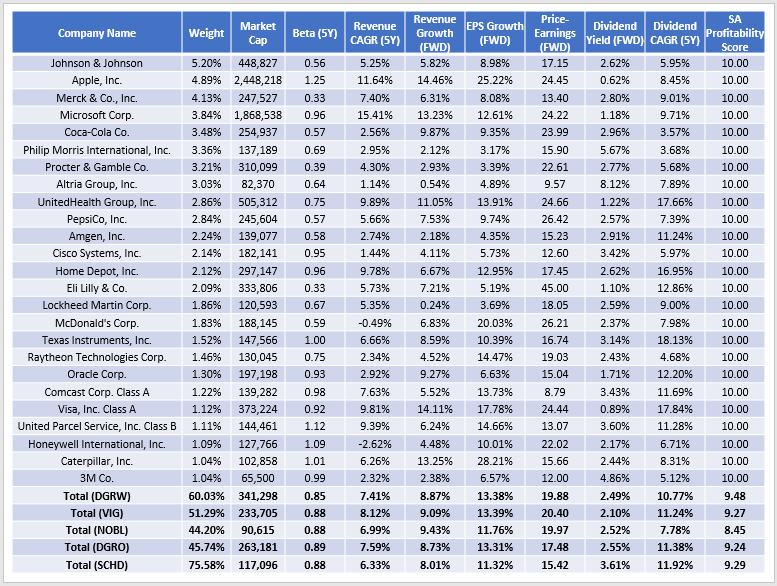
There’s a lot of data to sort through here, so let’s look at how DGRW compares against the competition from the perspective of two investor types.
Income Investor With A Long Time Horizon
Income investors with long time horizons likely don’t require a high dividend yield today. They’re happy to capture the growth equities provide, and as long as their reinvested distributions and capital grow steadily, they’re satisfied. In this case, DGRW works well. Its estimated sales and earnings growth rates of 8.87% and 13.38% are above average for this peer group. Its holdings are also highly profitable, as indicated by the weighted-average 9.48 / 10 Profitability Score. Besides the low yield, the main negative is that its forward earnings valuation (19.88x) is relatively high. DGRO and SCHD are better options, though there’s an evident sacrifice on earnings growth with SCHD. Assuming markets trend upward, I can see DGRW outperforming SCHD on a total returns basis.
Income Investor With A Short Time Horizon
An example of an income investor with a short time horizon could be someone in or nearing retirement and needing a high yield today. This investor isn’t the target for WisdomTree, especially given the ten-year Treasuries currently yield around 4%. DGRW’s 2.17% dividend yield doesn’t even cover the 2.57% five-year breakeven inflation rate. This investor should skip DGRW and target higher-yield ETFs or individual stocks. For example, the 70-90th percentile of dividend-paying S&P 500 stocks in the S&P 500 Index yield between 3.25% and 4.65% and should still be reasonably safe investments.
Measuring Diversification
The table above shows how 60.03% of assets are in DGRW’s top 25 holdings. It’s higher than VIG (51.29%), NOBL (44.20%), and DGRO (45.74%) but lower than SCHD (75.58%). Therefore, diversification may be an issue with DGRW, especially for those wanting a single ETF solution.
It’s essential to look at diversification in several ways. One method is to examine the total deviation by sector from an equal-weight-by-sector ETF (9.09% per sector), with lower values indicating better diversification. Here are the results for these five ETFs:
- DGRW: 86.43%
- VIG: 70.84%
- NOBL: 59.01%
- DGRO: 73.64%
- SCHD: 68.46%
There’s a slight change in order, but DGRW still looks poorly diversified. The reason is that it’s highly concentrated in five sectors: Technology, Health Care, and Consumer Staples. Meanwhile, Financials, Materials, Communication Services, Energy, Real Estate, and Utilities have negligible weightings.
WisdomTree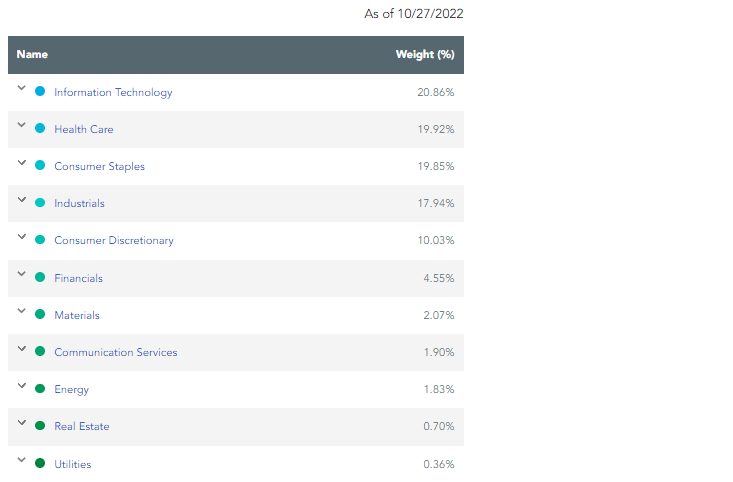
A second way is to examine the percentage of assets in each ETF’s top 25 industries, which accounts for the fact that stocks in the same industry tend to have similar correlations. Here are the results for each ETF:
- DGRW: 81.75%
- VIG: 75.73%
- NOBL: 71.03%
- DGRO: 75.67%
- SCHD: 91.29%
DGRW has 81.75% in its top 25 industries, which is about 10% more than NOBL and 6% more than VIG and DGRO. That’s two ways DGRW scores poorly on diversification, so I don’t recommend using it as your only dividend ETF. Of these peers, NOBL will provide the best diversification benefits. By industry, NOBL overweights Specialty Chemicals (5.29%), Industrial Machinery (4.14%), Integrated Oil & Gas (3.91%), and Health Care Equipment (3.78%). In contrast, its combined weighting for Pharmaceuticals, Tobacco, and Technology Hardware & Storage is only 1.59% vs. 23.38% for DGRW.
Investment Recommendation
DGRW has many good qualities, including a 12.27% long-term dividend growth rate supported by a 13.38% estimated earnings growth rate. Historically, its drawdowns are better than most peers, and that’s likely to continue, given the current portfolio’s 0.85 five-year beta. It’s a solid choice for this unstable market.
However, I’m not convinced it’s the best choice. While not prohibitive, the 0.28% expense ratio will reduce net distributions, and a low 2.17% starting yield means investors will require a long time horizon before they achieve a satisfactory income. Even if you’re a long-term holder, DGRW appears poorly diversified and a bit expensive at the moment. I suggest adding a second ETF like NOBL to improve your portfolio’s diversification and even a third like SCHD to lower your portfolio’s price-earnings ratio and improve your yield. Thank you for reading, and I look forward to answering any questions in the comments section below.
Be the first to comment