

gguy44
(This article was co-produced with Hoya Capital Real Estate)
Introduction
My last article, FFC: Six Month Checkup On This Popular Preferred Stock CEF, and noted the CEF is down over 30% in 2022. Except for those who bought FFC during the COVID crash, all other buyers over the last decade should be holding shares selling at a lower price than when purchased.
Flaherty & Crumrine provides this description of the various types of preferred securities and the risks investors take when owning them directly or via CEFs.
For investors who still have faith in Flaherty & Crumrine as a manager of Preferred stock CEFs, they have four other choices.
am.jpmorgan.com comparison tool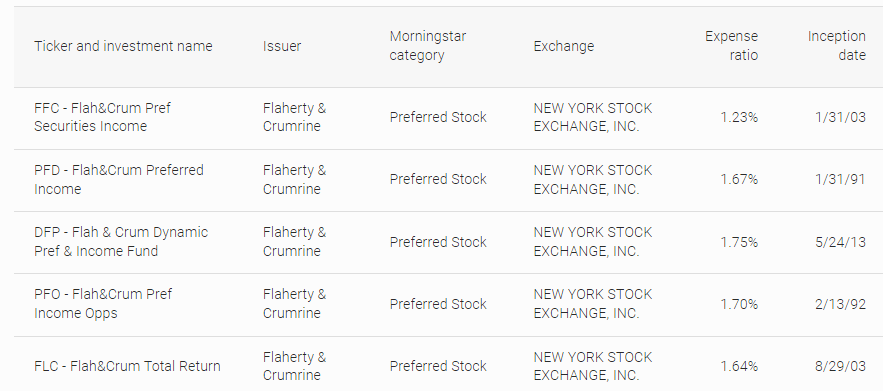
Being this is not the manager’s site, some of the data might differ depending on how often JPM updates their site.
am.jpmorgan.com comparison tool
As you can see, all five are down close to 20% YTD, plus being down over the last three years, even more so on price movement; thus all become tax-loss capture candidates.
PortfolioVisualizer.com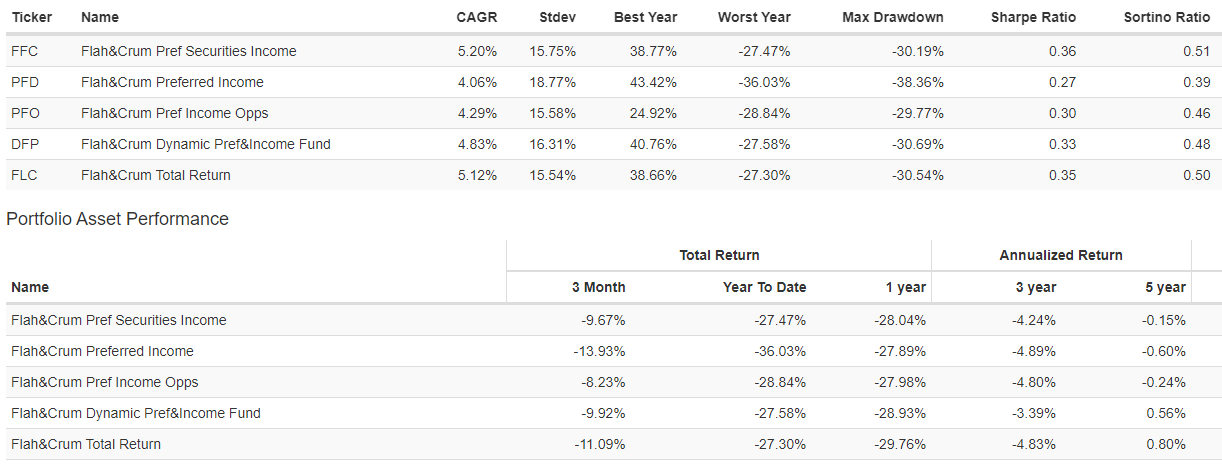
Those looking closely will notice the two sites report different CAGR data. The JPM site is reporting returns based on NAV; whereas PV uses, in my opinion, the more accurate return from price movement.
For this article, I chose the two CEFs with the best CAGR and risk data back to 2013 when one of the pair started:
- Flaherty & Crumrine Dynamic Preferred and Income Fund (NYSE:DFP)
- Flaherty & Crumrine/Claymore Total Return Fund (FLC)
For a detailed review of FFC, please read my recent article, linked above. Unlike most of my articles, I decided to not list holdings under each ticker but in the CEF comparison section.
Flaherty & Crumrine Dynamic Preferred and Income Fund review
Seeking Alpha describes this CEF as:
The Fund seeks total return by investing in a portfolio of preferred and other income-producing securities issued by U.S. and non-U.S. companies. Under normal market conditions, the Fund invests at least 80% of its Managed Assets in preferred securities, including traditional preferred stock, hybrid and trust preferred securities that have characteristics of both equity and debt securities, convertible securities, subordinated debt and senior debt. DFP started in 2013.
Source: seekingalpha.com DFP
DFP has $423m in AUM and comes with a 187bps in fees, which increases as leveraging (about 40%) costs rise. The Forward yield is listed as 7.8%.
seekingalpha.com DFP DVDs
There have been five cuts totalling 18% since the payout was raised twice post-COVID, and is now at its lowest level ever! I could not find what DFP’s distribution policy states other than ROC is permitted though hasn’t been used recently.
DFP Price & NAV review
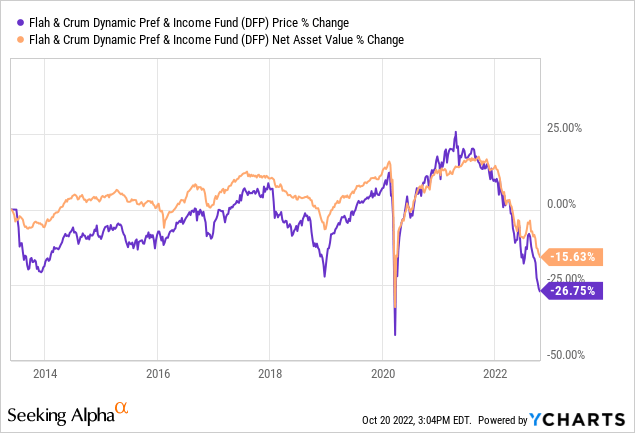
Since Total Return data was shown above, I chose only to show price and NAV movements here. Another site I use shows that FLC investors, from inception, have a CAGR just under 4.4%; those who took the payouts, about 3.8%; a much narrower spread than FLC investors experienced. This chart shows more clearly the relationship between price and NAV.
CEFconnect.com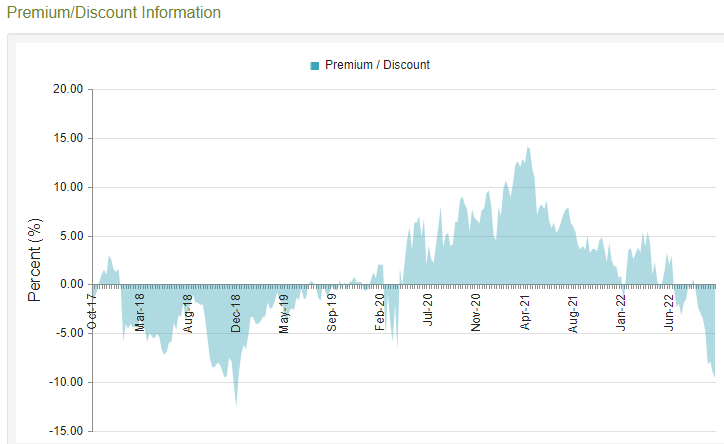
DFP’s price/NAV pattern parallels FLC very closely, with it approaching a discount level not seen since 2018. History not shown shows DFP trading at this discount level for years so this could be DFP reverting to its early years of existence, not a temporary discount level buying opportunity.
Flaherty & Crumrine/Claymore Total Return Fund review
Seeking Alpha describes this CEF as:
FLC is a diversified management investment company that seeks a high current income with secondary objective of capital appreciation. It will normally invest at least 80% of its total assets in preferred securities and other income-producing securities so, that at least 50% of its total assets are invested in preferred securities. At least 80% of the preferred securities and debt securities are investment grade quality. Up to 20% may be invested in securities rated below investment grade, provided the issuer has investment grade senior debt outstanding. Normally it will invest 25% or more of its total assets in each of the utilities industry and the banking industry. FLC started in 2003.
Source: seekingalpha.com FLC
FLC has $177 in AUM and shows a slightly lower fee of 164bps. Its Forward yield is 8.2%. Like DFP, it has also had five cuts since the post-COVID increases; again resulting in the lowest payouts since inception.
seekinglapha.com FLC DVDs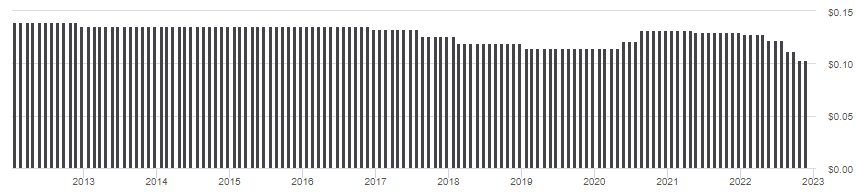
Here the cuts come closer to 22% from the recent peak.
FLC Price & NAV review
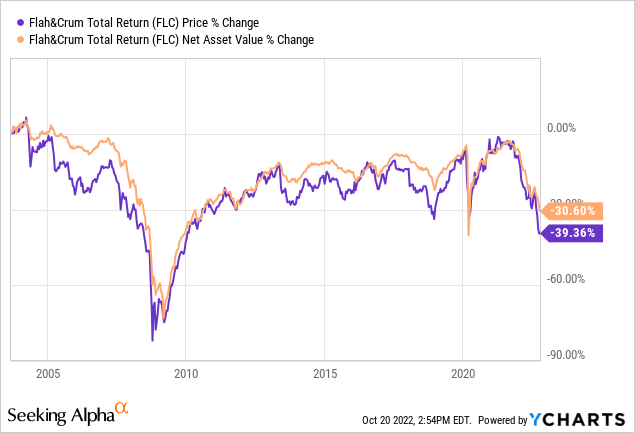
Again, the other site I use shows FLC investors, from inception, have a CAGR just under 6%; those who took the payouts, about 3.2%.
CEFConnect.com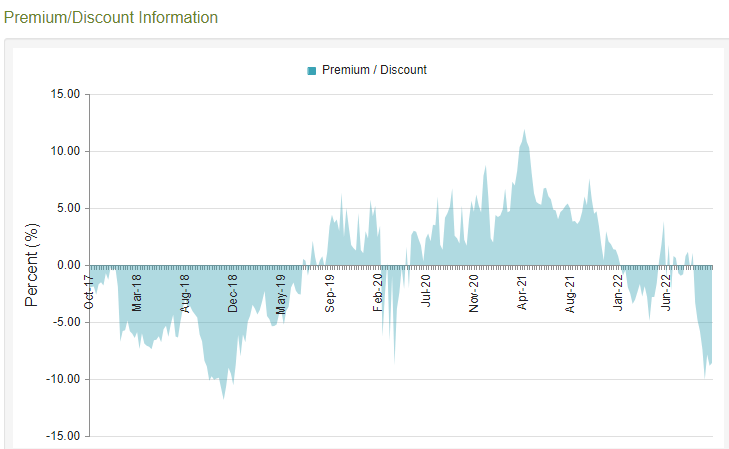
FLC is approaching a discount not seen in four years and rarely seen since the 2008-09 GFC.
Comparing CEFs
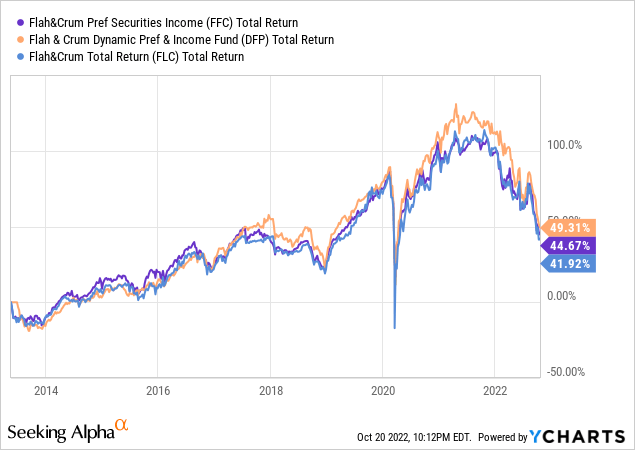
Since the premise is selling the Flaherty & Crumrine Preferred and Income Securities Fund (FFC) and buying one of the other CEFs, two of which were reviewed this time, I included FFC in this comparison. All this data is from the F&C website.
| FFC | DFP | FLC | |
| Portfolio Turnover Rate | 11.00% | 13.00% | 12.00% |
| Financial Leverage as of 10/19/22 | |||
| Leverage Outstanding | $502,000,000 | $276,300,000 | $118,500,000 |
| 1940 Act Asset Coverage Ratio | 248.40% | 249.40% | 245.90% |
| Percent Leveraged | 40.30% | 40.10% | 40.70% |
| Premium/Discount | -4.90% | -9.20% | -8.40% |
| Yield (price) | 8.15% | 7.82% | 8.20% |
| Monthly Data as of 09/30/22 | |||
| Effective Duration | 3.4 | 3.2 | 3.4 |
| Leverage Adjusted Effective Duration | 5.6 | 5.2 | 5.7 |
| Average Coupon | 6.55% | 6.48% | 6.63% |
| Number of Holdings | 231 | 212 | 218 |
| Sectors | |||
| Bank | 54.60% | 58.60% | 55.20% |
| Insurance | 21.90% | 19.90% | 22.20% |
| Energy | 6.90% | 7.70% | 6.80% |
| Utility | 7.80% | 5.50% | 6.60% |
| Finance | 3.30% | 3.30% | 3.30% |
| Miscellaneous | 2.30% | 1.90% | 2.80% |
| Communications | 1.60% | 1.60% | 1.70% |
| REIT | 1.60% | 1.60% | 1.50% |
| Moody’s Ratings | |||
| AAA | 0.00% | 0.00% | 0.00% |
| AA | 0.00% | 0.00% | 0.00% |
| A | 0.50% | 1.00% | 0.20% |
| BBB | 46.80% | 46.40% | 45.50% |
| BB | 35.20% | 35.20% | 36.50% |
| B | 0.40% | 0.40% | 0.40% |
| Below B | 0.00% | 0.00% | 0.00% |
| Not Rated | 17.10% | 17.00% | 17.40% |
| Country Allocations | |||
| United States | 74.60% | 73.30% | 72.10% |
| United Kingdom | 5.90% | 7.70% | 6.70% |
| France | 4.90% | 4.50% | 5.70% |
| Australia | 2.20% | 2.50% | 3.10% |
| Canada | 3.20% | 2.80% | 3.00% |
| Bermuda | 3.20% | 2.60% | 2.70% |
| Spain | 2.70% | 2.50% | 2.50% |
| Switzerland | 1.50% | 2.20% | 2.20% |
| Top Issuers | |||
| Citigroup | 4.10% | 4.20% | 4.70% |
| MetLife | 3.80% | 4.20% | 3.60% |
| Morgan Stanley | 3.70% | 3.40% | 4.00% |
| Liberty Mutual Group | 3.70% | 3.80% | 3.60% |
| Energy Transfer LP | 3.40% | 3.30% | 3.30% |
| BNP Paribas | 2.80% | 3.10% | 2.10% |
| Fifth Third Bancorp | 2.60% | 2.00% | 1.60% |
| Wells Fargo & Company | 2.60% | 2.90% | 1.40% |
| PNC Financial Services Group | 2.50% | ||
| JPMorgan Chase | 2.30% | 2.60% | 3.90% |
As with almost all funds, unless excluded, that invest in Preferred stocks, Finance related issuers will dominate the portfolio. This is partially due to their being big issuers of these stocks as they count toward their regulatory capital requirements. The downside is these issues have to be non-cumulative. One of the biggest differences in the above data is DFP discount far exceeds FFC’s. In fact, it is the deepest discount across all five F&C CEFs. None of the other data points show what I would consider to be material differences.
Flaherty & Crumrine haven’t posted updated holdings data since the end of May so I chose not to include it here, but I did include links for those interested.
Portfolio strategy
With the cravat I am not giving tax advice as each investor is different, tax loss harvesting is a common strategy, though the most one can claim in any year is $3000, regardless of how one files with the IRS. For investors with income approaching levels that effect their Medicare premiums (the IRMAA income breakpoints) or income levels that restrict deductions, removing capital gain income via tax-loss harvesting should definitely be considered as the year comes to a close.
As shown here and I would suspect holds for the other two F&C CEFs, they are so similar in their allocations that investors should not be changing their risk profile by swapping out one F&C CEF for any of the others, regardless of which fund they are selling or buying.
As mentioned above, there are multiple ways to implement the tax-loss strategy, such as sell one; buy another or waiting out the wash-sale period and buying back the same CEF. And of course, the buy-back-in part is optional, as is using only F&C funds or switching into an ETF instead of a leverage CEF.
Final thought
Being popular CEFs for Preferred asset investors, numerous Seeking Alpha Contributors have covered all five in recent months. Here are some links to those articles:
Be the first to comment