

RainStar
Manufacturing data has continued to cool, with the Dallas Fed’s monthly survey showing further deterioration in the month of June. The reading on General Business Outlook dropped another 4.9 points month over month to -22.6; the worst reading since the spring of 2020. Expectations are similarly at some of the lowest levels in over two years, but July did see a modest rebound.
Dallas Fed Manufacturing: Business Activity – Since 2004 (Author)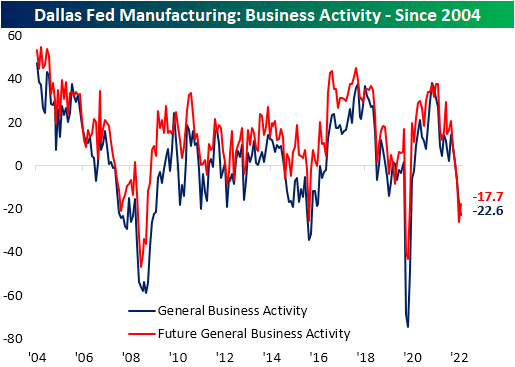
The individual categories of the report were mixed. While most remain in expansionary territory, some of the more important categories like New Orders are in deep contraction. The month-over-month moves were even more mixed, as just over half of the components fell. As we have seen across other regional Fed reports recently, expectations broadly sit at much more depressed levels, although July did see some big rebounds across categories.
Dallas Fed Manufacturing Report: July 2022 (Author)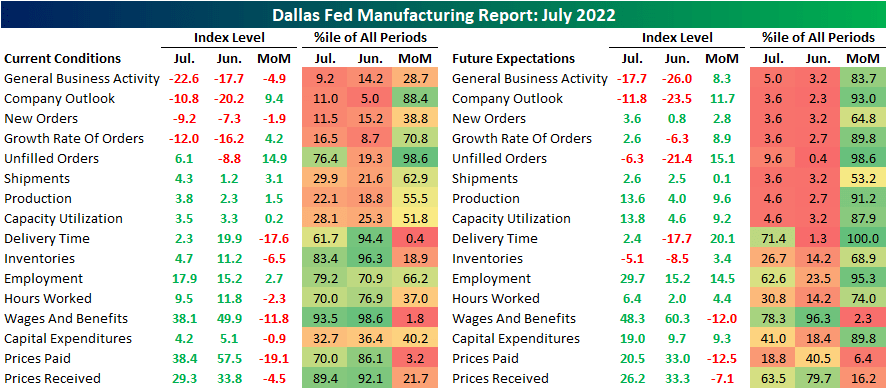
Even though demand has slowed, production expanded at a slightly accelerated rate in July. At only 3.8, though, the index is in the bottom quartile of its historical range and capacity utilization is only slightly stronger.
Dallas Fed Manufacturing: Production, Capacity Utilization – Since 2004 (Author)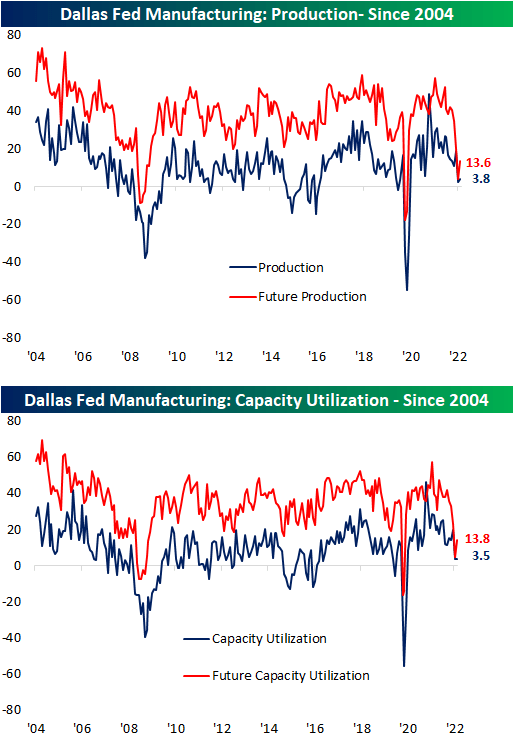
Manufacturers reported the worst slowdown in demand since the spring of 2020, as the index for New Orders fell to -9.2. The 1.9-point sequential decline was actually much smaller than the 10.5-point and 8.9-point declines in June and May, respectively; however, that nonetheless expresses demand has been weakening materially. As new demand is a fraction of what it once was, Unfilled Orders experienced a peculiarly large uptick of 14.9 points. That ranks in the top 2% of all monthly moves on record, resulting in the index to flip from a historically weak to a more solid reading.
Dallas Fed Manufacturing: New Orders, Unfulfilled Orders, Order Growth Rate, Shipments – Since 2004 (Author)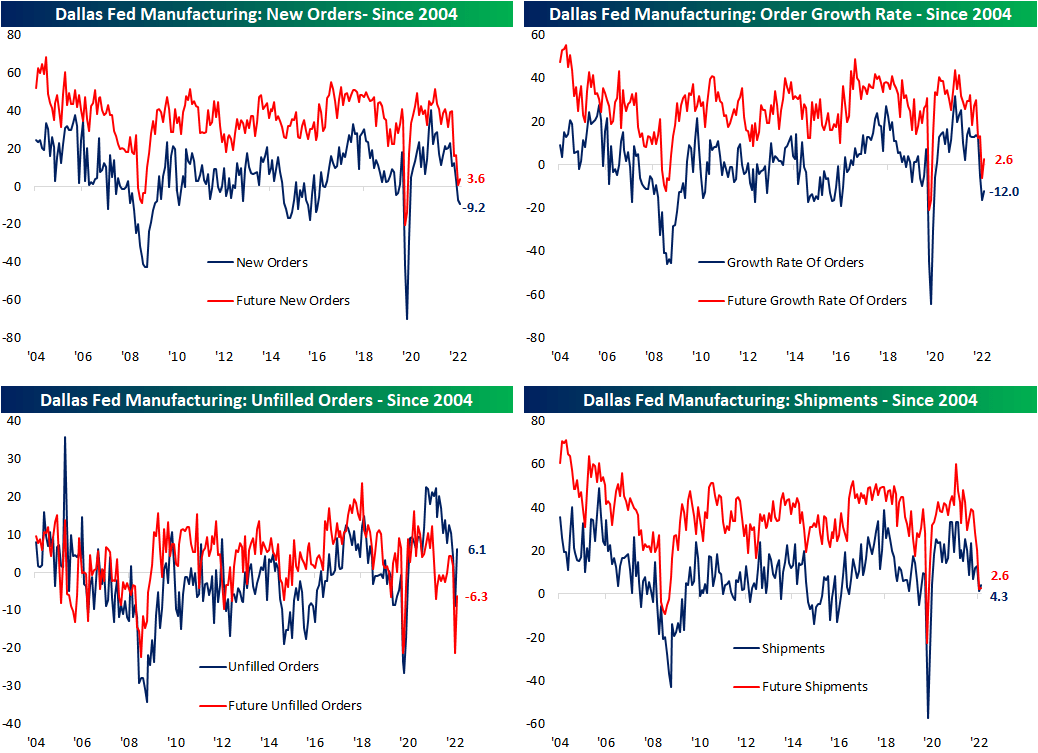
The Dallas Fed report added to the list of indicators pointing to alleviation on the supply chain front as well. The Delivery Times index experienced its second-largest one-month decline on record. Even though that brings the index to a barely expansionary level, the move heavily contrasts with expectations. Future Delivery Times recorded the largest month-over-month gain on record. Given that reading brings the index only to 2.4, it does not mean manufacturers expect delivery times to begin to surge to unprecedented levels as they did earlier in the pandemic. Rather, they no longer expect the rapid improvement that has been observed over the past several months.
Dallas Fed Manufacturing: Delivery Time – Since 2004 (Author)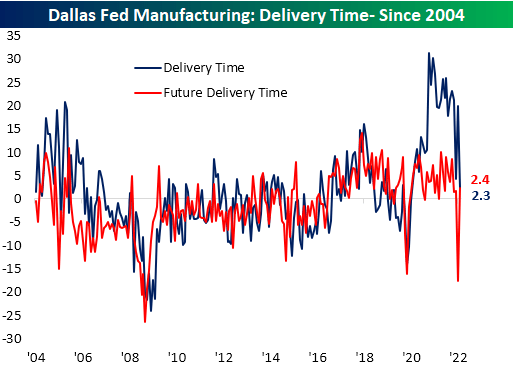
As for other metrics that have fallen off a cliff, likely thanks to the easing of supply chain bottlenecks, both Prices Paid and Received are plummeting across both current and future conditions.
Dallas Fed Manufacturing: Prices Paid, Prices Received – Since 2004 (Author)
In addition to the decline in prices paid and received, the indices tracking the growth of wages and benefits has also been pulling back sharply. Both current conditions and future expectations saw some of their largest one-month declines on record, although, at current levels, they remain more elevated within their historical range than prices paid and received. The employment index peaked well over one year ago, but it has not experienced that same sharp decline as wages in benefits. In fact, there was a modest rise in the reading in July, meaning firms increased hiring at an accelerated rate. Contrasting with that higher spending on employment, the capital expenditures index has been consistently grinding lower, with this month marking the fourth monthly decline in a row, and at 4.2, it has fallen to the lowest level since October 2020.
Dallas Fed Manufacturing: Employment, Hours Worked, Wages & Benefits, Capital Expenditures – Since 2004 (Author)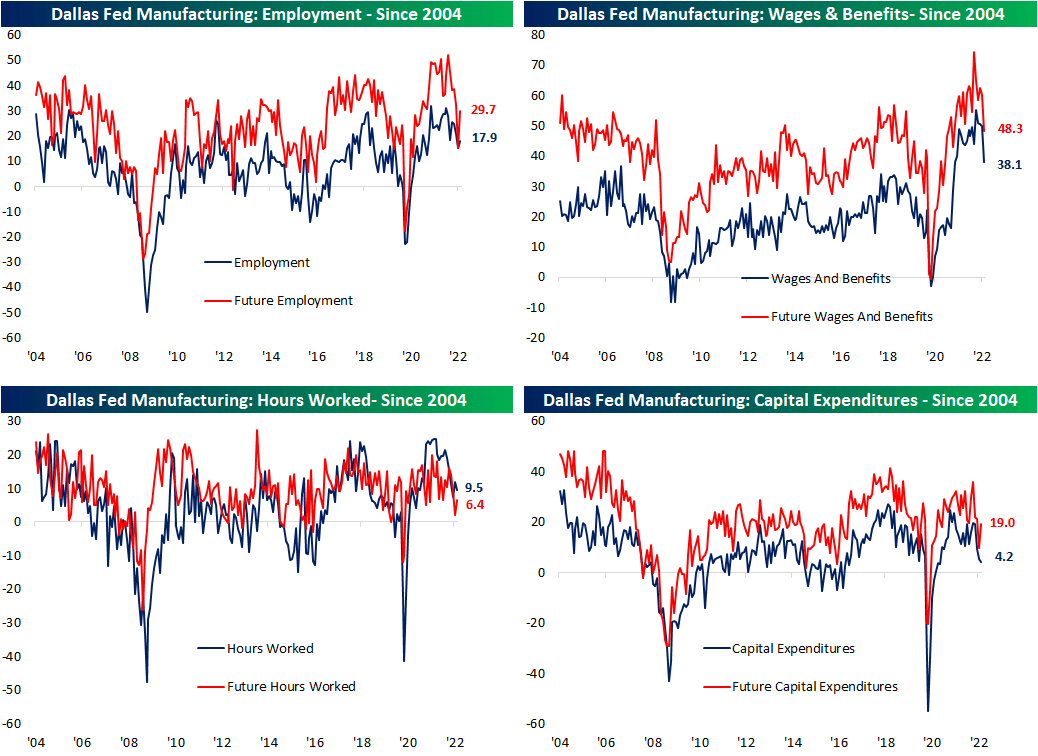
Editor’s Note: The summary bullets for this article were chosen by Seeking Alpha editors.
Be the first to comment