

Sky_Blue/iStock via Getty Images
This dividend exchange-traded fund (“ETF”) article series aims at evaluating products regarding the relative past performance of their strategies and quality metrics of their current portfolios. Holdings and their weights change over time: reviews are updated when necessary.
DEM strategy and portfolio
The WisdomTree Emerging Markets High Dividend Fund (NYSEARCA:DEM) has been tracking the WisdomTree Emerging Markets High Dividend Index since 7/13/2007. As of writing, it has 492 holdings, a distribution yield of 8.34% and a total expense ratio of 0.63%. Distributions are paid quarterly.
As described by WisdomTree, eligible companies must:
- Be investable by foreign institutions regarding corporate, industry and country rules.
- Be incorporated in one of 17 emerging market nations listed by WisdomTree.
- Have a market capitalization of at least $200 million, an average daily dollar volume of at least $200,000 for six months preceding the annual index reconstitution.
- Have positive earnings over the past year and have paid at least $5 million in cash dividends on their common stock in the 12 months prior to the annual reconstitution in October.
- Not be in the bottom decile of a risk score based on quality (profitability ratios) and momentum (6 and 12 months risk-adjusted returns).
- Not be in the top 5% of the stock universe in yield and in the riskiest half regarding the above-mentioned score.
Companies passing the previous rules are ranked by dividend yield, then the top 30% by highest dividend yield are selected for new additions to the index. To be excluded of the index, companies must rank outside of the top 35%. Specific rules apply to Chinese domestic-listed companies.
DEM invests mostly in large companies (74.3%).
DEM size segments (Chart: author with Fidelity data)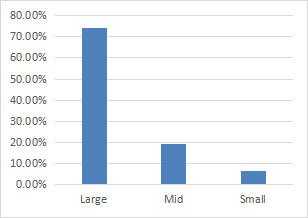
The top three countries represent 65.4% of asset value: China (26.31%), Taiwan (20.25%) and Brazil (18.84%). Other countries are below 8%.
DEM countries (Chart: author with WisdomTree data)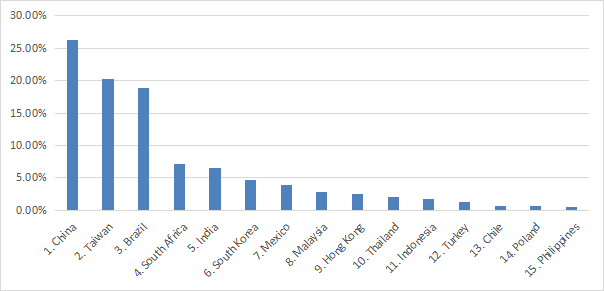
The portfolio has two major sectors: financials (26%) and materials (21.2%). Other sectors are below 12%.
DEM sectors weights (Chart: author with WisdomTree data)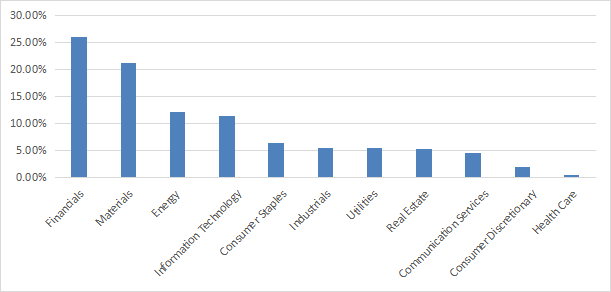
DEM is significantly cheaper than the emerging market benchmark iShares MSCI Emerging Markets ETF (EEM). The next table compares the usual valuation ratios. However, these ratios may be skewed by the heavy weight of financials, whose metrics are naturally cheaper and less reliable.
|
DEM |
EEM |
|
|
Price/Earnings TTM |
5.47 |
10.78 |
|
Price/Book |
0.87 |
1.61 |
|
Price/Sales |
0.6 |
1.28 |
|
Price/Cash Flow |
4.07 |
7.79 |
(Data source: Fidelity)
The next table lists the 19 stocks weighting more than 1% of asset value. Their aggregate weight is 39.4%. The top 10 holdings weight 29.5%. Vale S.A. (VALE) is the heaviest one (9.46%). Exposure to other companies is under 4%.
|
Security Description |
Ticker |
Weight % |
|
Vale S.A. |
VALE3 BS |
9.46% |
|
Petroleo Brasileiro S.A. |
PETR3 BS |
3.94% |
|
China Construction Bank Corp H |
939 HK |
3.70% |
|
Hon Hai Precision Industry Co. |
2317 TT |
2.45% |
|
Industrial & Commercial Bank of China-H |
1398 HK |
2.28% |
|
Bank of China Ltd. |
3988 HK |
2.14% |
|
Grupo Mexico SAB de CV |
GMEXICOB MM |
1.79% |
|
PT Telkom Indonesia TBK |
TLKM IJ |
1.26% |
|
China Shenhua Energy Co Ltd |
1088 HK |
1.26% |
|
Impala Platinum Holdings Ltd |
IMP SJ |
1.22% |
|
ASUSTek Computer Inc. |
2357 TT |
1.22% |
|
Malayan Banking Bhd |
MAY MK |
1.20% |
|
China Petroleum & Chemical Corp H |
386 HK |
1.10% |
|
Ping An Insurance Group Co of China |
2318 HK |
1.09% |
|
ITC Ltd |
ITC IB |
1.09% |
|
Quanta Computer Inc. |
2382 TT |
1.08% |
|
PetroChina Co Ltd. |
857 HK |
1.07% |
|
Power Grid Corp of India Ltd |
PWGR IB |
1.04% |
|
Sibanye Stillwater Ltd |
SSW SJ |
1.01% |
Past performance compared to competitors
The First Trust Dow Jones Global Select Dividend ETF (FGD), reviewed here, is a competitor with a more moderate yield (6.4%). DEM has lagged it since January 2008 by 67 bps in annualized return. However, it shows a lower risk in drawdown.
|
Since 1/2008 |
Total Return |
Annual.Return |
Drawdown |
Sharpe Ratio |
Volatility |
|
DEM |
31.78% |
1.92% |
-52.39% |
0.2 |
20.43% |
|
FGD |
44.97% |
2.59% |
-66.23% |
0.22 |
21.23% |
Data calculated with Portfolio123
At the same time, the S&P 500 (SPY) has returned 253% (9% annualized).
The Vanguard International Dividend Appreciation ETF (VIGI) is more recent (inception in February 2016). VIGI, reviewed here, has a much lower yield (1.6%): it implements a dividend growth strategy, it is not a high-yield fund. Both ETFs have similar returns, but DEM shows a higher risk in drawdown and volatility, so VIGI is the winner in risk-adjusted return (Sharpe ratio).
|
Since 3/2016 |
Total Return |
Annual.Return |
Drawdown |
Sharpe Ratio |
Volatility |
|
DEM |
56.33% |
7.29% |
-37.71% |
0.36 |
16.59% |
|
VIGI |
55.16% |
7.16% |
-29.73% |
0.45 |
13.69% |
At the same time, SPY has returned 124% (13.5% annualized).
Since Inception, DEM has lost almost 29% in share price.
DEM share price (TradingView on Seeking Alpha)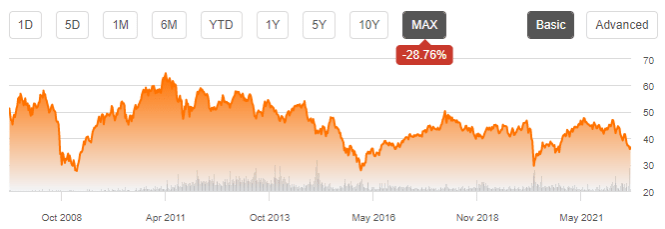
This issue is not specific to DEM: securities with yields above 6% suffer from capital decay, on average (there are rare exceptions). The 10-year average annualized return including dividends of all ETFs with a yield superior to 6% is 4.5% for an average yield of 8.8%.
Unlike for most high-yield ETFs, capital decay didn’t imply income stream decay for DEM. The annual sum of distributions was $2.28 in 2011 and $2.54 in 2021.
Takeaway
DEM is a well-diversified fund invested in 492 dividend stocks from emerging markets. It applies a risk filter to avoid most high-yield traps. It is overweight in financials and materials. China and Taiwan weight over 46% of asset value, which is a bad point for investors concerned by geopolitical and regulatory risks. The fund has lagged one of its closest competitors since inception (FGD), but risk-adjusted performance is similar. Emerging markets indexes have lagged U.S. benchmarks by far for years, and DEM is no exception.
In summary, DEM may be interesting for income-oriented investors who seek exposure to emerging markets and feel comfortable with risks related to China, financials and the top holding VALE. For transparency, a dividend-oriented part of my equity investments is split between a passive ETF allocation (DEM is not part of it) and my actively managed Stability portfolio (14 stocks), disclosed and updated in Quantitative Risk & Value.
Be the first to comment