


???? ??????/iStock via Getty Images
Trades seeking a cost-effective and convenient way to invest in commodity futures should go with the liquid Invesco DB Commodity Index Tracking Fund (NYSEARCA:DBC). According to Invesco, DBC tracks a rules-based index composed of futures contracts on 14 of the most heavily traded and important physical commodities in the world. The ETF is rebalanced and reconstituted annually in November.
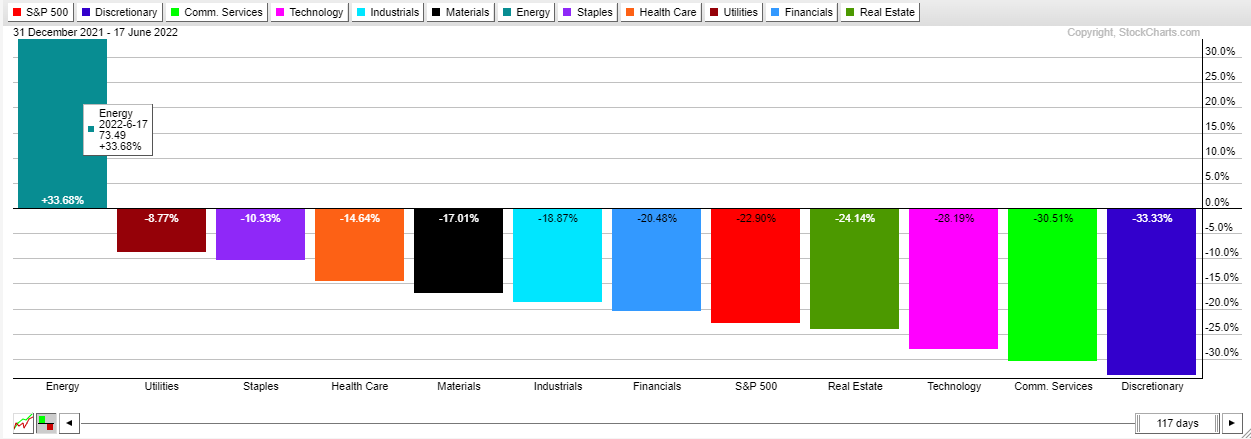
Stocks have taken a beating in just the last eight trading days. The S&P 500 is off 12% while the worst-performing sector has been Energy. Oil & gas names were once the high-fliers of 2022 – the Energy Select Sector SPDR ETF (XLE) was up about 70% for the year at its zenith. Now, however, energy equities are up just 34% for 2022.
Bears Target The Winners: XLE Was Up 70% YTD, Now Just 34%
Stockcharts.com
That sharp fall from grace has helped usher in a huge percentage of S&P 500 stocks trading below their respective 50-day moving averages. Just 2.2% of SPX components are above that key trend gauge, according to IndexIndicators.com.
Just 2.2% of S&P 500 Stocks Now Trade Above The 50-Day Moving Average

IndexIndicators
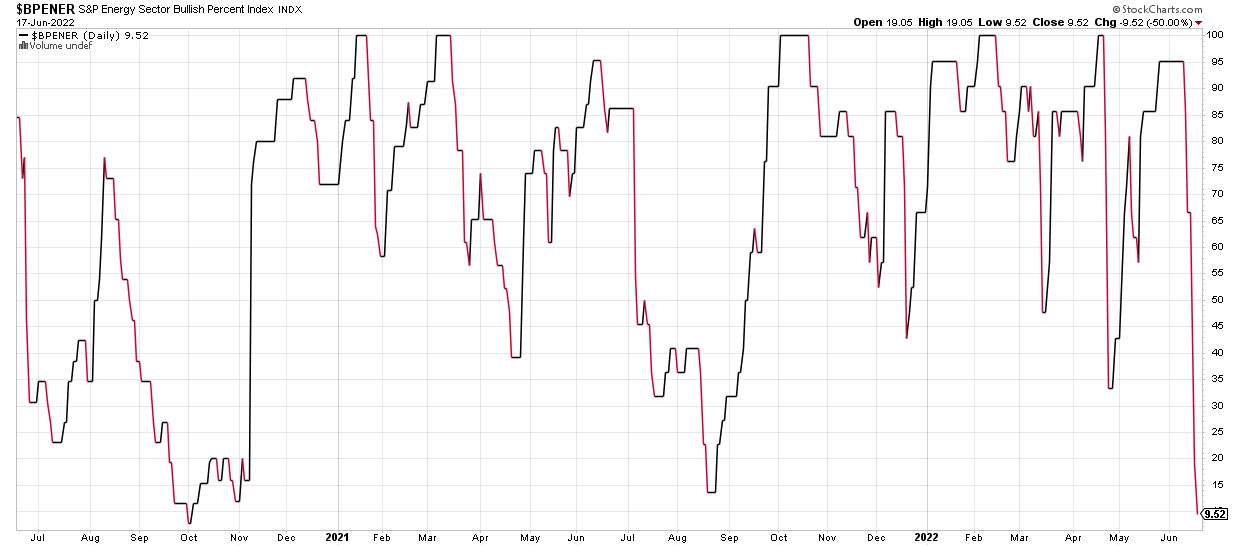
Remarkably, the Energy sector’s bullish percent index went from near 100% two weeks ago to just 9.5% now, according to Stockcharts.com. The Bullish Percent Index, or BPI, is a breadth indicator that shows the percentage of stocks on Point & Figure Buy Signals.
Energy Sector Bullish Percent Index Is The Lowest Since Oct 2020
Stockcharts.com
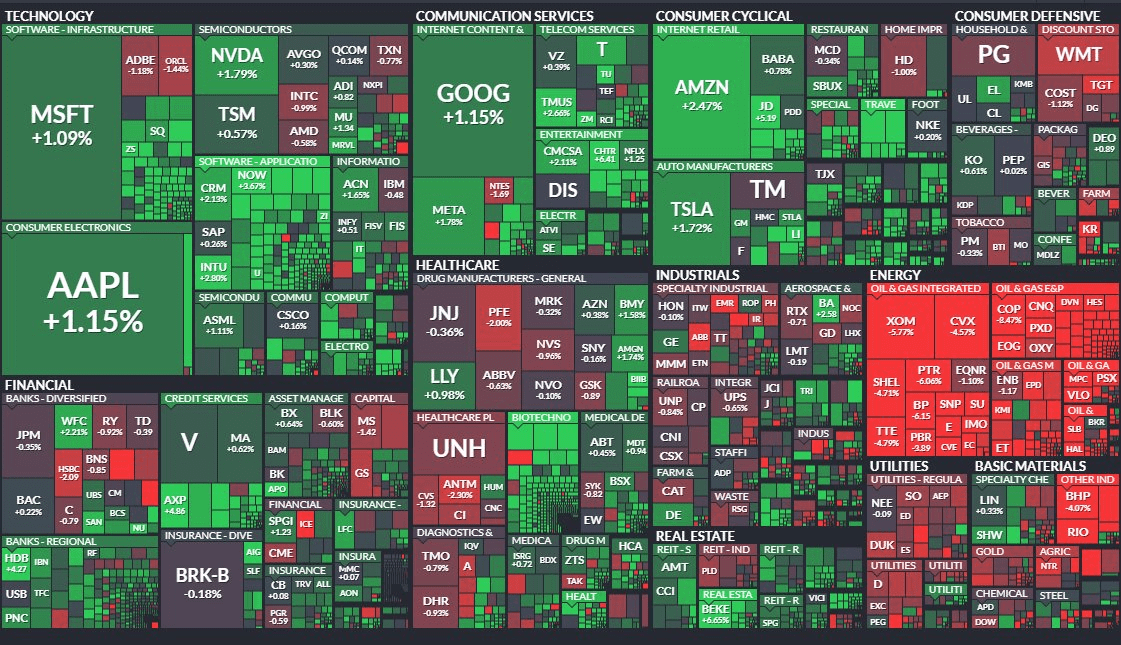
The energy and commodities drubbing was not confined to the domestic market on Friday. Many large foreign resource companies took a beating to close out the week – all while mega-cap tech finished solidly in the black.
Global Energy Stocks Cratered On Friday As Mega-Cap Growth Rises
Finviz
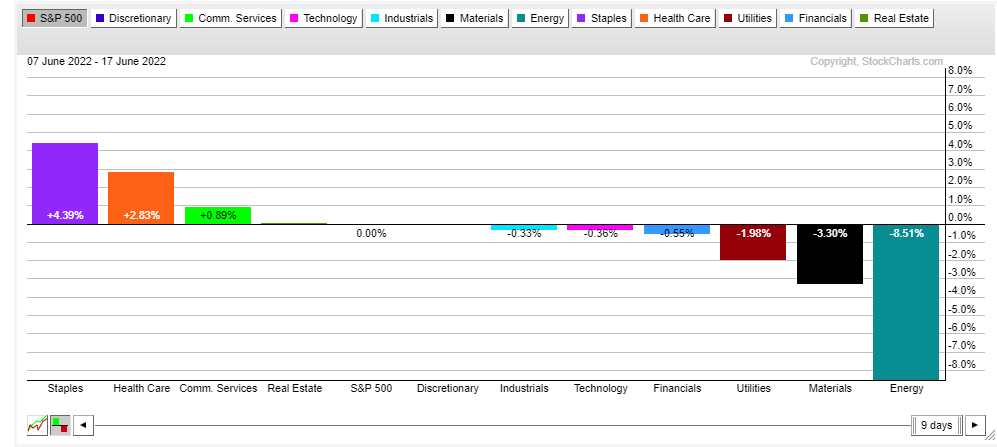
The bears have finally come after energy stocks recently – it is the worst sector in the last week-and-a-half. That tells me the focus is shifting from inflationary pressures to a growth scare as a global recession looms.
Relative Sector Returns Last 8 Trading Days: Energy Leads The 12% S&P 500 Plunge
Stockcharts.com
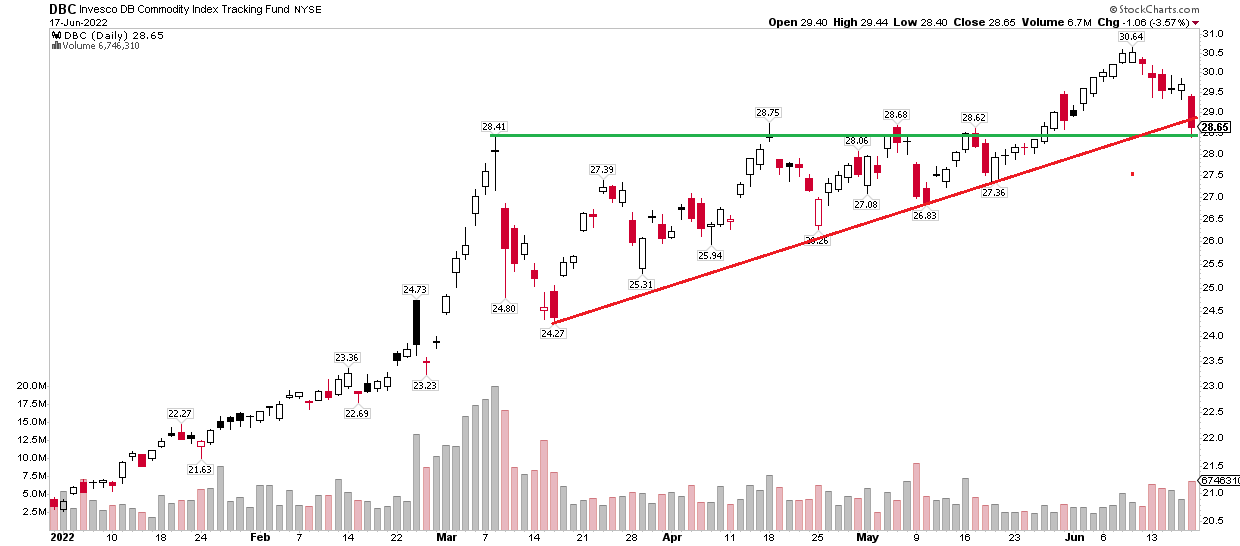
Now let’s home in on what is happening with my featured ETF – DBC. The fund tracks a broad commodity basket but is comprised mainly of energy (oil). I noticed that DBC sits at an extremely critical juncture. Friday’s price-action closed at what was former resistance. The polarity principle states that what was resistance on the way up should be support on the way down. Thus, the $28 to $29 range is critical.
Featured ETF: DBC Commodity Tracking ETF: Throwback To A Confluence Of Support
Stockcharts.com
A breakdown below $28 would solidify a bearish false breakout. Another idiom we have in technical analysis parlance is “from false moves come fast moves in the opposite direction.”
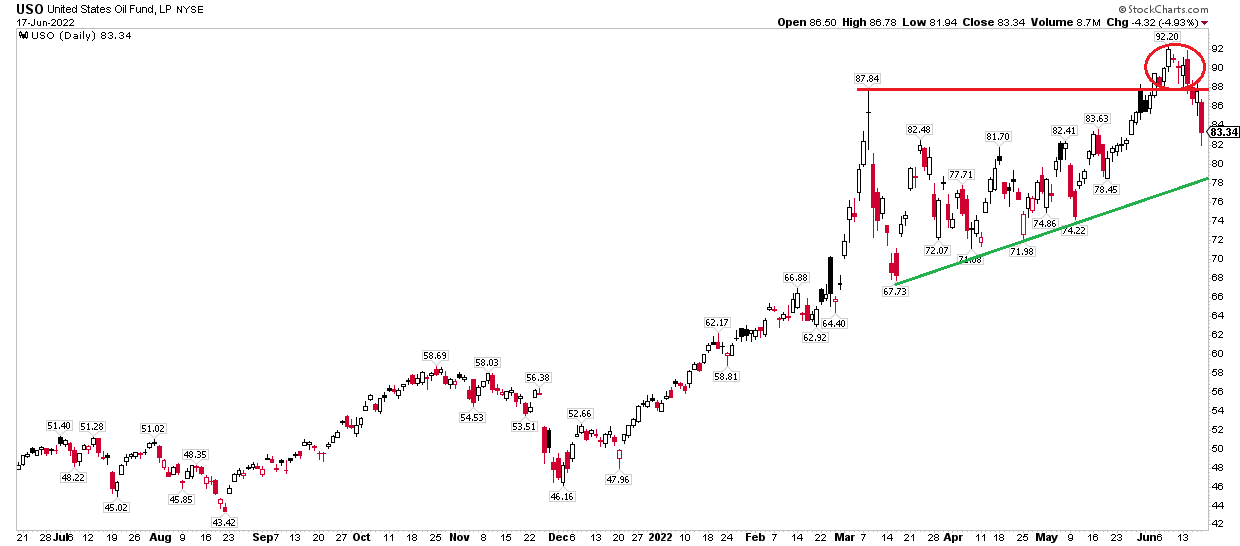
USO Oil ETF: Bearish False Breakout, Nearing Uptrend Support Line
Stockcharts.com
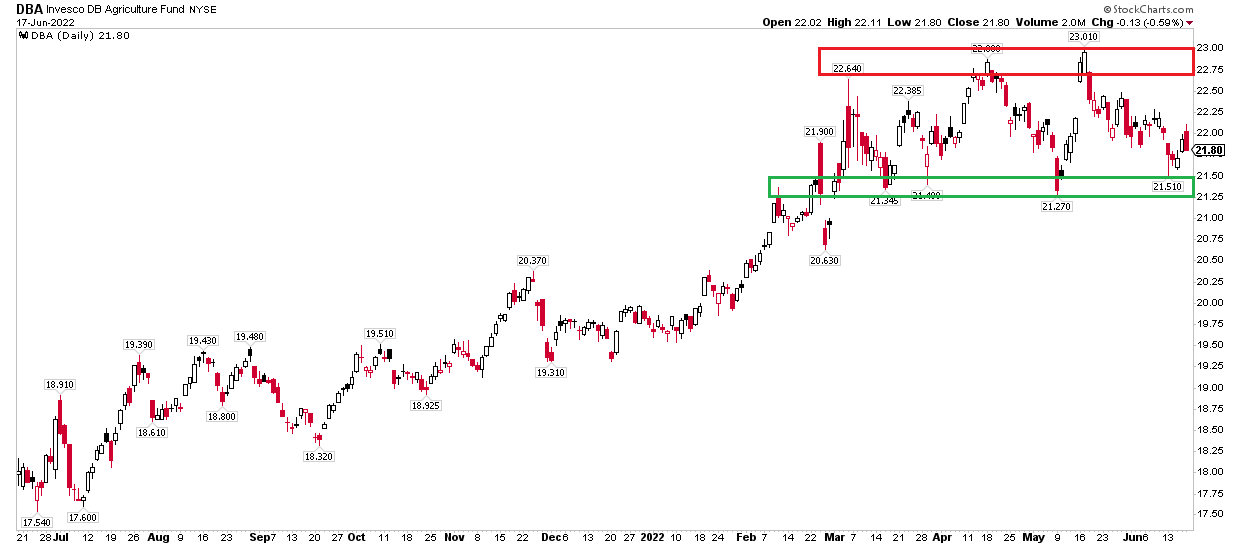
Digging deeper into the commodity space, agriculture was unable to confirm energy’s breakout. Invesco DB Agriculture Fund (DBA) is simply rangebound between $21 and $23 from March through today. If this fund undergoes a bearish breakdown, that would confirm a downside move on DBC.
Agriculture Fund: Did Not Confirm New Highs In Energy, Remains Trendless
Stockcharts.com
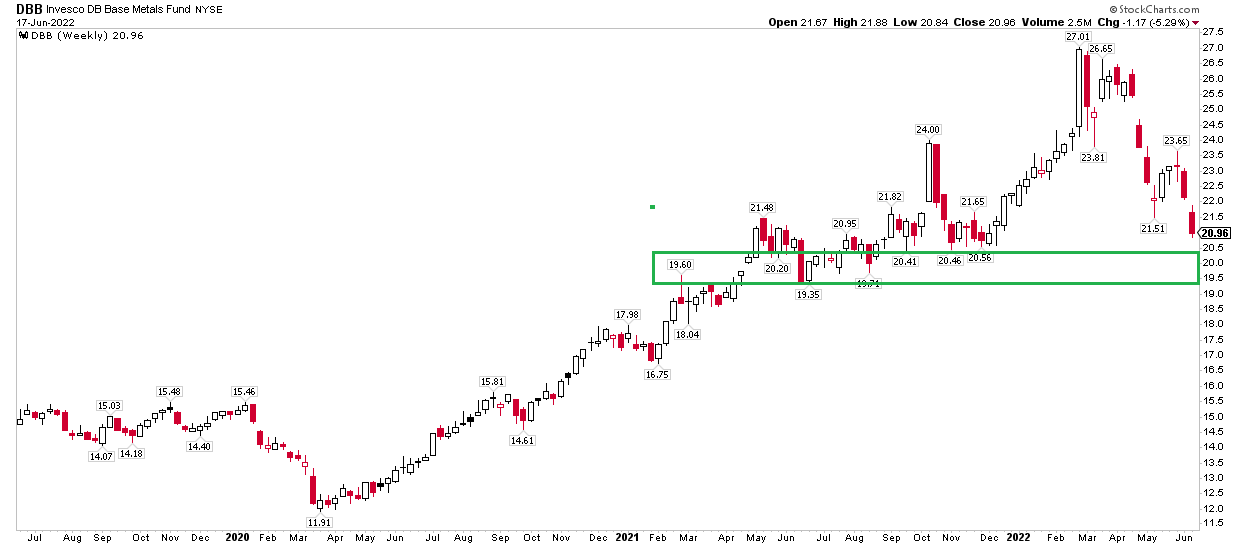
What’s more, DBB, the base metal fund, is approaching critical support just above the $20 figure. Same story here – a move below that spot portends bearish things for the broad commodity complex. And perhaps global growth prospects.
Base Metals ETF: Also Coming Down To Support
Stockcharts.com
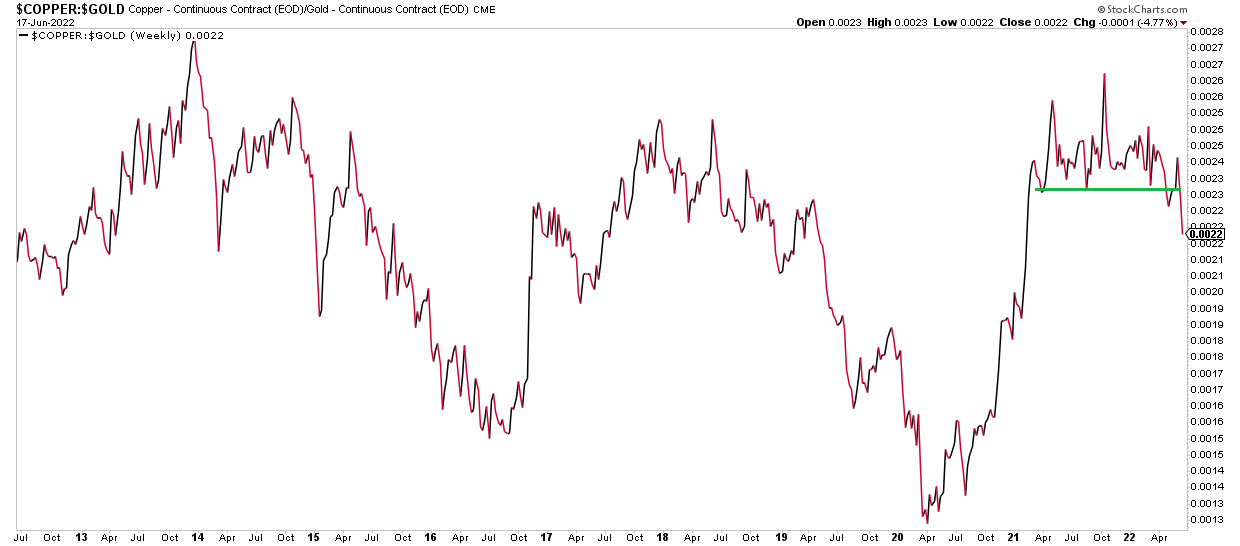
A ratio chart making the rounds right now is what is happening with copper vs gold. Copper, seen as a bellwether global industrial indicator, breached supported vs the so-called safe-haven shiny yellow metal. That’s another arrow in the bears’ quiver with respect to a likely downturn in GDP.
Eyeing the Copper: Gold Ratio Chart For Bearish Clues
Stockcharts.com
The Bottom Line
Commodities are still in favor, but its uptrend is in serious jeopardy. Traders should watch for a downside violation of the $28 level on DBC. Below that, things could get ugly for commodities and resource-related stocks. Bigger picture, a bearish trend change in commodities would confirm a pronounced shift away from the inflation narrative to serious global recession fears.
Be the first to comment