DAX 30, CAC 40 Price Analysis & News
- Coronavirus Spread in Europe Weighs on Outlook
- DAX & CAC 40 Heads Lower
- Eyes on ECB Measures
The Coronavirus is spreading quickly across Europe with Italy resorting to emergency measures through plans to close schools and universities, potentially setting a precedent for the rest of Europe. At the same time, China’s economic hit from the virus is likely to spill-over to the rest of the world, however, more so for Europe, given its exposure to China.

Recommended by Justin McQueen
Download our fresh Q1Equities Forecast
Equities Technical Analysis
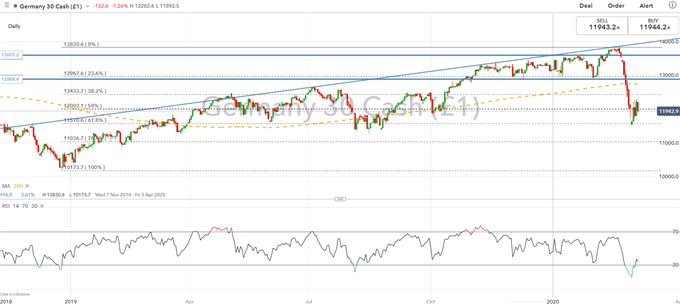
DAX: Having posted a modest rebound in yesterday’s session, the DAX has quickly faded its attempted recovery as concerns continue to linger across Europe. On the monetary policy front, the Federal Reserve provided an emergency rate cut. However, while the ECB has limited ammo on the monetary policy front with regard to interest rates, they may provide better measures to ensure stability via more targeted programs to reduce the burden on SMEs (announcement likely to come in the ECB March 18th meeting). That said, macro trends are likely to dictate price action and with the current situation looking set to get worse before improvement is seen, the outlook for the DAX remains cautious.
| Change in | Longs | Shorts | OI |
| Daily | 13% | -3% | 6% |
| Weekly | -8% | -2% | -5% |
|
Support |
Resistance |
||
|
11570 |
61.8% Fib |
12000 |
– |
|
11370 |
Aug 2019 Triple Bottom |
12433 |
38.2% Fib |
|
11036 |
76.4% Fib |
12744 |
200DMA |
DAX Price Chart: Daily Time Frame
IG Charts
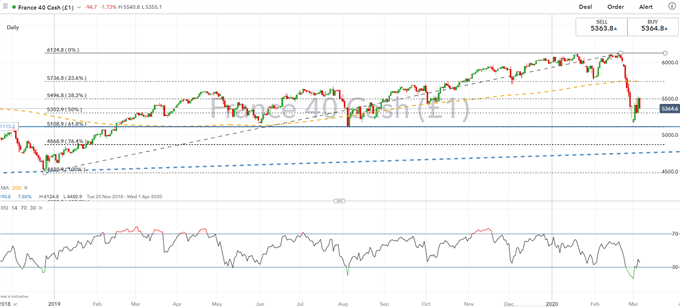
CAC 40: Much like the DAX, there is little in the way of notable support (until 5115) with the index back on the decline. As such, a break below support, which also coincides with the August 2019 low, could leave the index exposed to greater downside below 5000.
|
Support |
Resistance |
||
|
5302 |
50% Fib |
5496 |
38.2% Fib |
|
5115 |
August 2019 Low |
5736 |
200DMA |
|
5000 |
– |
5770 |
January 31st Low |
What is CAC 40 and What Influences its Price?
CAC 40 Price Chart: Daily Time Frame
Source: IG Charts
— Written by Justin McQueen, Market Analyst
Follow Justin on Twitter @JMcQueenFX


Be the first to comment