

iambuff/iStock via Getty Images
Investment Thesis
Even if we find ourselves in a bear market, my pair of stocks will be looking to provide alpha from the long stock, as I anticipate the long stock will outperform the short position over time. I picked both stocks from the software sector since it has some unique characteristics that make exponential growth more attainable. Here’s how the spread long Datadog (NASDAQ:DDOG) and short IBM (NYSE:IBM) looks like historically, since 2019 when Datadog got listed:
SeekingAlpha
Introduction
There are 2 ways in which I think about this stocks pair. Firstly, we can look at the fundamentals to decide which companies are suitable for both long and short. Secondly, another important filter is technical analysis, especially for the short part. There are many types of potential shorts that I can choose from, but in the end, I decided to go with a mature company that everybody expects will perform well and the return will be much lower than the return for my long position. I am thinking about this in terms of cyclical vs defensive stocks so I will try to pick a low-beta stock as my short.
I will for sure avoid any high growing company that has a rough patch and has fallen out of the investors’ grace (the grow at all cost type of company). These have a small chance of recovering and usually the high growth translates into a high beta. This is not a risk that I’m willing to take so I will go for a mature company that signals a potential slowdown in the business performance.
Long stock
Firstly, I need to decide which industry might provide the best returns after the tide will turn. And I believe that it will. Perhaps not in a few weeks or months, but it will. In my opinion, one of the best industries to invest in is software. It showcases low fixed costs, which creates operating leverage (proved by very high gross margin), small amount of (CAPEX) required to grow exponentially, high % of recurring revenue, which offers good revenue visibility and improves the free cash flow, and low debt. These characteristics make software companies more resilient in the face of an economic recession, especially the ones that don’t carry any debt on their balance sheet and have a strong cash position or the ability to consistently generate free cash flow.
To identify the best software companies, I will use the Rule of 40. It’s a widely used software metric that usually contains the quarterly YoY revenue growth and operating margin or (FCF) margin as % of revenue. For the revenue part I will use the 2022 expected revenue (CAGR) to remove the seasonality that might appear when using quarterly data. Moreover, I will use the (LTM) (FCF) instead of operating margin as I believe it’s the most rigorous metric to look at and it showcases a company’s ability to generate cash, even when having negative operating margin.
Another important aspect that I need to consider in the analysis is the stock-based compensation. I believe this is a true economic cost for the company and as a result I will not add back the (SBC) to the Net profit when calculating the Operating Free Cash Flow. I will treat the (SBC) as a real expense and since it’s already expensed on the Income Statement, I will not add it back. The formula that I used for (FCF) becomes:
(FCF) = Cash from operations – CAPEX
TIKR.com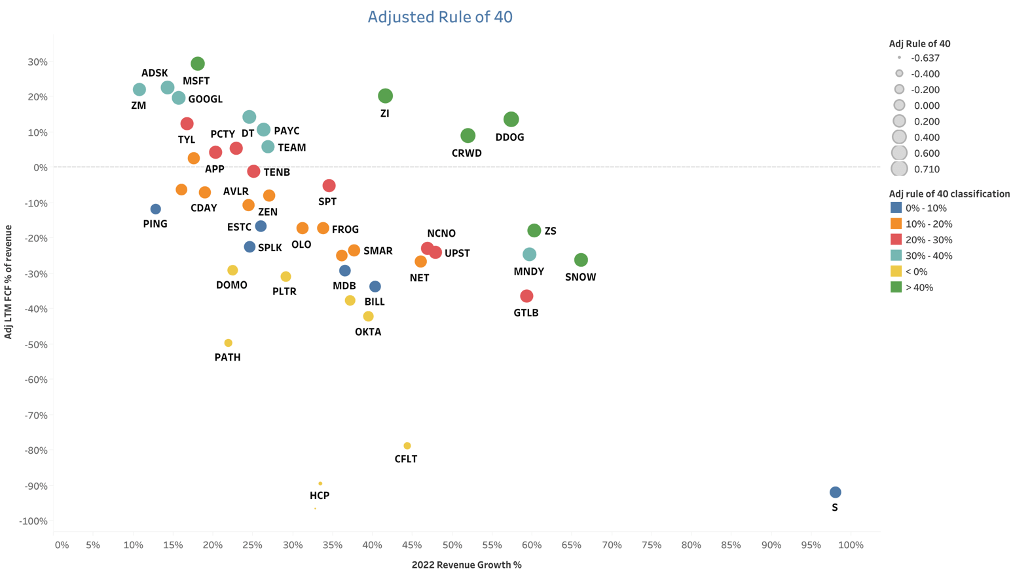
As we can observe, when expensing the (SBC), there are only 6 companies that have a Rule of 40 > 40%. The best from this data set is Datadog. It has a result of 71%, composed of 57% YoY revenue growth and 14% (FCF) margin. This is not enough to decide if this will be my pick and further analysis is needed for their unit economics.
Introducing Datadog
Datadog S-1 file
Datadog created a platform that integrates and automates infrastructure monitoring, application performance monitoring (APM) and log management to provide unified, real-time observability of their customers’ entire technology stack. Since 2018, when the company introduced its log management product, it became one of the first to combine the “three pillars of observability” to enable digital transformation and cloud migration. Datadog is designed to be cloud agnostic and easy to deploy, with hundreds of out-of-the-box integrations and endless customizability.
Datadog has recently been named a leader in the (APM) and Observability space by research and consulting firm Gartner. Other leading companies are Dynatrace, New Relic, Honeycomb, and IBM:
Gartner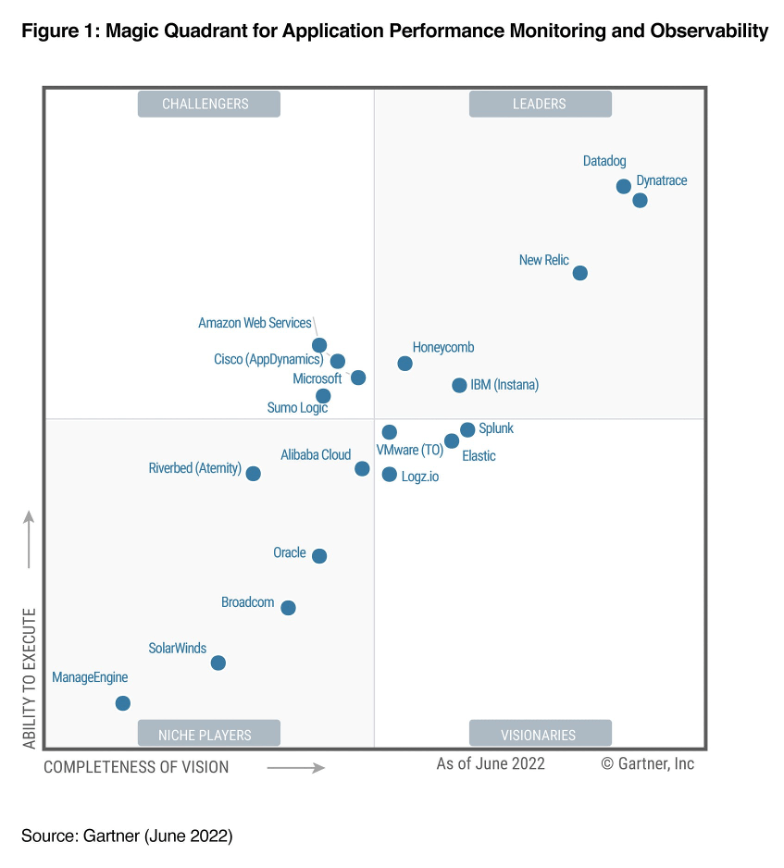
Customers
Datadog uses (ARR) as their preferred key performance indicator. (ARR) is defined as the annual run-rate revenue of subscription agreements from all customers at a point in time. It is calculated by taking the monthly run-rate revenue and multiplying it by 12.
Datadog 10-K 2021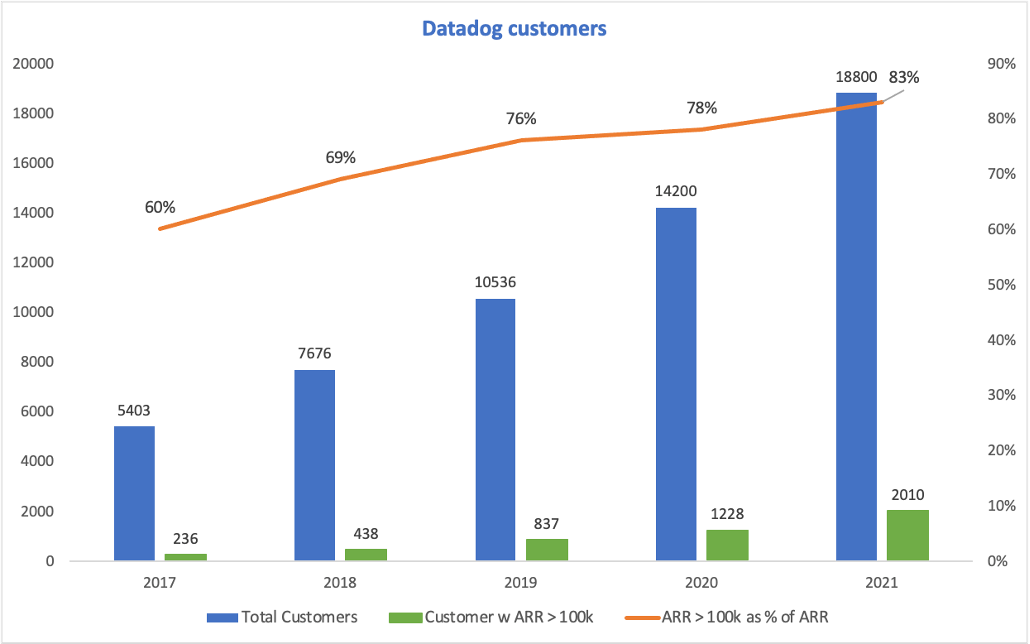
The company grew its customer base very fast during the last couple of years. More importantly, the company has done a great job of attracting new customers with more than $100k in (ARR). At the end of 2021, Datadog had more than 2000 customers, growing 64% as compared to 2020. Moreover, we can observe the concentration around the big customers since this cohort represents around 83% of Datadog’s (ARR).
Datadog employs a land-and-expand market strategy centered around offering products that are easy to adopt and have a very short time to value. Then, customers can expand their footprint on a self-service basis. Its go-to-market strategy, in conjunction with its ability to consistently come up with new products, offers its customers numerous opportunities to upsell. As a result, at the end of 1Q22, 81% of Datadog’s customers were using 2+ products, while 35% were using 4+ products. This proves a high (ROI) on its R&D investments as the platform expands and creates new complementary offerings:
Datadog Investor Presentation, May 2022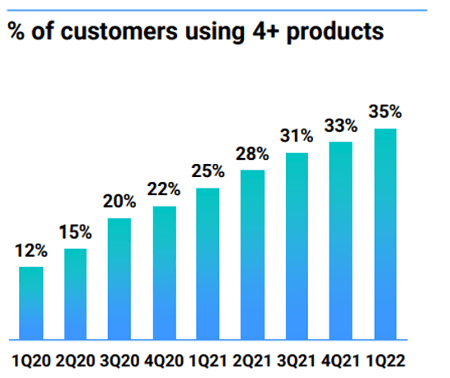
As a result, the company had an incredible 130%+ Net dollar retention rate for the last 19 consecutive quarters. This represents the (ARR) from the same set of customers in one period, relative to the year-ago period.
Customer Acquisition Cost (CAC)
This metric shows how well the company is using its sales & marketing team. It’s important to analyze sales efficiency to ensure that growth is efficient and sustainable. The formula that I used is:
(CAC) = S&M Expenses period n-1 / Nr of new customers in the current period
Datadog 10-K 2021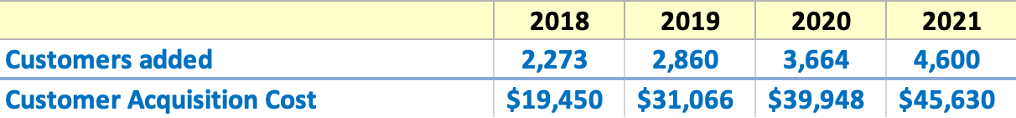
CAC payback period
This shows how many years it takes on average for a customer to produce enough gross profit to pay back its (CAC). It incorporates the S&M expense per customer, the revenue gained from the customer but also the gross margin of the company:
(CAC) payback period = Average S&M Expense per customer / Average revenue per customer x Gross margin
Datadog 10-K 2021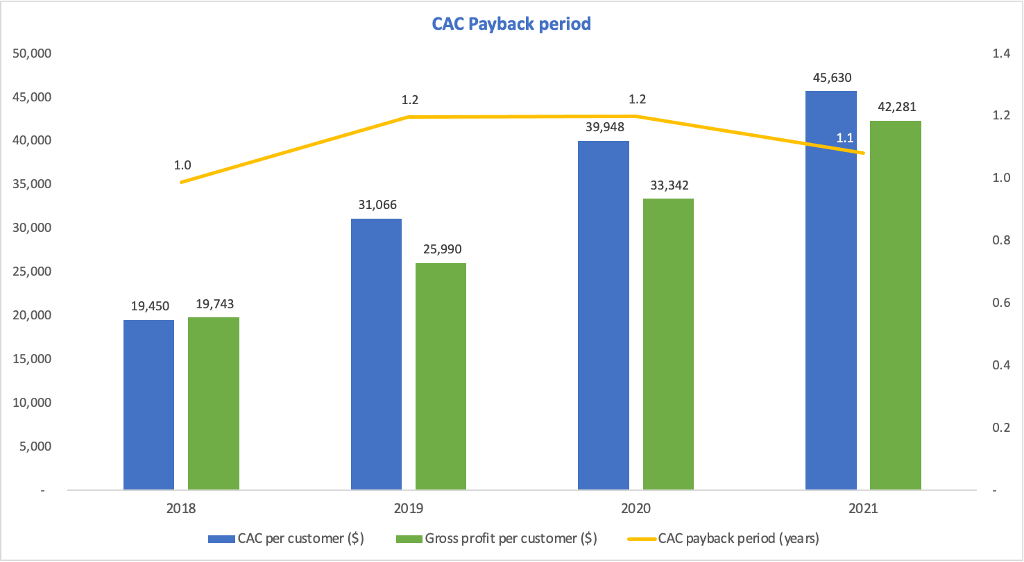
The gap between the (CAC) and gross margin per customer has decreased and now the company has a (CAC) payback period of around 1.1 years (~ 13 months), which is a small improvement from 2020. This is an encouraging sign, especially considering that the average SaaS company has a (CAC) payback period above 12 months, as we can see from the work of Jamin Ball:
Jamin Ball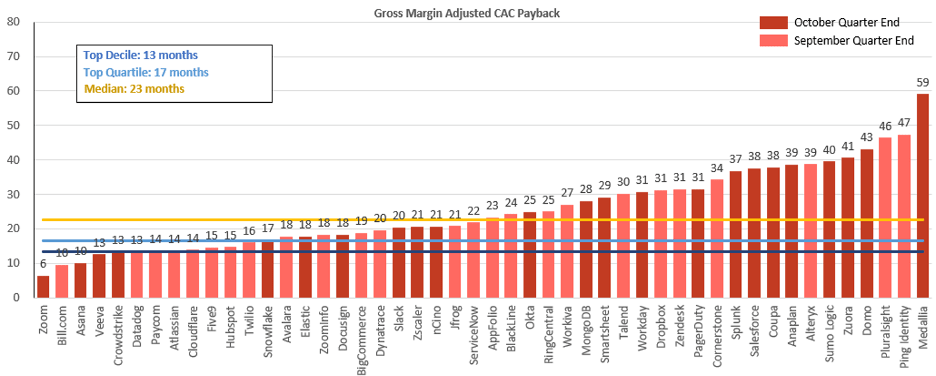
Financials
DataDog has been one of the few companies that has consistently delivered on its guidance. It crushed revenue and earnings expectations pretty much every single quarter since it got listed:
SeekingAlpha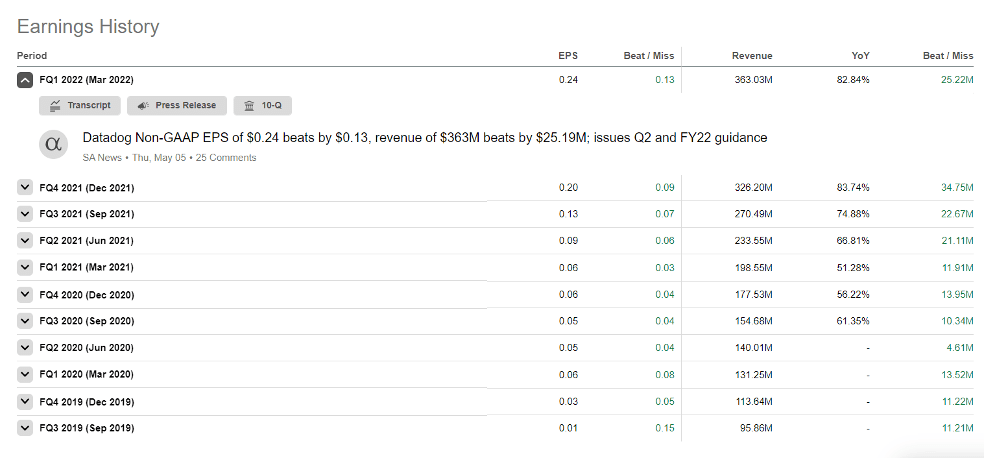
Moreover, Datadog also raised its guidance for revenue and earnings in Q1 of 2022 and despite economic uncertainty, the company shows no signs of slowdown. This proves that management has tremendous confidence in the demand for Datadog’s products:
“Our strategic focus remains to invest aggressively in R&D and go-to-market to optimize for long-term growth. In Q1, we are pleased to have had our best-ever quarter of hiring, and we plan to continue hiring aggressively throughout 2022.” – Datadog’s (CFO), May 2022
SeekingAlpha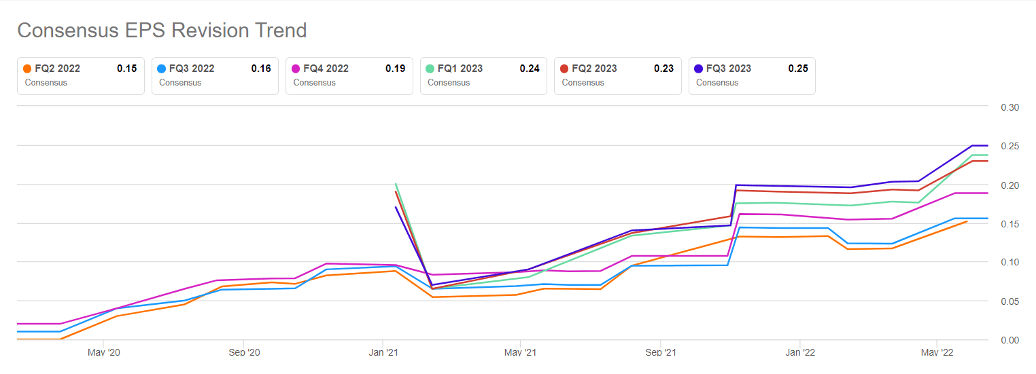
As a result of management’s confidence in the underlying business for 2022 and onwards, estimates for earnings per share have been adjusted accordingly. Although the risk for an economic recession is elevated and historical performance doesn’t guarantee future performance, I believe that management proved its ability to execute and deliver on their estimates. Moreover, management owns a big piece of the company, around 9.5%, which shows that management’s objectives are aligned with the shareholders’ best interests:
Yahoo Finance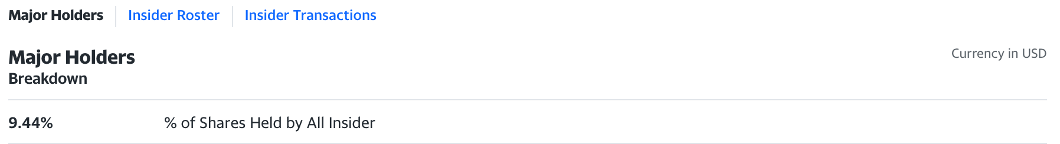
Balance Sheet
Datadog has a strong balance sheet: at the end of 2021 it had around $1.5 billion in cash & equivalents, around $735 million in debt, while the number of outstanding shares has only increased 6% since 2019, when the company got listed:
SeekingAlpha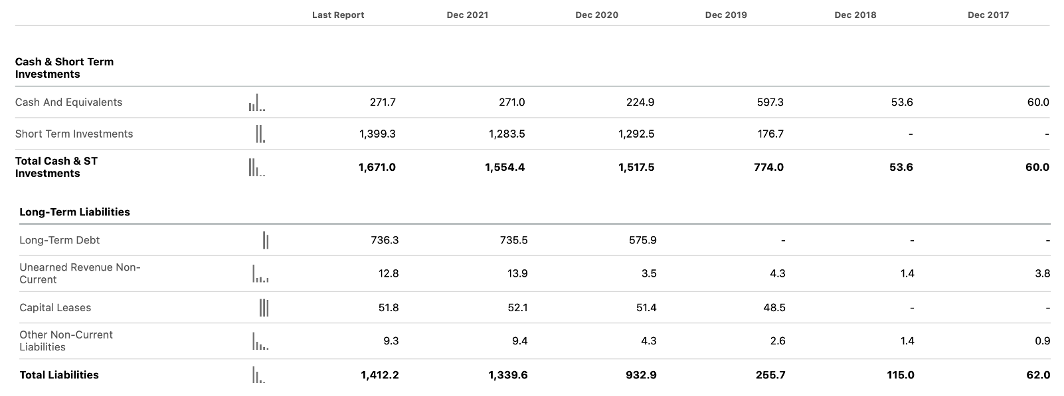
Income Statement
SeekingAlpha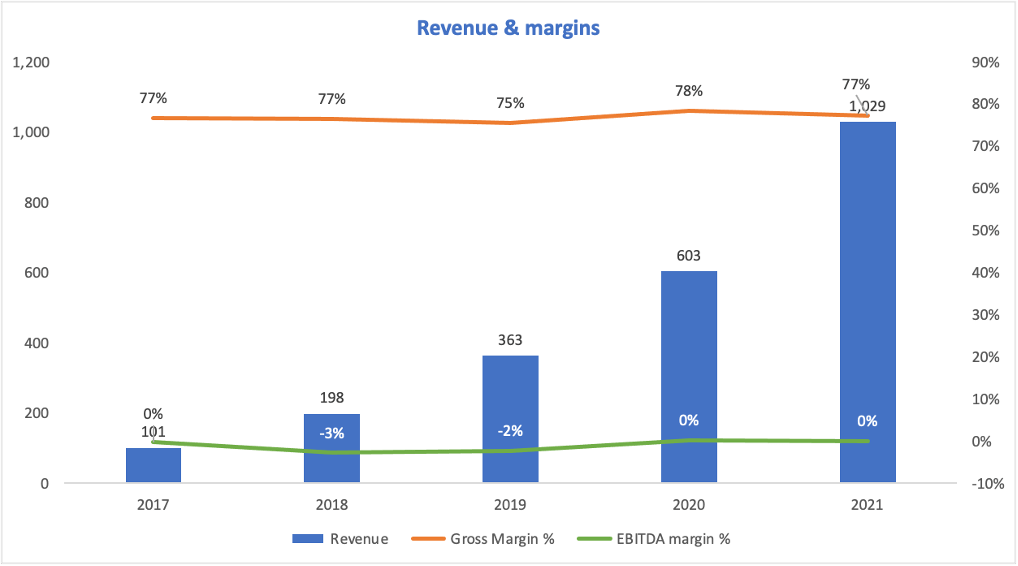
Datadog grew it revenue tremendously during the last couple of years, with its gross margin remaining relatively constant, around 77%, while EBITDA came in around breakeven in the last 2 years. The fact that Datadog grows so fast without accumulating big losses is a major plus and it all comes from the operational expenses that are very well managed by the company. Here’s how the (OPEX) look like as % of revenue:
SeekingAlpha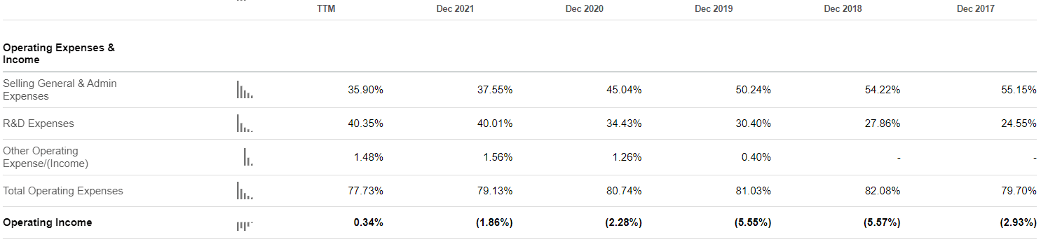
An encouraging trend that started with 2021 is that R&D as % of revenue surpassed the S&A plus G&A as % of revenue. Moreover, R&D grew as % of revenue, surpassing 40% for the first time ever. This shows a commitment to invest in new products and create opportunities to upsell its existing customers, which is exactly what I want to see from a company that innovates and tries to be at the forefront of its industry.
Moreover, the S&M spending isn’t out of control and has actually decreased as % of revenue, which is a rare occurrence for a software company growing so fast.
Cash flow
As I’ve highlighted before, Datadog’s cash flow statement is a big plus for the company. It consistently shown positive operating cash flow. Moreover, even when expensing the (SBC), the operating cash flow remains positive:
SeekingAlpha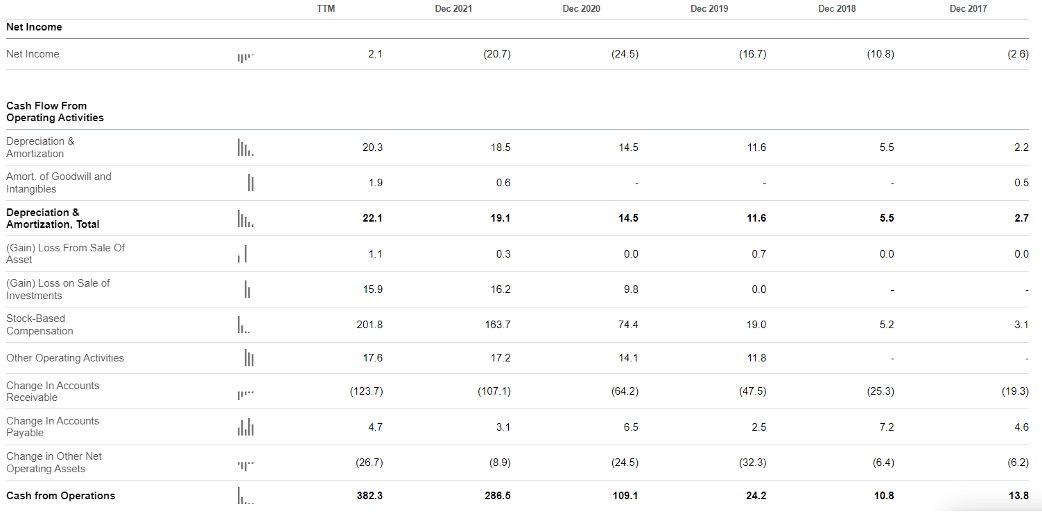
The only downside that I can see for the CF statement is the Accounts receivables balance. It has consistently grown, and it might show difficulties in collecting payments from its customers. In order to find out if that’s a real concern, let’s look at the Days Sales Outstanding (DSO), which represents the average number of days it takes credit sales to be converted into cash or how long it takes a company to collect its account receivables. It is defined as:
Days Sales Outstanding = (Average Accounts receivables / Revenue) * 365
SeekingAlpha
(DSO) has consistently been around 80 days, while in 2021, in spite of the growth in the Accounts Receivables balance it has improved to around 77 days. As a result, this is not a concern for the cash-flow statement of the company. Lastly, the very low amount of (CAPEX) needed for the growth of the business is yet another plus for Datadog:
SeekingAlpha
Valuation
If we open the Valuation tab here on Seeking Alpha, that thing looks awful. Starting with a high Price/Sales and gigantic Price/Earnings, pretty much every metric shows that the company is ridiculously overvalued:
SeekingAlpha
Moreover, when we compare the best high growing software companies, Datadog is one of the most expensive stocks when considering metrics like Enterprise Value / 2022 Gross Profit. I’m focusing on this metric since it incorporates the operating leverage that a high gross margin company has created. Additionally, Enterprise Value is a better metric to use than Market Capitalization since it also takes into account debt and cash. Here’s how the SaaS high growers are valued:
TIKR.com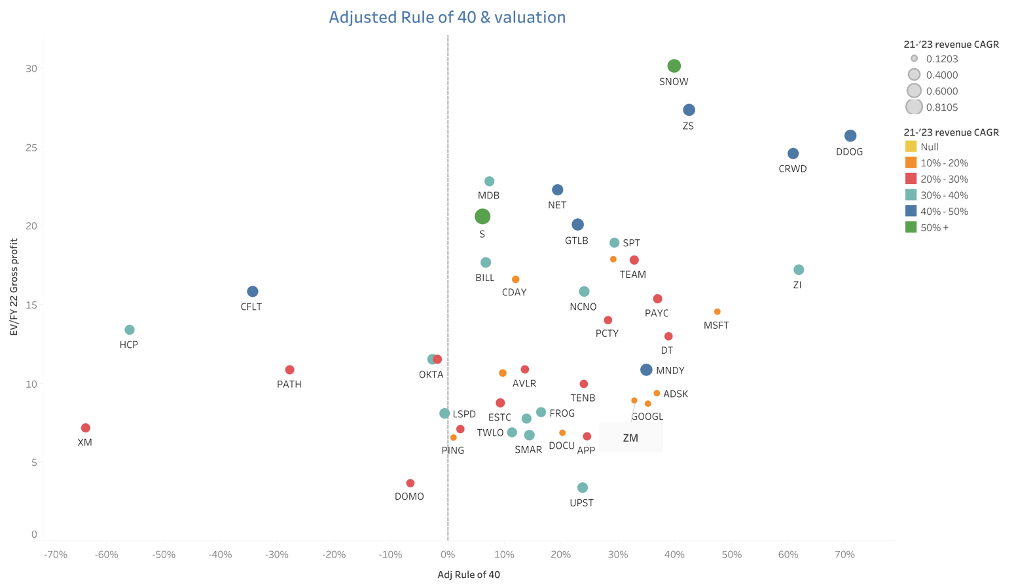
Datadog is the 3rd most expensive company from this data set (26X), while the median multiple for this data set is around 11.5X. However, the company has one of the biggest 2021-2023 revenue (CAGR), sitting around 47%.
Datadog is expensive. No doubt about it. But giving that Datadog is a leader in terms of revenue growth and ability to generate free cash flow, I believe that the company will always trade at a premium to the software median, especially as long as the company continues to execute and deliver on its guidance. The management shown a trend of consistently delivering on their estimates, which instills confidence for potential investors.
When considering historical valuation, Datadog’s stock is as cheap as it has ever been, sitting around 18X EV/Revenue, in the ballpark of its March 2020 multiple, decreasing from a high of more than 50X EV/Revenue:
TIKR.com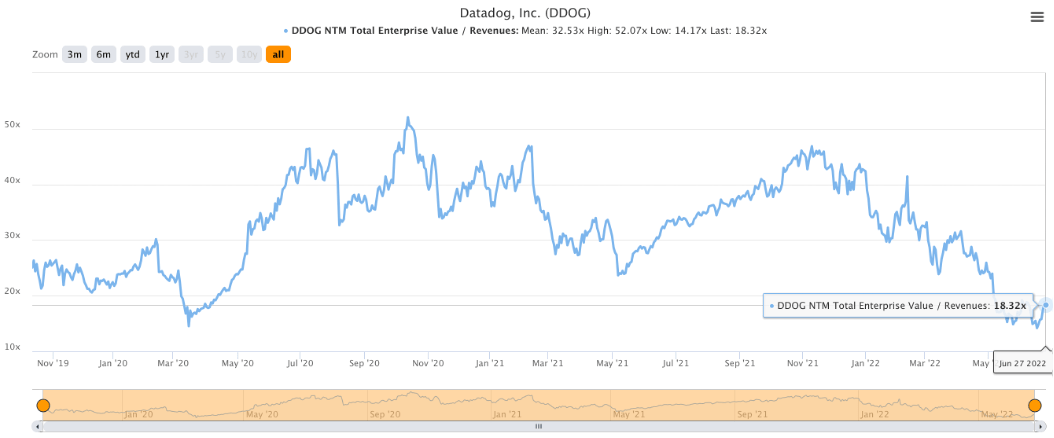
Short stock
Ideally, I want to pick a slowly downgrading company. I don’t want a stock so beaten up that it sits now below $5 and can swing wildly between $1 and $5. Firstly, I need to decide which industry I want to short. Generally, I try to pick a pair of stocks from the same industry, as a way of eliminating the industry-specific risk. Let’s imagine I’m long a software company and short an EV stock, my returns could suffer in the case of EV-specific news that will lift all the EV stocks. But picking both stocks from the same industry removes, at least partially, this unsystematic risk.
This is the most difficult part for me since I am a permabull. I don’t generally look for shorting opportunities since there are so many stocks that offer outsized returns by going long. Still, here are some characteristics that I want to see for a short pick, starting with the fundamentals: slow revenue growth anticipated, low-margin business – I really don’t want to short a company with 80% gross margin (perhaps only if it decreased from 90%) since this translates into significant operating leverage, high S&M spending (especially without growing revenue fast; this shows that its sales team’s efforts don’t provide a good (ROI)), high G&A spending – a sustained trend is even better, negative free cash-flow or decreasing earnings per share, if positive. I probably won’t find a company that has all these, but I’ll do my best.
Next let’s turn to the technical analysis. This is an important filter that will tell me if the declining company has also a declining stock. Remember, for a high growing company (yearly revenue CAGR > 30%), many of the things that I’ve listed above are common. In terms of technical analysis, I’m looking for:
- Low beta – Ideally < 1, but it can also be around 1; this lowers the chances that the stock will grow significantly once the market turns bullish
- A bear trend on the weekly chart
- Above $5 – I don’t want to play this game with a penny stock
Now that I’ve highlighted what I’m looking for, let’s see why I’ve chosen to short IBM:
Revenue
IBM has multiple revenue streams. The one that competes directly with Datadog is in the enterprise observability and APM space after IBM bought Instana at the end of 2020. This fits into IBM’s software segment, which also includes solutions like: switching from legacy to cloud architecture, creating data-driven business insights, automatization of end-to-end processes across IT and business environments and keeping the applications and data secure.
IBM 2021 Annual report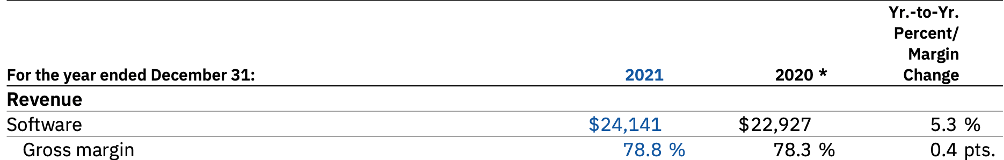
IBM grew its Software revenue 5.3% in 2021, while the gross margin for this segment is the highest from all the business segments, around 79%. Moreover, the Software segment is the biggest by revenue, with around 42% of IBM’s total revenue. Moreover, most of the growth came from the Red Hat solution, which is the leading hybrid cloud software platform, and the only one that is fully integrated and open source:
IBM 2021 Annual report
Fundamentally, IBM fits the pattern. It’s an old, established company that couldn’t surprise the market much in terms of growth and innovation. The stock has a 24 months beta of around 0.57, which is ideal for the scope of my investment. Moreover, its forward revenue growth is actually negative as the company is expected to have revenue below its 2021 numbers for the next two years:
SeekingAlpha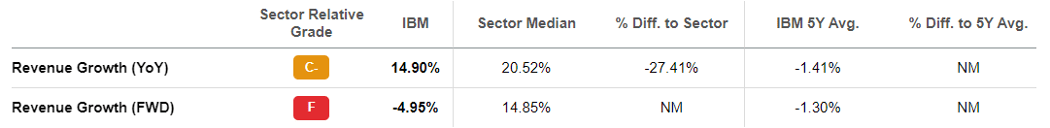
Gross margin is around 55%, which shows some operating leverage, but it’s way lower than the 80% that a software company usually has:
SeekingAlpha
Regarding operational costs, the company has a cumulative S&M and G&A costs of around 34.5% of revenue at the end of 2021. These have been elevated during the last 3 years compared to the historical trend, which shows that IBM didn’t manage to sustain its operational leverage during the last financial years:
SeekingAlpha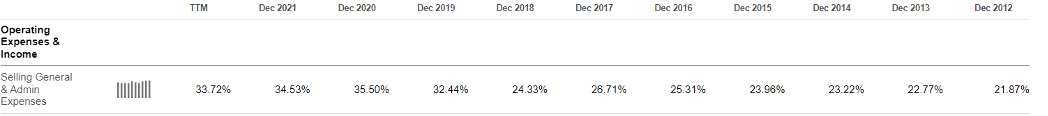
Moreover, if we look at the earnings per share estimates, IBM shows the opposite trend as compared to Datadog. Their earnings forecast has been adjusted on the downside, which shows that the business might have a rough patch in the next couple of quarters:
SeekingAlpha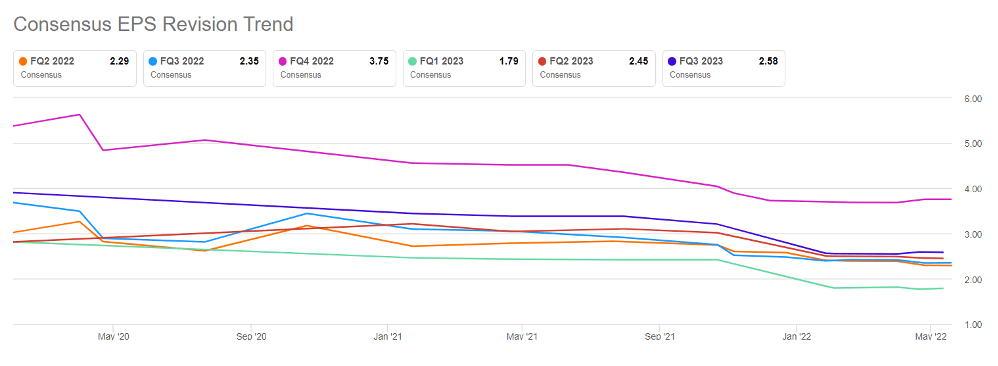
In terms of cash-flow, the company has an extraordinary ability to generate cash. Using the same formula from above, where we expense the (SBC), (FCF) sits around $9.75 billion at the end of 2021, while the (FCF) margin is ~ 17%. Moreover, IBM has a strong cash position that will provide the company liquidity in case of unexpected economy turbulences:
SeekingAlpha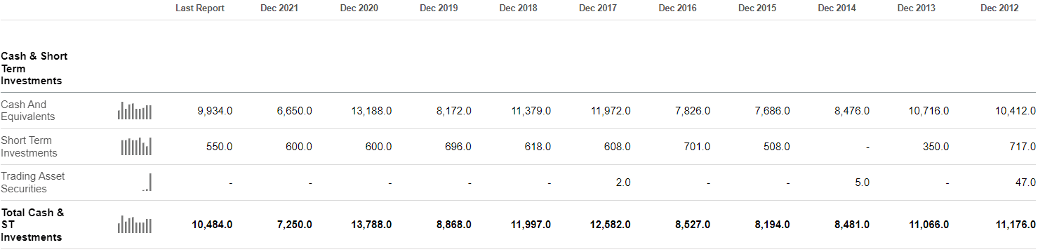
One thing that is worth noting for IBM is the $45 billion that the company has in debt. This is above the company’s average debt balance, and it might be concerning in the current interest rates environment, especially since the company has historically used debt as a way of financing:
SeekingAlpha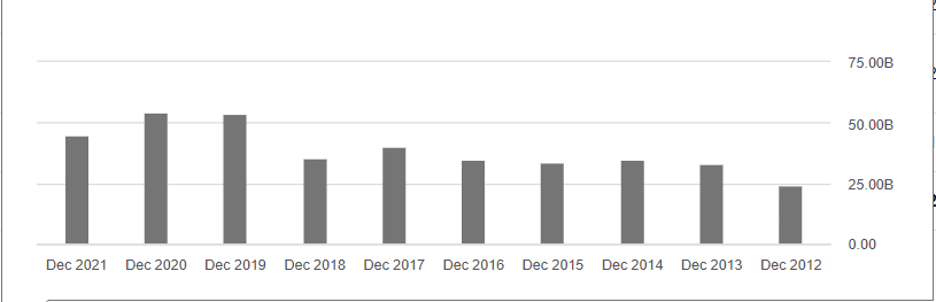
To conclude the fundamental analysis of IBM, I’m not banking on the fact that IBM will crumble. It has enough cash on its balance to keep its operations going and it has already reached a mature stage that makes it easier to optimize costs in case of a recession. My bet is that the company’s better days are behind it and there is no transformative growth in sight for the next couple of years.
Valuation
SeekingAlpha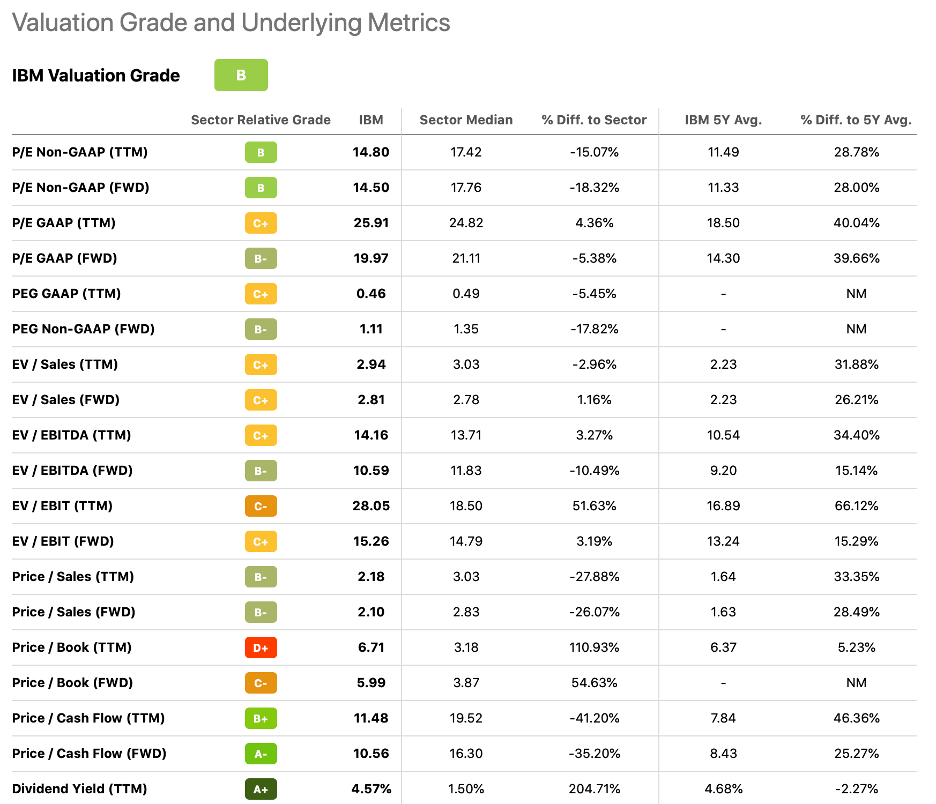
IBM has a high valuation grade, which might be misleading in my opinion. The company seems to have both P/E and Price / Cash Flow lower than the sector median. This implies that the stock is “cheap”, but that’s not always a positive. In this case, the stock is cheap because as I’ve highlighted before, most of its growth is in the past. Moreover, having a dividend yield much bigger than the sector shows that IBM can’t find as many investment opportunities that can offer a high (ROI). As a result, the company prefers to just pay back its shareholders.
Technical Analysis
I don’t own Datadog yet. But it’s not because of the company, but because of the economy and the fact that the stock didn’t reach my target. I see $74 as a really strong support during the last 2 years, so that’s obviously where I want to open a position. Considering the recent drawback in all assets, not buying Datadog has been a real test of patience, but I do believe that the price will hit that $74 level sooner rather than later, depending on the broad economy:
Tradingview.com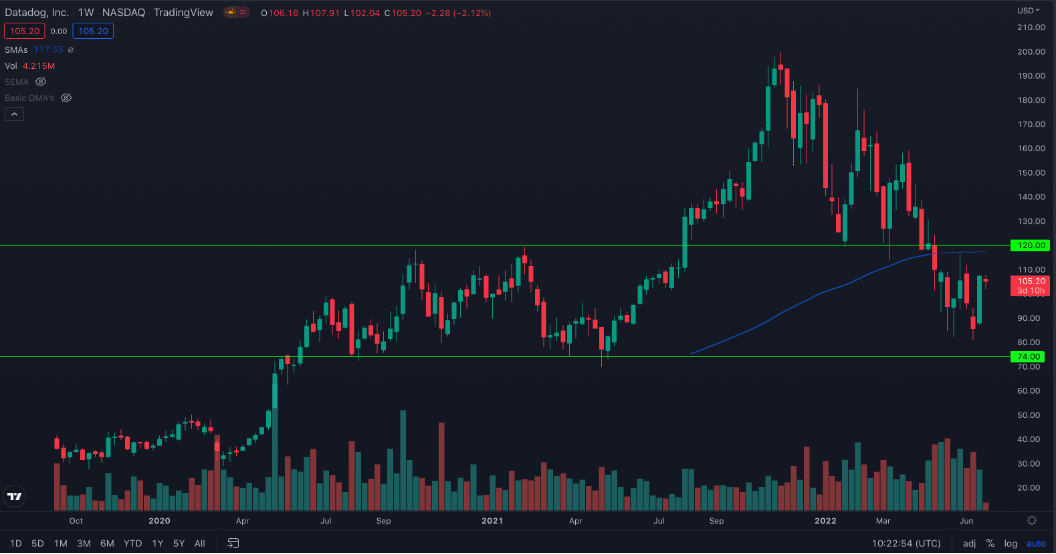
On the other hand, the more convincing reason for which IBM is a good short is the technical side. Let’s look at the weekly chart for IBM’s stock:
Tradingview.com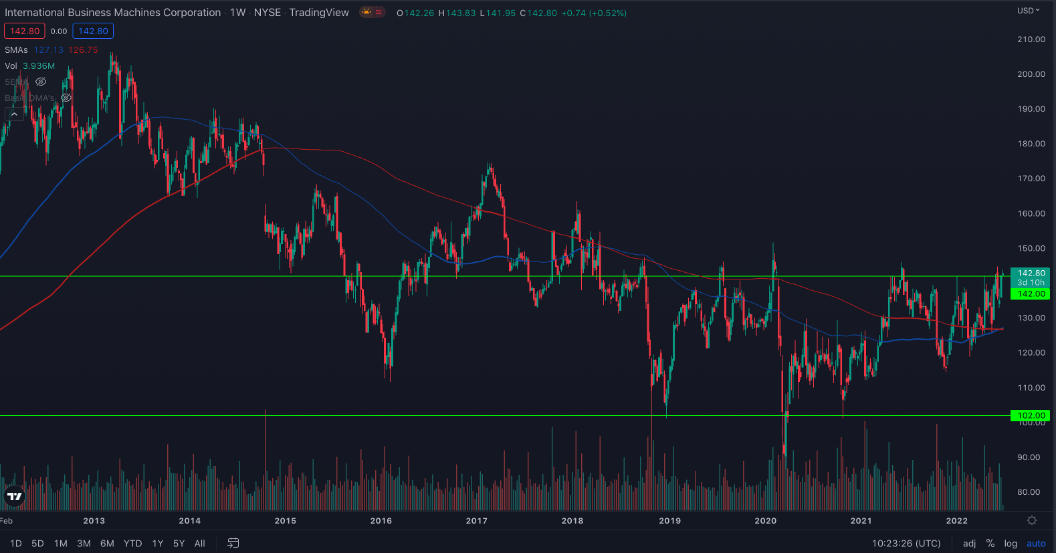
Firstly, the trend is obviously bearish. Moreover, the company has been in a consolidation stage since the end of 2018, when it dropped below $142. This level represents a very strong resistance, that rejected the price action on several occasions. On the other hand, we have the $102 support that has also been hit several times. IBM stock did absolutely nothing during the last 3 and a half years. I know what a trader might think: the bigger the consolidation area, the stronger the breakout. But I do not think this will be the case unless IBM will have a significant breakthrough from an operational perspective.
Even when using the adjusted for dividends price, the stock still didn’t go anywhere for the last couple of years, as the range between its support ($102) and resistance ($142) has a span of only $40.
Tradingview.com
Risk
Considering we are currently in the middle of a multiples’ compression, there is no way to anticipate how much more the software multiples will decrease. For now, this is an important element for all software stocks. Secondly, I believe that my spread will create beta only if the economy doesn’t go into a recession in the next couple of quarters. If that would be the case, my long stock will be much more impacted than my short one and the spread will offer negative returns.
However, in the scenario where the economy doesn’t crumble, Datadog stock might not offer the expected return because of a couple of reasons: investments in the company’s expansion aren’t as successful as expected, Datadog fails to expand beyond the US, its execution isn’t as good as it was in the past, the R&D investments don’t provide a good (ROI), which leads to less new products and less upselling opportunities or the company’s go-to-market strategy is not as successful as the management anticipated.
Another important risk is that IBM stock will behave better than I anticipated. The reason might be either fundamental (IBM makes operational breakthroughs after aggressive investments and reignites its growth) or technical (stock breaks out its consolidation phase and the stock rallies). Still, since IBM has a low beta, I believe that the most significant risk is that Datadog underperforms. For IBM I’m only betting on the fact that the company won’t provide outsized returns as compared to Datadog.
Final thoughts
This pair of stocks will offer outsized returns only if the overall market will regain its bull trend. My long pick carries a high degree of volatility and there’s a high chance that the multiples compression isn’t done. As a consequence, I expect Datadog stock to have more downside on the short-term, which will offer investors the opportunity for a better entry, so please be aware of these unprecedented market conditions before investing.
Be the first to comment