

M. Suhail/iStock Editorial via Getty Images
It was a tough Q1 earnings season for the market, and especially for the restaurant industry group. This is because casual dining names have had to deal with team member exclusions due to Omicron, and they’ve had to combat commodity and wage inflation. Increases in menu pricing have helped offset soft traffic trends, but there’s now a delicate balance between protecting margins and potentially pricing some guests out of casual dining. Although Darden (NYSE:DRI) has iconic brands and generous shareholder returns, the casual dining space could continue to suffer, suggesting investors shouldn’t rush to buy the dip just yet on Darden.
Darden Menu (Company Website)
Just over seven months ago, I wrote on Darden, noting that there was no reason to chase the stock above $156.00, with no margin of safety baked into the stock. This caution was also warranted from a technical standpoint, with the exuberance around the re-opening of restaurants pushing the stock to its upper channel line, marking only its fifth test of that level in the past two decades. Since then, the stock has slid more than 27%, attributed to general market weakness and continued margin pressure for full-service names. Let’s take a closer look below:
Q3 2022 Results
Darden released its fiscal Q3 2022 results (calendar year Q1 results) in March, reporting revenue of $2.45 billion, a 41% increase from the year-ago period. This was driven by solid same-restaurant sales across its segments, evidenced by 38.1% same-restaurant sales on a consolidated basis. This was led by Fine Dining at 85.8% growth, its Other business (Cheddar’s, Yard House, Seasons, Bahama Breeze) at 55.2%, trailed by LongHorn Steakhouse and Olive Garden at 31.6% and 29.9%, respectively. Given the challenging operating environment (December through February) due to Omicron, which resulted in some team member exclusions, this represented solid sales performance.
Darden – Quarterly Revenue (Company Filings, Author’s Chart)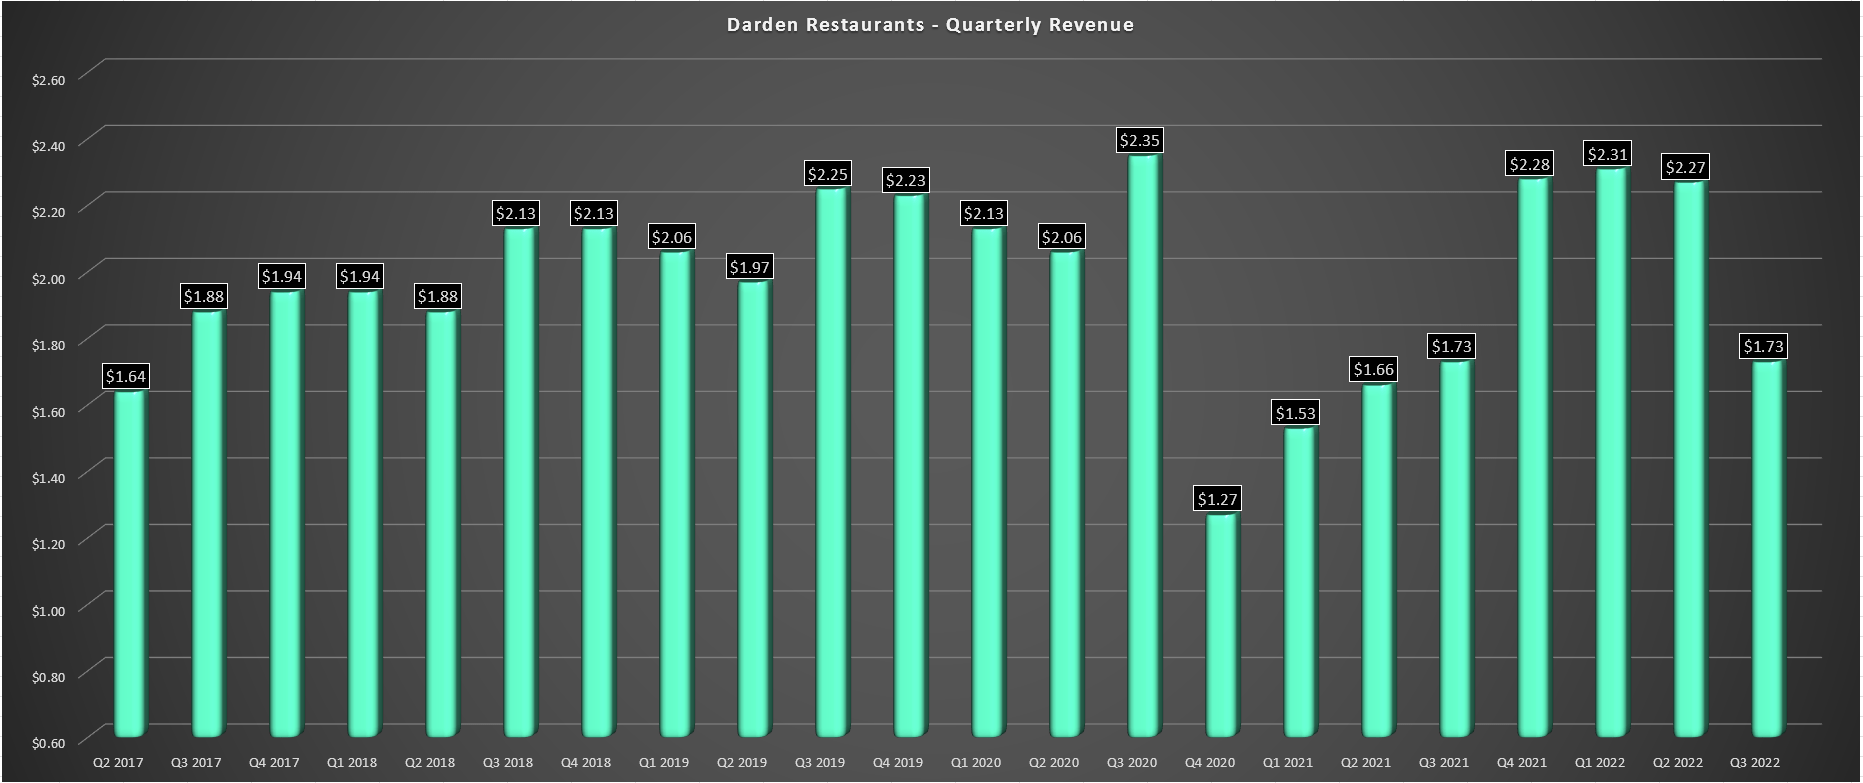
If we look at segment sales below, we can see that while sales performed well for the most part vs. pre-COVID-19 levels (December 2019 to February 2020). This was helped by menu pricing, which has continued to increase, and not traffic. This is not company specific, except for a couple of names seeing positive traffic like First Watch (FWRG). However, while some investors might be bullish on casual dining and sales performance now that we’re past the Omicron spike, which disrupted staffing and traffic, there’s potentially a bigger headwind rearing its ugly head: Rapidly-rising gas prices.
Darden – Fiscal Q3 Sales & Margins (Company Presentation)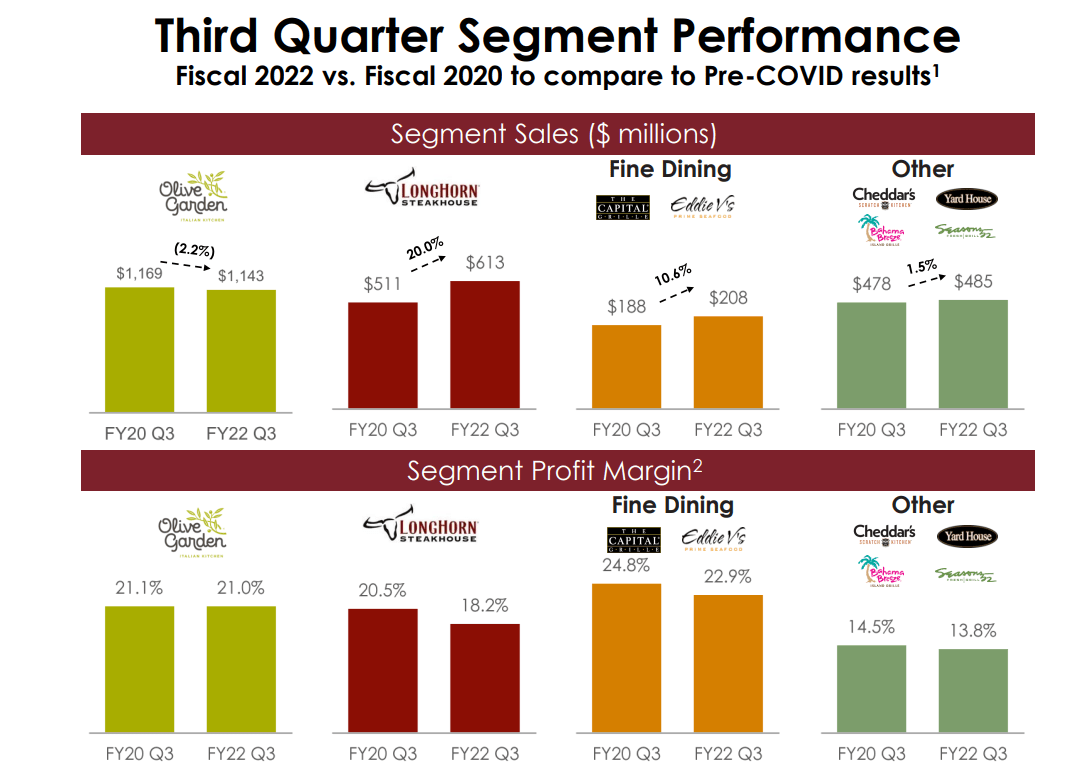
With the gas price currently sitting near $5.00/gallon in the United States, this could put a further dent in industry-wide traffic, and this appeared to be the case in April, with traffic down 2.7%, according to Black Box Intelligence. The good news is that fine dining was one of the top performers in April, which could benefit Capital Grille and Eddie V’s. However, this segment makes up less than 10% of sales, and while April traffic might have held up, I would be surprised if we saw the same in June, July, and August, especially if gas prices stay near $5.00/gallon.
Gasoline Prices United States (Statista.com)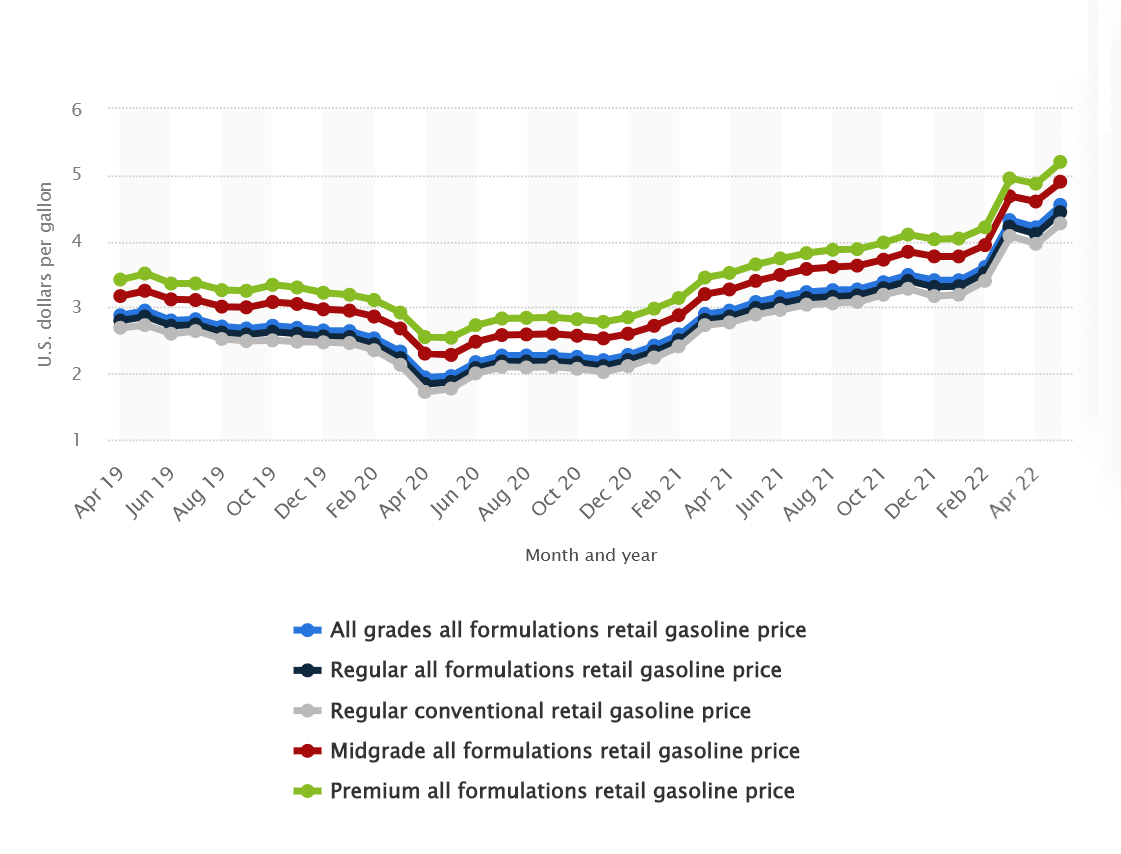
Given this backdrop of elevated inflation (8.6% CPI) and high gas prices, the more important quarter to watch will be fiscal Q1 2023, which will see the full headwind of ~$5.00/gallon gas prices, that will dent available disposable income. This could lead to fewer dining occasions and or some check management. As the margin performance chart shows above from fiscal Q3 2022, margins were already down across the board in all segments ahead of continued wage inflation post-February. So, while it’s encouraging to see Darden making productivity gains and performing well in a difficult environment, it’s hard to be bullish on casual dining as a whole.
Industry Headwinds
Looking at the chart below, we can see that wholesale food prices are sitting at multi-decade highs and increased 3.1% sequentially in April (17.8% year-over-year). This has led to meaningful cost inflation on the commodity side for restaurant brands, with Darden reporting total inflation of 7% in fiscal Q3 2022, above its expectations. While the company will be able to offset some of this through pricing, which will be just over 3% for FY2022, it’s still losing ground to inflation which could come in above 6% for the year. Darden noted that food and beverage expenses were up 270 basis points, though this looked worse than it should have due to a lack of sales leverage related to Omicron.
Wholesale Food Prices (National Restaurant Association, BLS)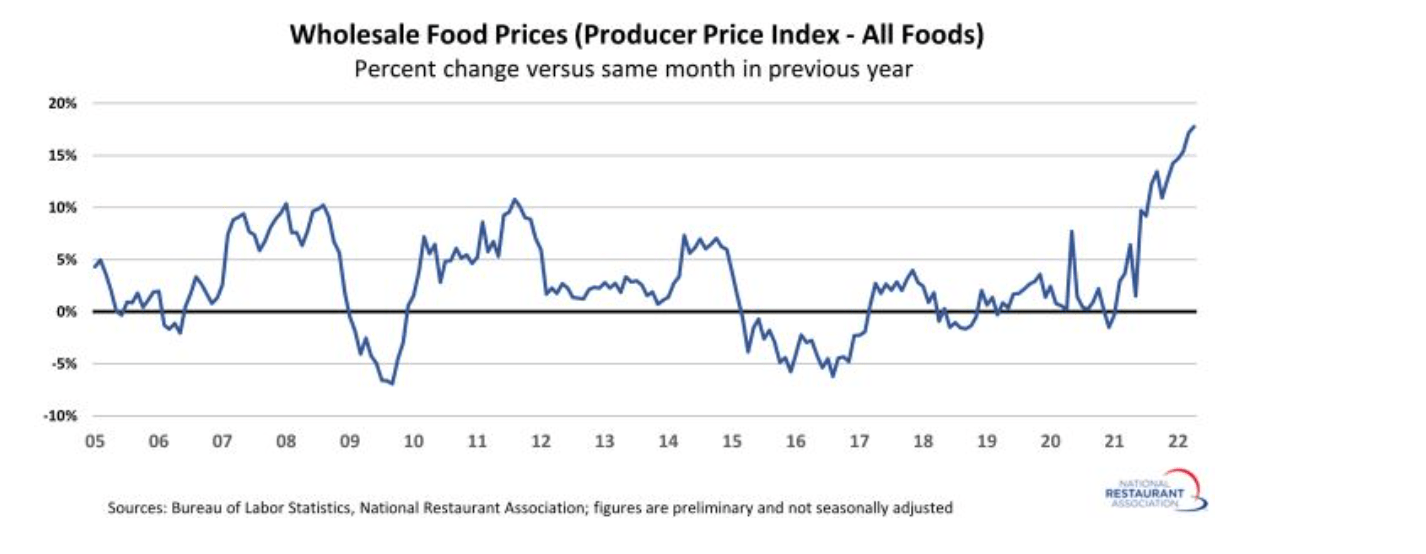
From a labor standpoint, Darden noted that it’s sitting at over 95% of pre-COVID-19 staffing levels, which appears to be enough to get by due to productivity improvements, and the company noted that it feels much better than where it sat last year from a labor standpoint. In addition, with a base of $12.00 an hour with a top-up from tips, Darden is an attractive option compared to some of its peers in quick-service/fast-casual, which may have a higher base, but don’t benefit from tips. For this reason, staffing shouldn’t be an issue for Darden, but this hasn’t shielded the company from wage inflation (~9%), which is also tracking well above its annual pricing.
Monthly Changes In Restaurant Employment (BLS, National Restaurant Association)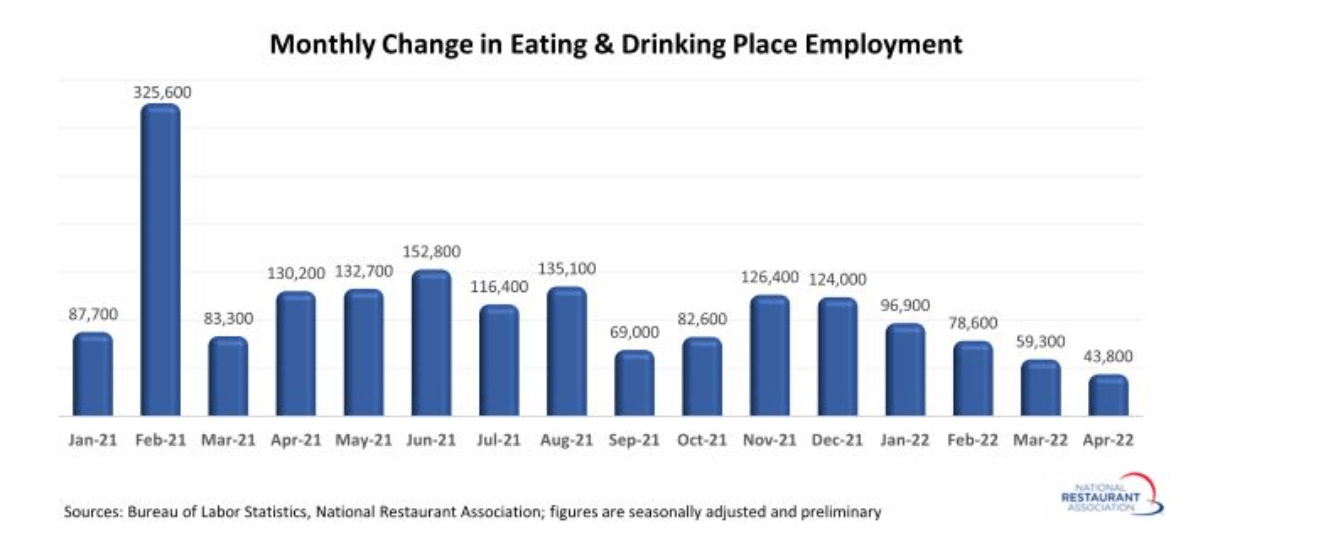
Looking at the chart above, we can see that despite savings rates depleting from lockdown levels, the restaurant space has not seen much of an influx of new jobs, with the industry still almost 800,000 jobs (~6.4%) below pre-pandemic levels. This is a headwind for the industry as a whole, and it’s possible that many workers are not anxious to return, with several brands laying off workers during the pandemic. If this trend were to change, this would be a good sign, but given that there’s no sign of this yet, the outlook for wage inflation in the industry doesn’t look great.
While restaurant-level EBITDA margins have held up quite well given the headwinds, it’s important to note that Darden’s marketing spend continues to be well below pre-COVID-19 levels, providing a 190 basis point lift in fiscal Q3 2022. This means that excluding this significant decline in marketing dollars ($27.2 million vs. $71.4 million), restaurant-level EBITDA margins would have been down more than 200 basis points. For now, the company continues to put up impressive sales performance considering the lower spending. Still, if consumer spending slows, this could be a slight headwind to margins going forward.
Darden – Quarterly Marketing Expenses (Company Filings, Author’s Chart) American Consumer Satisfaction Index (TheACSI.Org)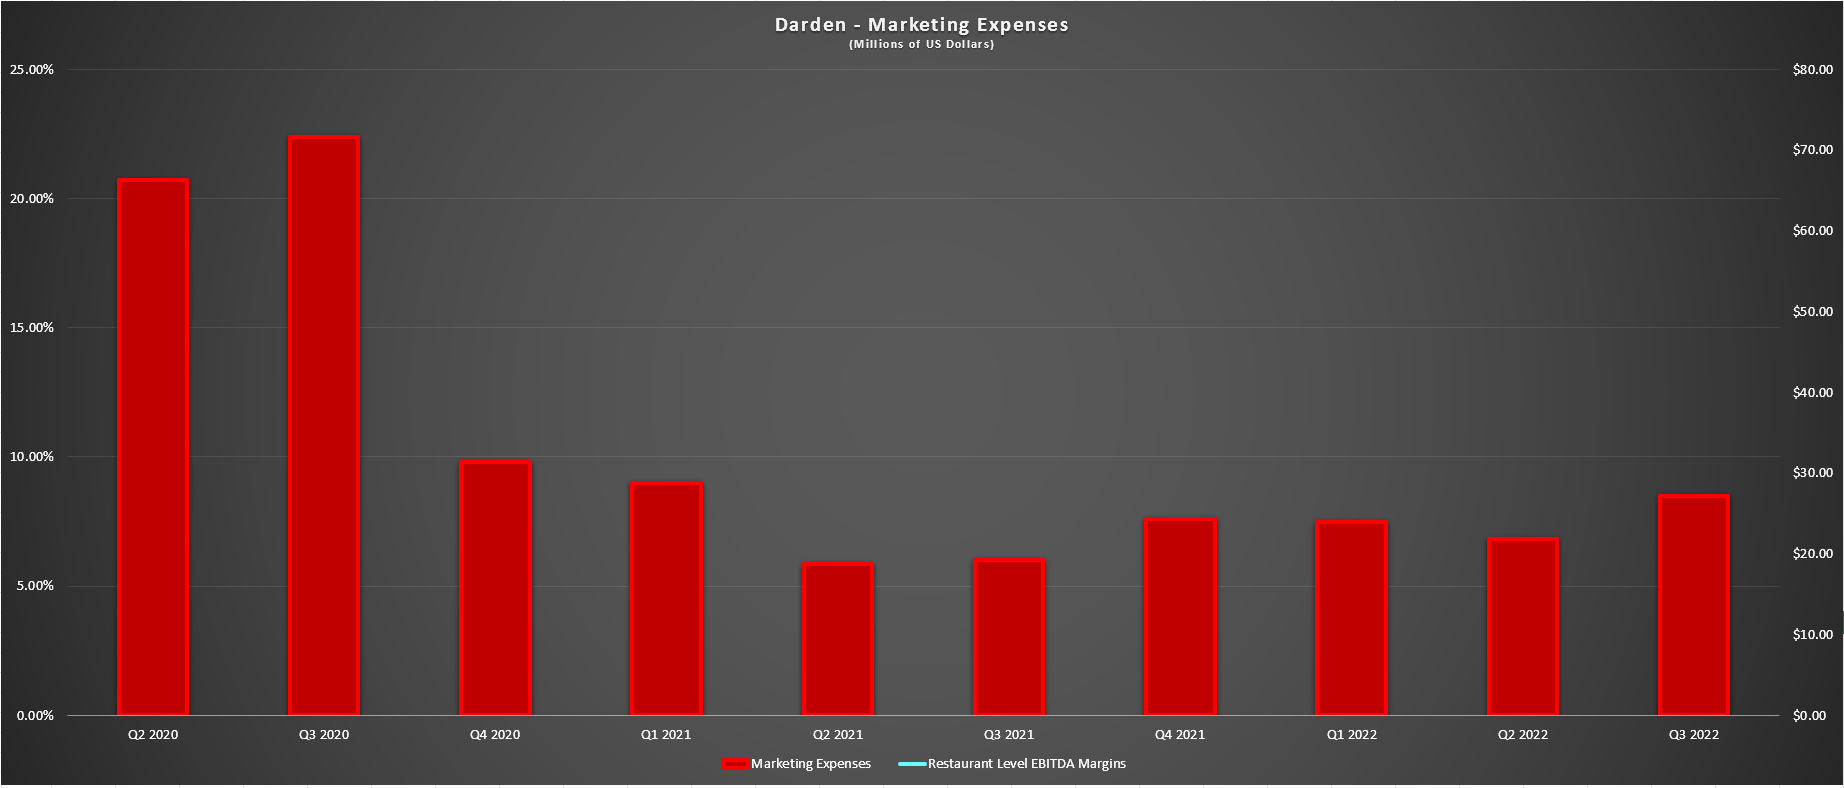

Fortunately for Darden, the company has strong customer satisfaction, and it appears to be diverging positively from the American consumer satisfaction index, suggesting that customers continue to see a great value proposition when dining at its restaurant brands. This could be related to its decision to be less aggressive with pricing than other brands and pricing below inflation. While this is encouraging, the real test will be fiscal Q4 2022 and fiscal Q1 2023 results, where we could see an average gas price above $4.80/gallon. If this is the case, I would be surprised if we don’t see further erosion in traffic industry-wide and possibly some check management, providing reduced sales leverage to continue holding the line on margins.
Valuation
Based on ~125 million shares outstanding and a share price of $115.00, Darden has a market cap of ~$14.4 billion and an enterprise value of ~$19.5 million. As the chart below shows, the stock has historically traded at ~10.5x EBITDA (10-year average) and briefly touched 17x EBITDA last year, where the stock was way ahead of itself given the rush back into restaurants as they lapped easy year-over-year comps. If we compare this to its current EBITDA multiple (FY2023 estimates: $13.20 / ~$1.65 billion), Darden is trading 15% below its 10-year average EBITDA multiple.
Darden – Historical EBITDA Multiple (FASTGraphs.com)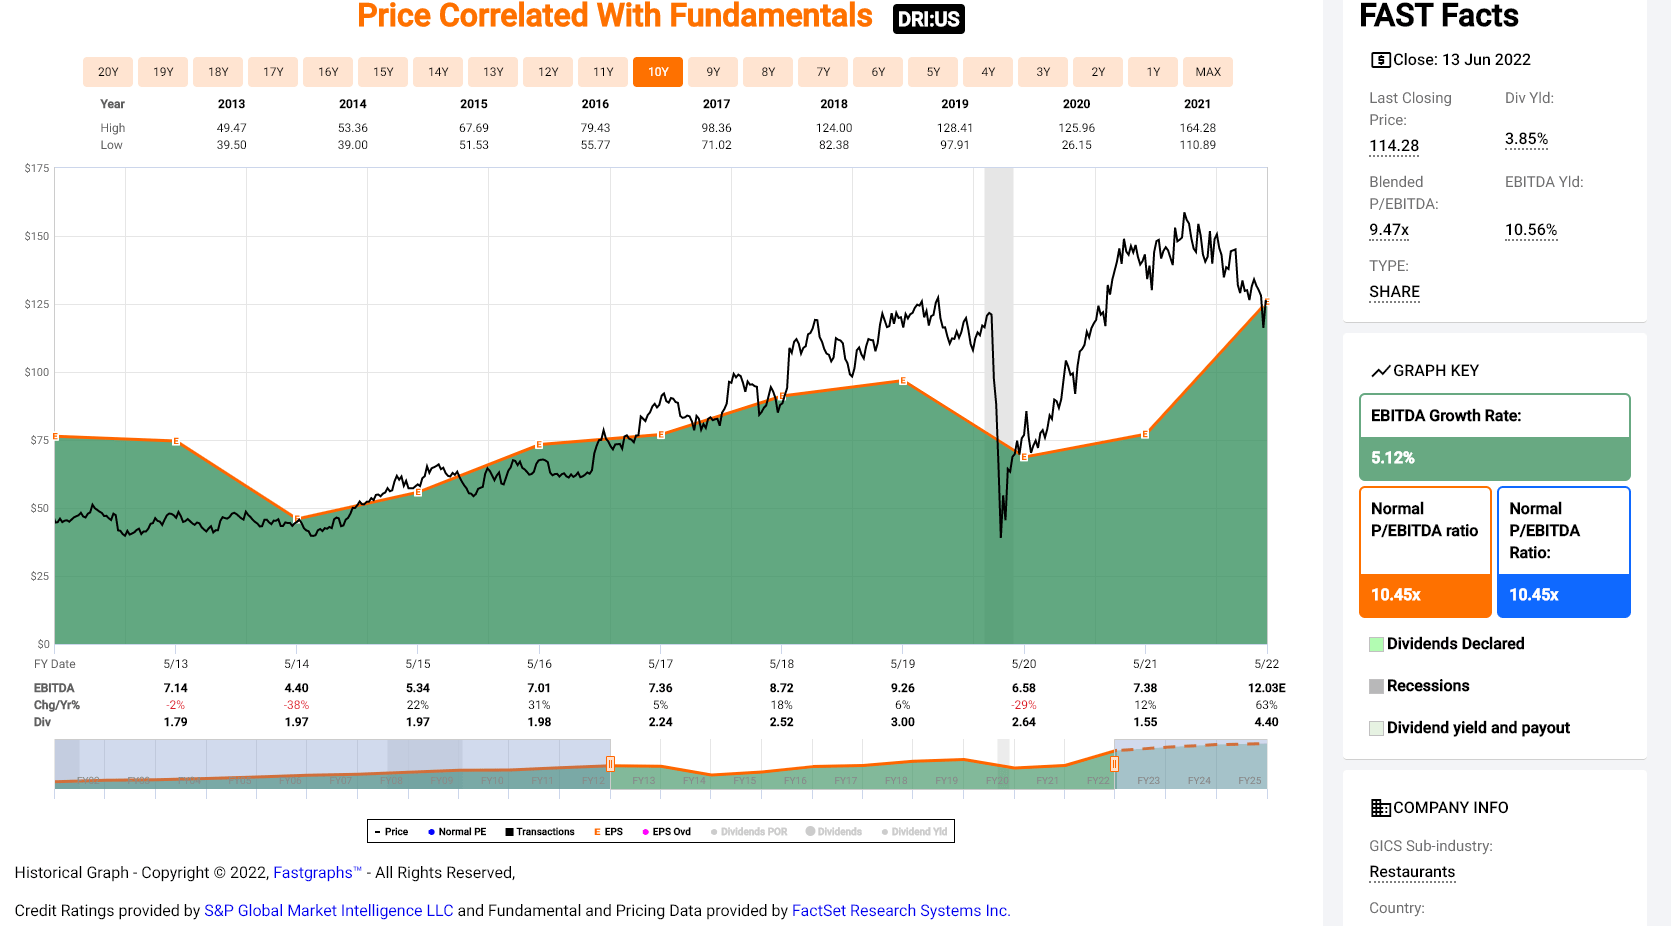
At first glance, this may appear cheap, and the dividend yield is certainly becoming attractive for a company of this size. However, the industry is up against near-unprecedented headwinds, with staffing continuing to be a challenge, commodity inflation sitting at multi-decade highs, and gasoline prices likely to impact consumer demand as discretionary budgets dip. Based on this challenging landscape, I believe a more appropriate multiple is 10.0x EBITDA, or a 5% discount given the headwinds.
When it comes to large-cap names, I will only start new positions when they’re trading at a minimum 25% discount to what I believe to be fair value. Assuming the company meets FY2023 EBITDA estimates of $13.20 and a fair multiple is 10.0x, the stock’s fair value comes in at $132.00. After applying a 25% discount, the low-risk buy zone for the stock from a valuation standpoint wouldn’t come in until $99.00 per share. Hence, even after the recent pullback, I don’t see enough margin of safety just yet.
Technical Picture
Moving over to the technical picture, it corroborates the view that Darden isn’t in a low-risk buy zone, with the stock still in the upper portion of its multi-decade channel despite its 31% correction. There’s no reason to believe that the stock has to head back to the bottom of this channel, given that this has only occurred in secular bear markets for the S&P-500 or major liquidity events (COVID-19 Crash). Still, a return to the mid-point of this channel below $100.00 wouldn’t be all that unusual.
Darden Monthly Chart (TC2000.com)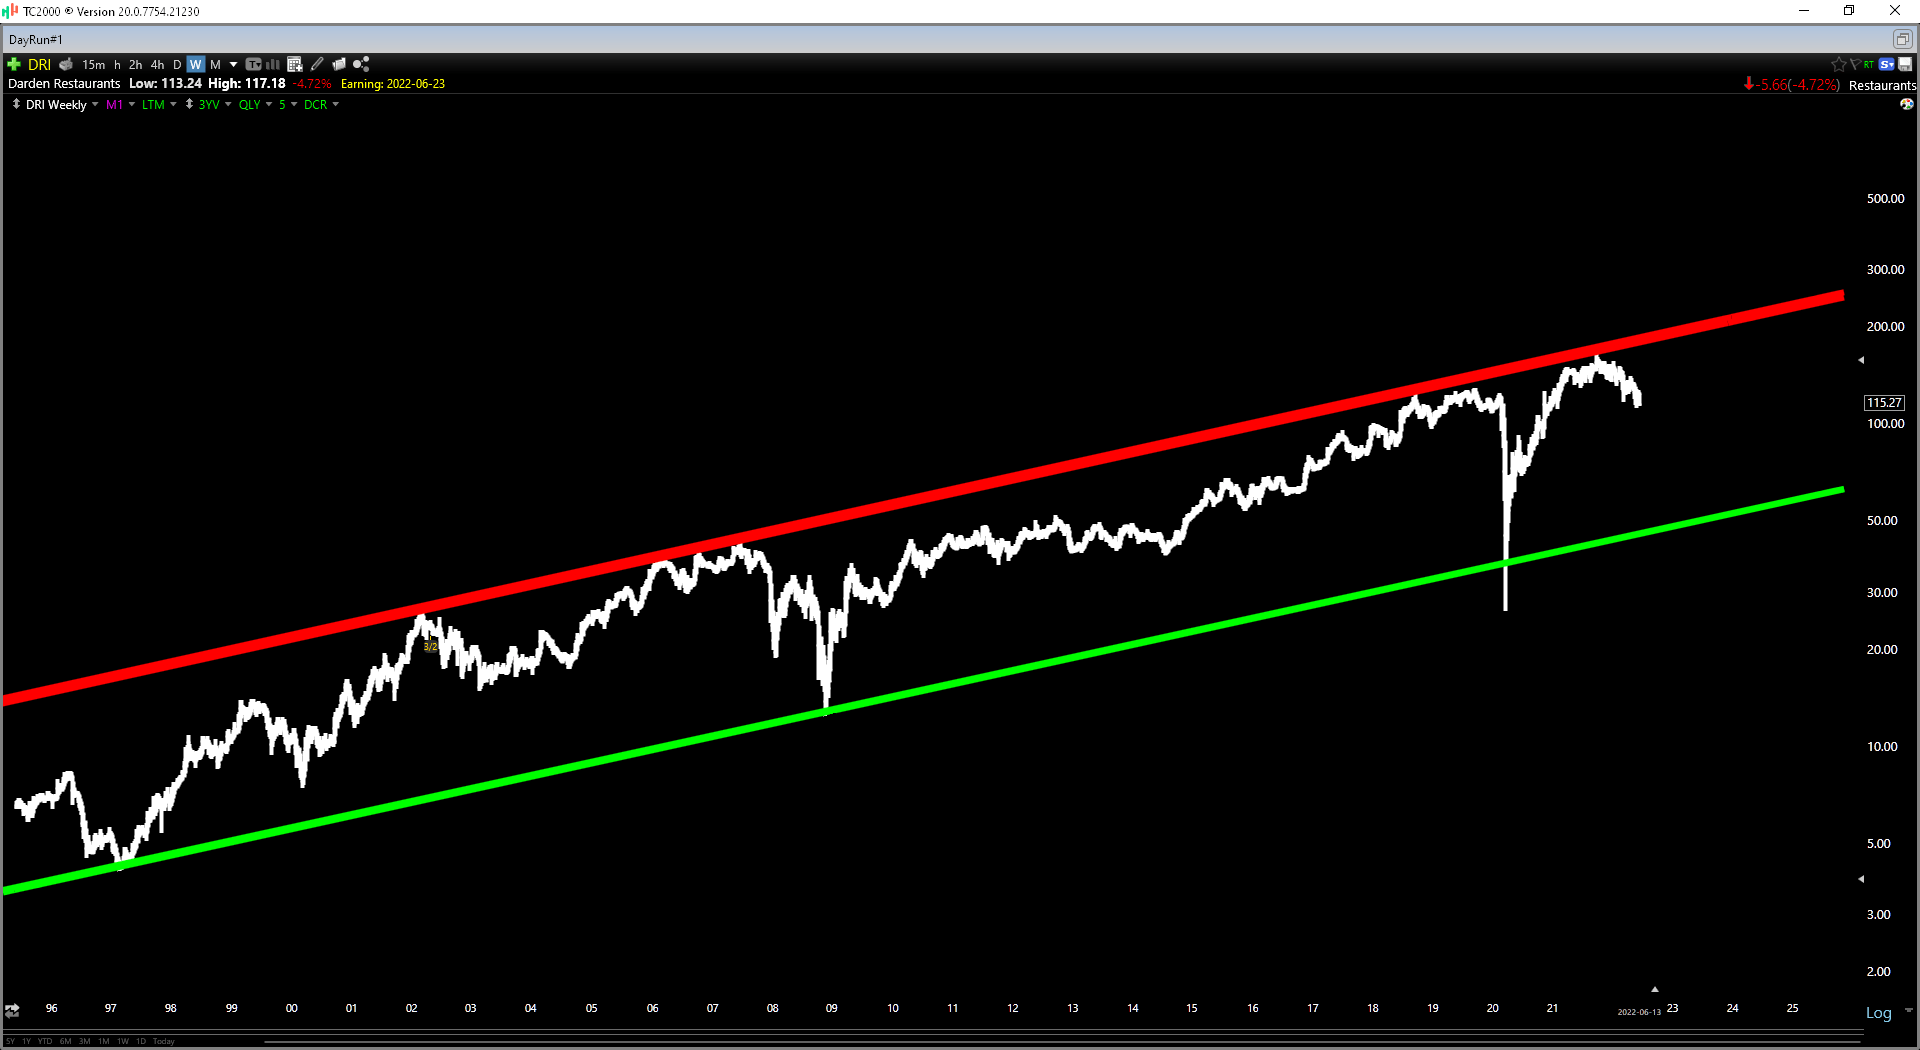
If we zoom in to the daily chart below, we can see that Darden no longer has momentum at its side, trading below its support band (green zone) and having broken a key support level at $133.00. Often, multi-month support levels will become new resistance levels once broken, and this area ($133.00) now looks to be strong resistance. Meanwhile, the next support level doesn’t come in until $95.00, given that Darden raced higher in 2021 without any time spent building new support levels during a near parabolic rally for the restaurant industry group.
DRI Daily Chart (TC2000.com)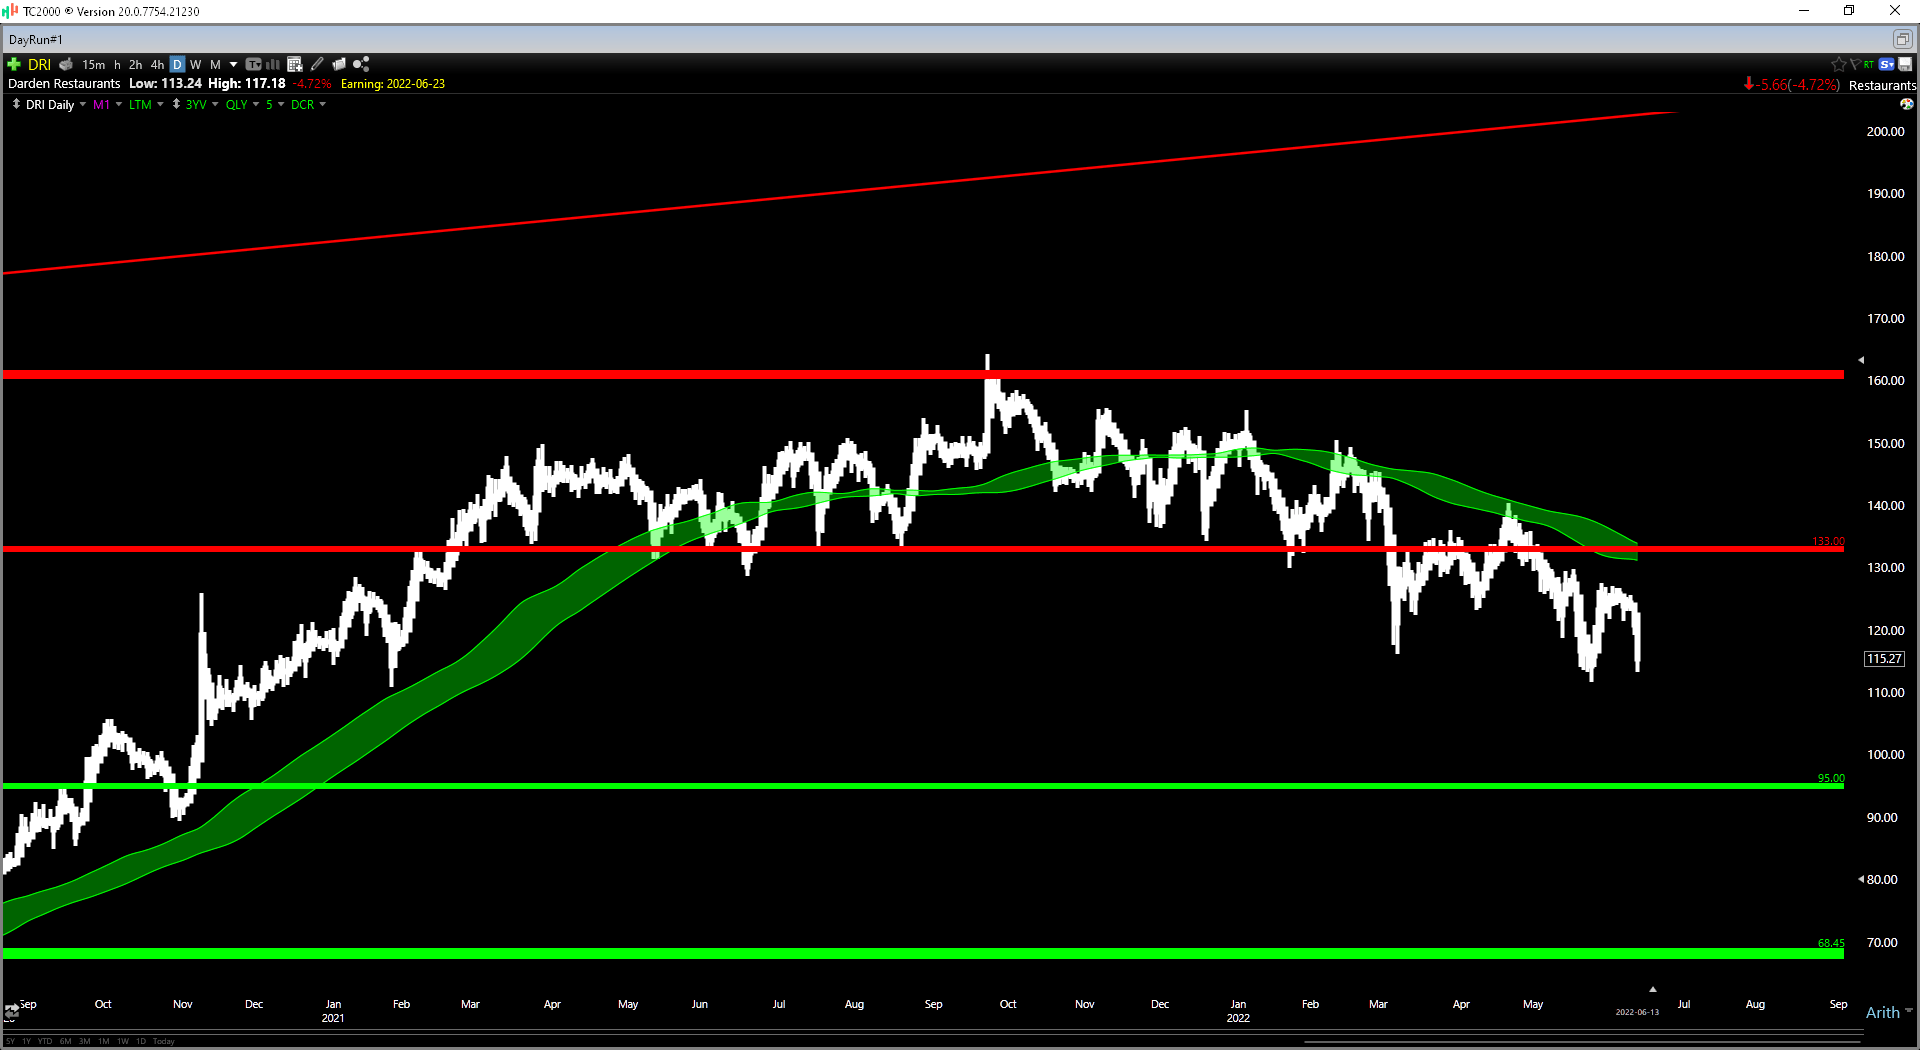
From a technical standpoint, I prefer a minimum of a 5.0 to 1.0 reward/risk ratio for starting new positions, and Darden doesn’t come close to meeting this criterion. This is because the stock has $18.00 in potential upside to resistance and $20.00 in potential downside to support, translating to a reward/risk ratio of 0.90 to 1.0. The current reward/risk ratio doesn’t come that the stock can’t go higher or put in an oversold bounce. However, for the stock to reach a low-risk buy point, it would need to dip below $100.50, where it would have $5.50 in potential downside to support and more than $30.00 in potential upside to resistance.
Darden Brand Portfolio (Company Presentation)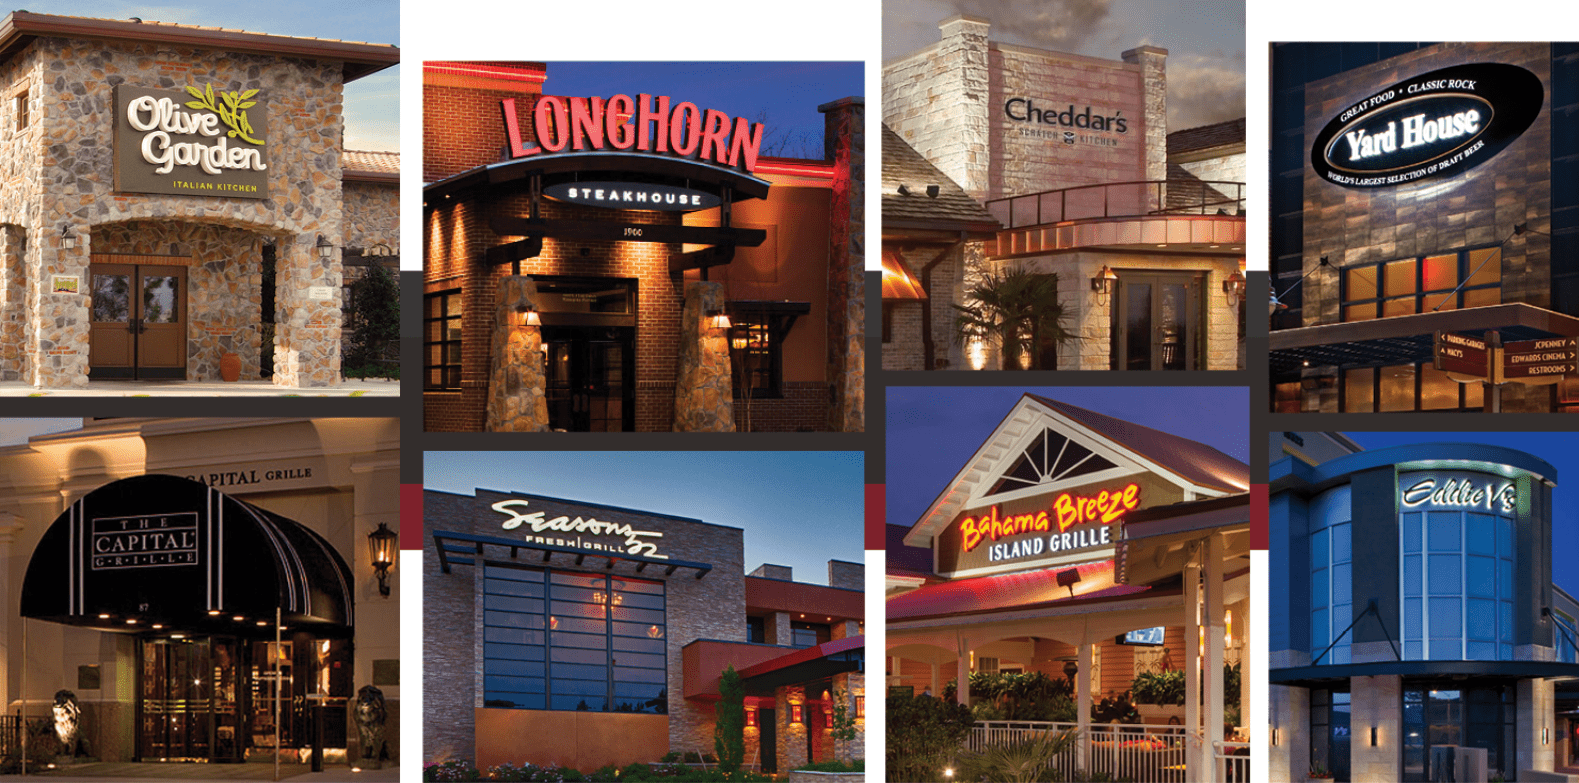
Darden has a portfolio of very solid brands and a generous shareholder return program, with a relatively high dividend yield and regular share buybacks. Normally, a 30% correction in the stock would be a buying opportunity, but the current environment is far from normal, especially for full-service restaurant brands that continue to see margin pressure. Therefore, while the stock may be enticing with a near ~4.0% dividend yield, I continue to see patience as the best course of action. Having said that, if the stock were to dip below $100.00 before August, I would this as a low-risk buying opportunity from a swing-trading standpoint.
Be the first to comment