

gorodenkoff/iStock via Getty Images
Thesis
As the world population is increasing and people are becoming older due to the wonders of innovation, the world is in need of strong health care companies improving our world with products to make our lives easier. Of course, while making a good profit. Today I want to discuss two industry giants, Danaher Corporation (NYSE:DHR) and Thermo Fisher (NYSE:TMO), which are very similar companies and are often mentioned together.
Throughout this article, I might refer to Thermo Fisher as TMO or Thermo and Danaher as DHR.
Quick Elevator Pitch On Each Company
This article is not aiming to be a deep dive into the business model of both companies, but rather a comparison between the fundamentals of the companies. I will give two quick elevator pitches about the business models, though.
Danaher Corporation
With $29.5 billion of revenue in 2021, Danaher is one of the world’s largest healthcare holding companies. The company has three segments, Life Sciences taking up 50%, Diagnostics 33% and Environmental & Applied solutions 17%. Danaher is an acquisitive business, having spent over $30 billion in cash for acquisitions in the last 2 years. They also occasionally sell segments or spin-off segments into the stock market. Over 75% of revenues are now recurring, up from 45% in 2015. One of the special things about Danaher is the Danaher Business System, which is a version of Kaizen that Danaher uses on all its business units to increase value creation.
Danaher revenue segments and brands (Danaher investor presentation 2021)
Thermo Fisher
With $39 billion of revenue in 2021, Thermo Fisher also is one of the world’s largest healthcare holding companies. Both companies have relatively similar portfolios. Like Danaher, TMO has a $15 billion Life Sciences business unit and a $5.5 billion diagnostic segment. Instead of an environmental segment, TMO has an analytics instrument ($6.2 billion) and Laboratory products and Biopharma Services ($16.7 billion) business units. TMO is also acquisitive, but to a lesser extent than Danaher, having spent $19 billion on acquisitions in 2021. Besides 2021 they do not make large acquisitions though. Like Danaher, TMO is also optimizing its offerings for recurring revenue models. Currently, 82% of revenue consists of services and consumables. We can conclude that both companies are leaders in important segments in the healthcare space, with a diversified portfolio of business units.
Thermo Fisher revenue segments (Thermo Fisher investor day)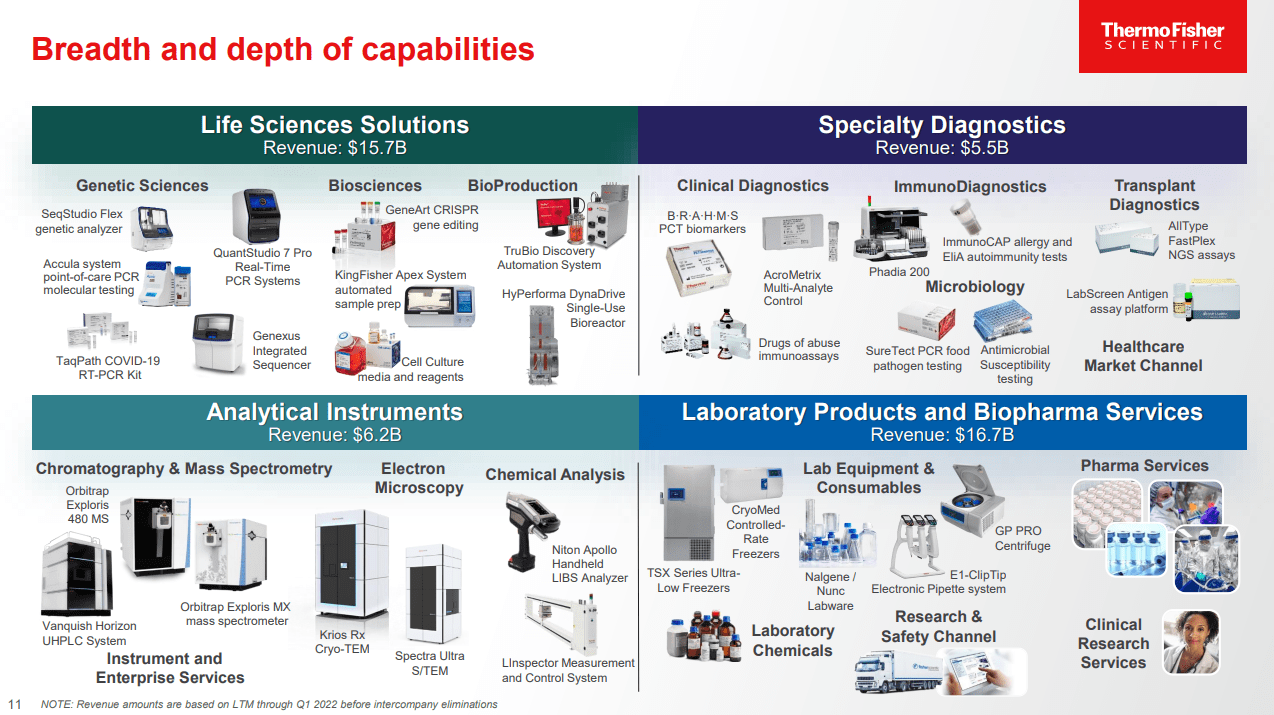
Industry
Thermo Fisher estimates its market segments at $225 billion, with a long-term growth trend of 4-6%. This is in line with estimates for the life sciences industry from Veeva Systems (VEEV), which I discussed more in-depth in an article this April. So we can see that both companies, having rather similar business segments, have long-term tailwinds in their growth.
life sciences industry growth (Thermo fisher investor day)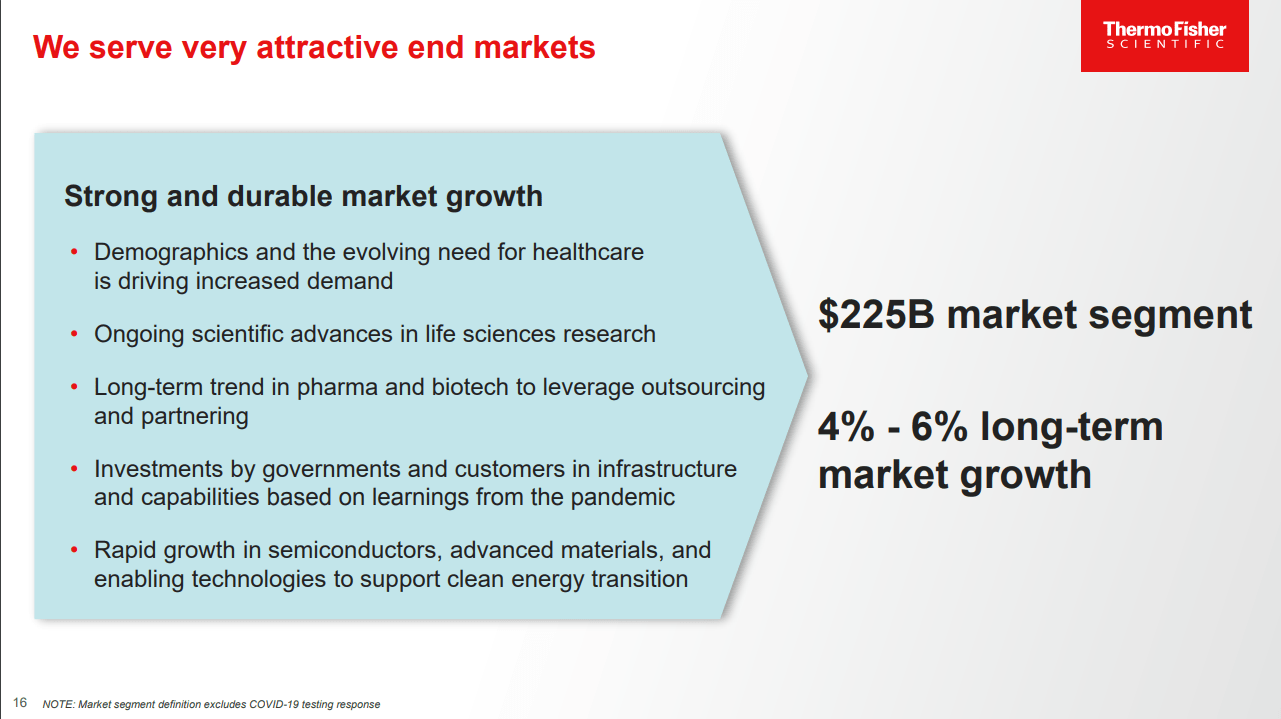
Capital Reinvestment
Over the long term, Capital Allocation is one of the most important differentiators for the performance of a company. This means how are the cash flows generated by the company reinvested. Companies have six options:
- Invest in the existing operations of the business
- Acquire new businesses
- Buy back shares
- Pay out dividends
- Pay down debt
- Sit on the cash
The result of these reinvestments can be roughly measured by Return on Equity, Return on Assets and Return on Capital. In the graphic below we can see that in recent years TMO has had a great development of returns, while DHR has largely stagnated with a slight downtrend. It is also important to compare Returns on Capital with the weighted average cost of capital (OTCPK:WACC) for the company. The rule of thumb is that a company should generate excess Returns on Capital compared to its WACC of 2%. The WACC for TMO is 6.89%, which is 2.85% below the ROC, in line with the rule of thumb. The WACC for DHR is 7.61%, which is 0.28% below the ROC. That means DHR does generate higher returns than its WACC, but doesn’t exceed the rule of thumb. Thermo Fisher seems to have the upper hand on Capital reinvestment.
Capital reinvestment comparison (koyfin)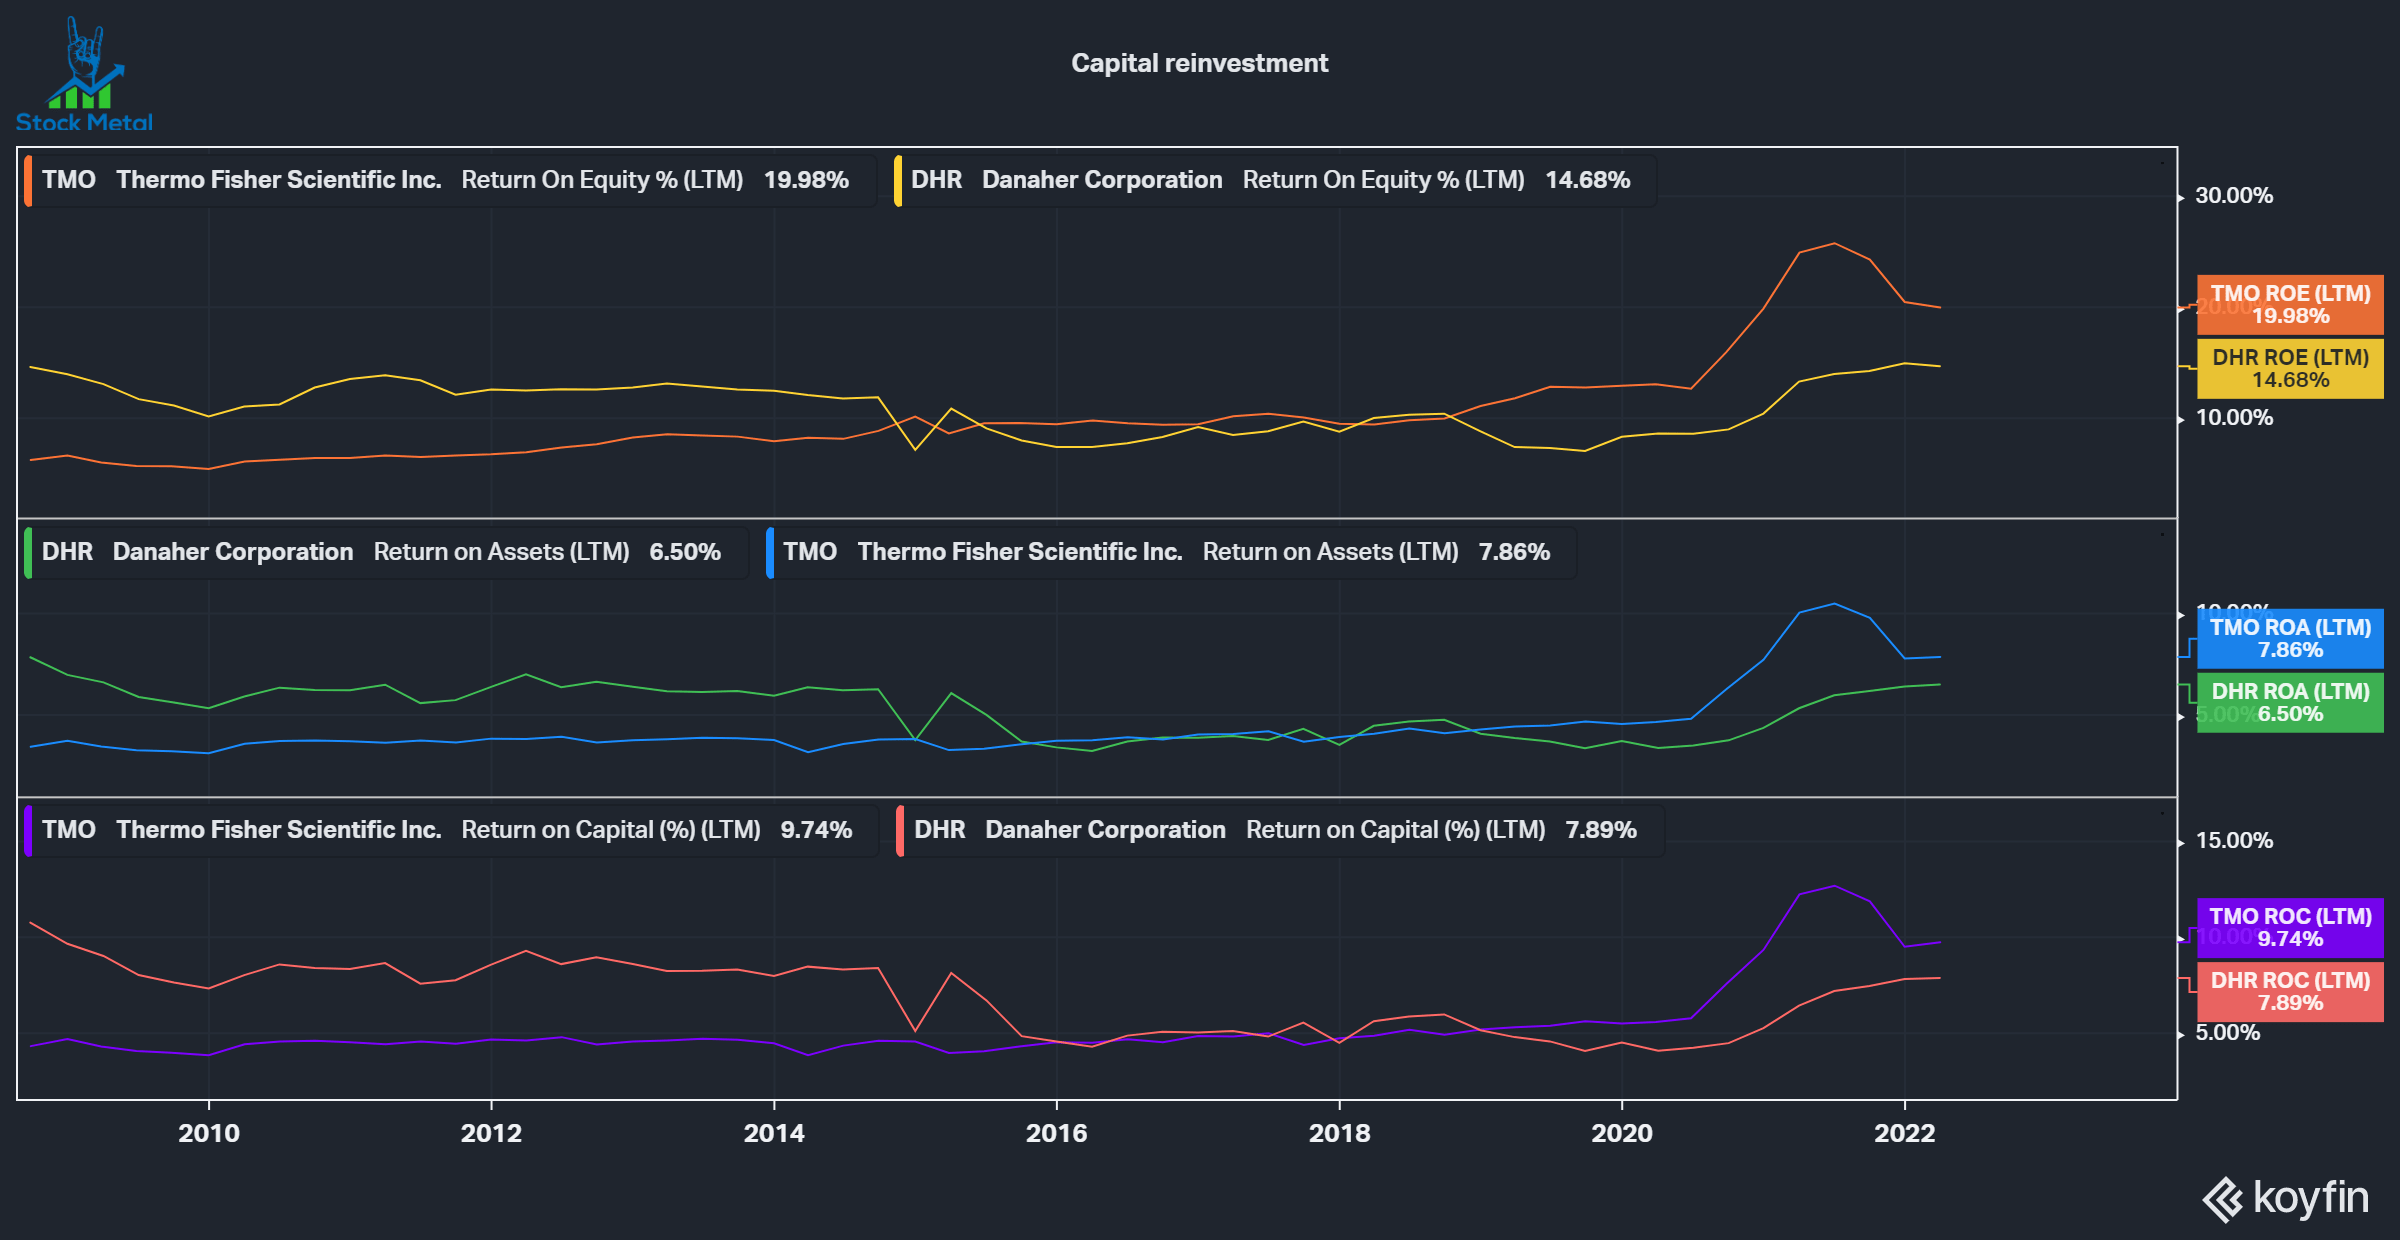
Profitability
At the end of the day, companies are just about the profits and cash flows that will be generated. We can see that both companies have excellent profitability and managed to grow the bottom line over time. We can also see that Danaher has higher margins than Thermo, and therefore has a slight lead in profitability.
Margin comparison (koyfin)
Growth
Good companies manage to grow their top line and bottom line over time, preferably every single year. We can see that both companies were a fantastic growth story over the last 5 years, growing at double digits in revenues and growing profits and cash flows in the 20s compounded over the last 5 years. Although both are excellent, TMO grew faster in revenues, operating cash flows and earnings, and thus wins this round.
Growth comparison (koyfin)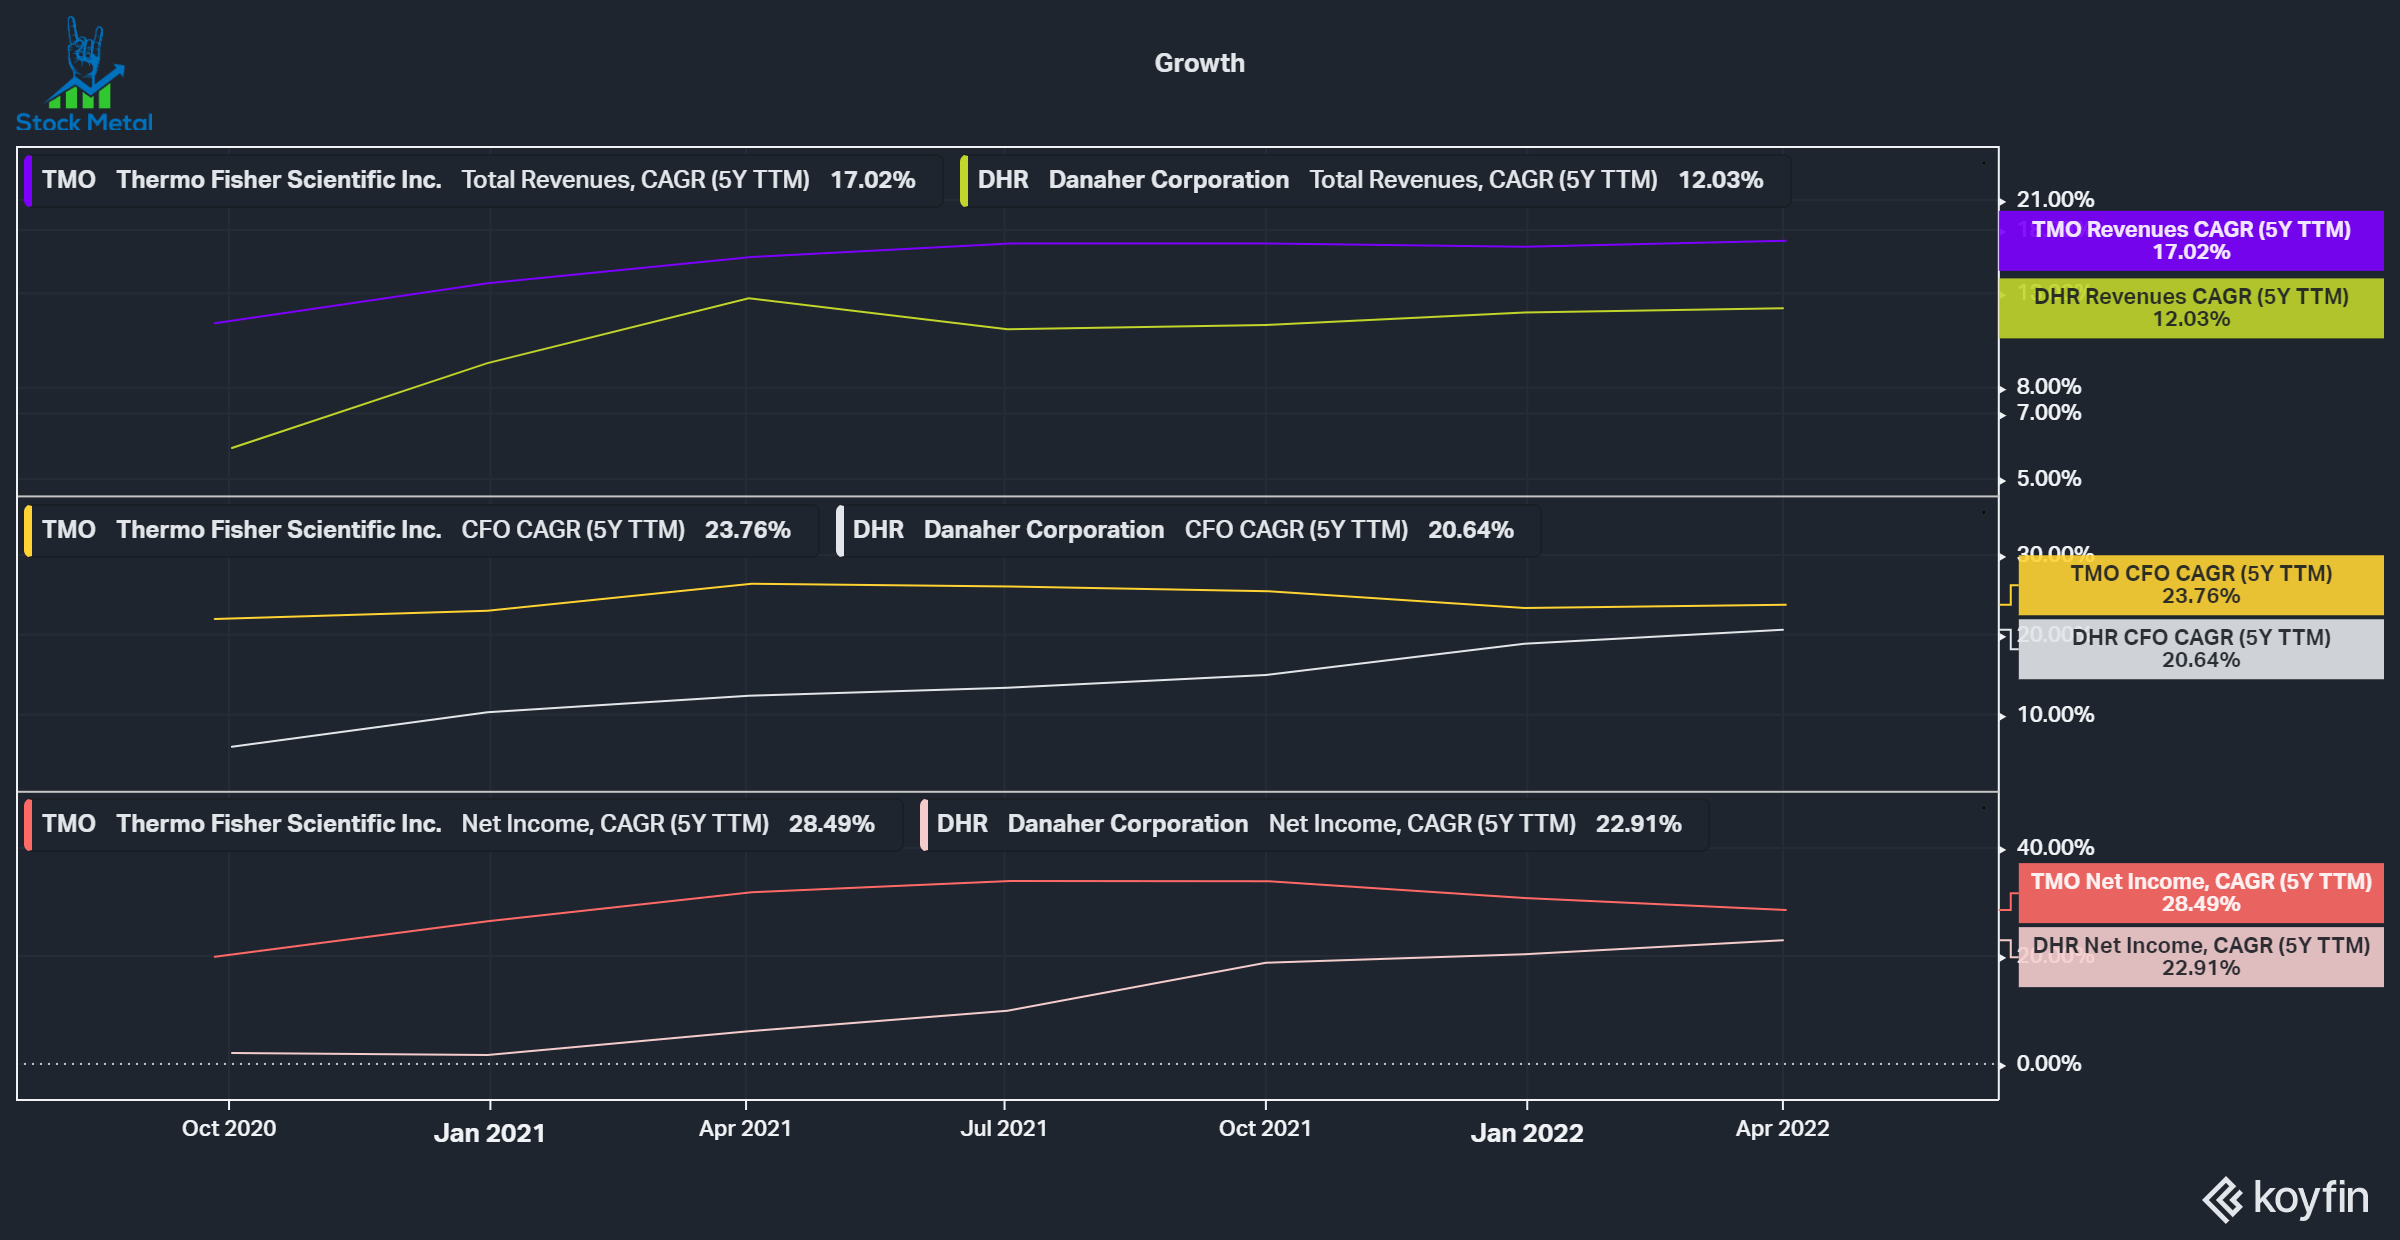
Capital Returns
Besides share price appreciation, most companies return money to shareholders by buying back shares, paying dividends and paying down debt. We can see that both companies aren’t really buying back shares, over the last 5 years TMO share count is flat and DHR increased by around 10%. Both businesses return money to shareholders via growing dividends, but because both companies had stellar share price appreciation over the last 5 years, the dividend yield keeps decreasing and is not a big part of the overall return. Both companies are acquisitive and occasionally take on a lot of debt to fund these acquisitions. We can see a clear correlation between large increases in debt issuance and large acquisitions. We can also see that the companies pay down debt, paying down billions of dollars a quarter when they aren’t acquiring businesses. Both businesses have similar capital return strategies and I can’t see a clear winner here, so both get a point.
Capital Returns comparison (koyfin)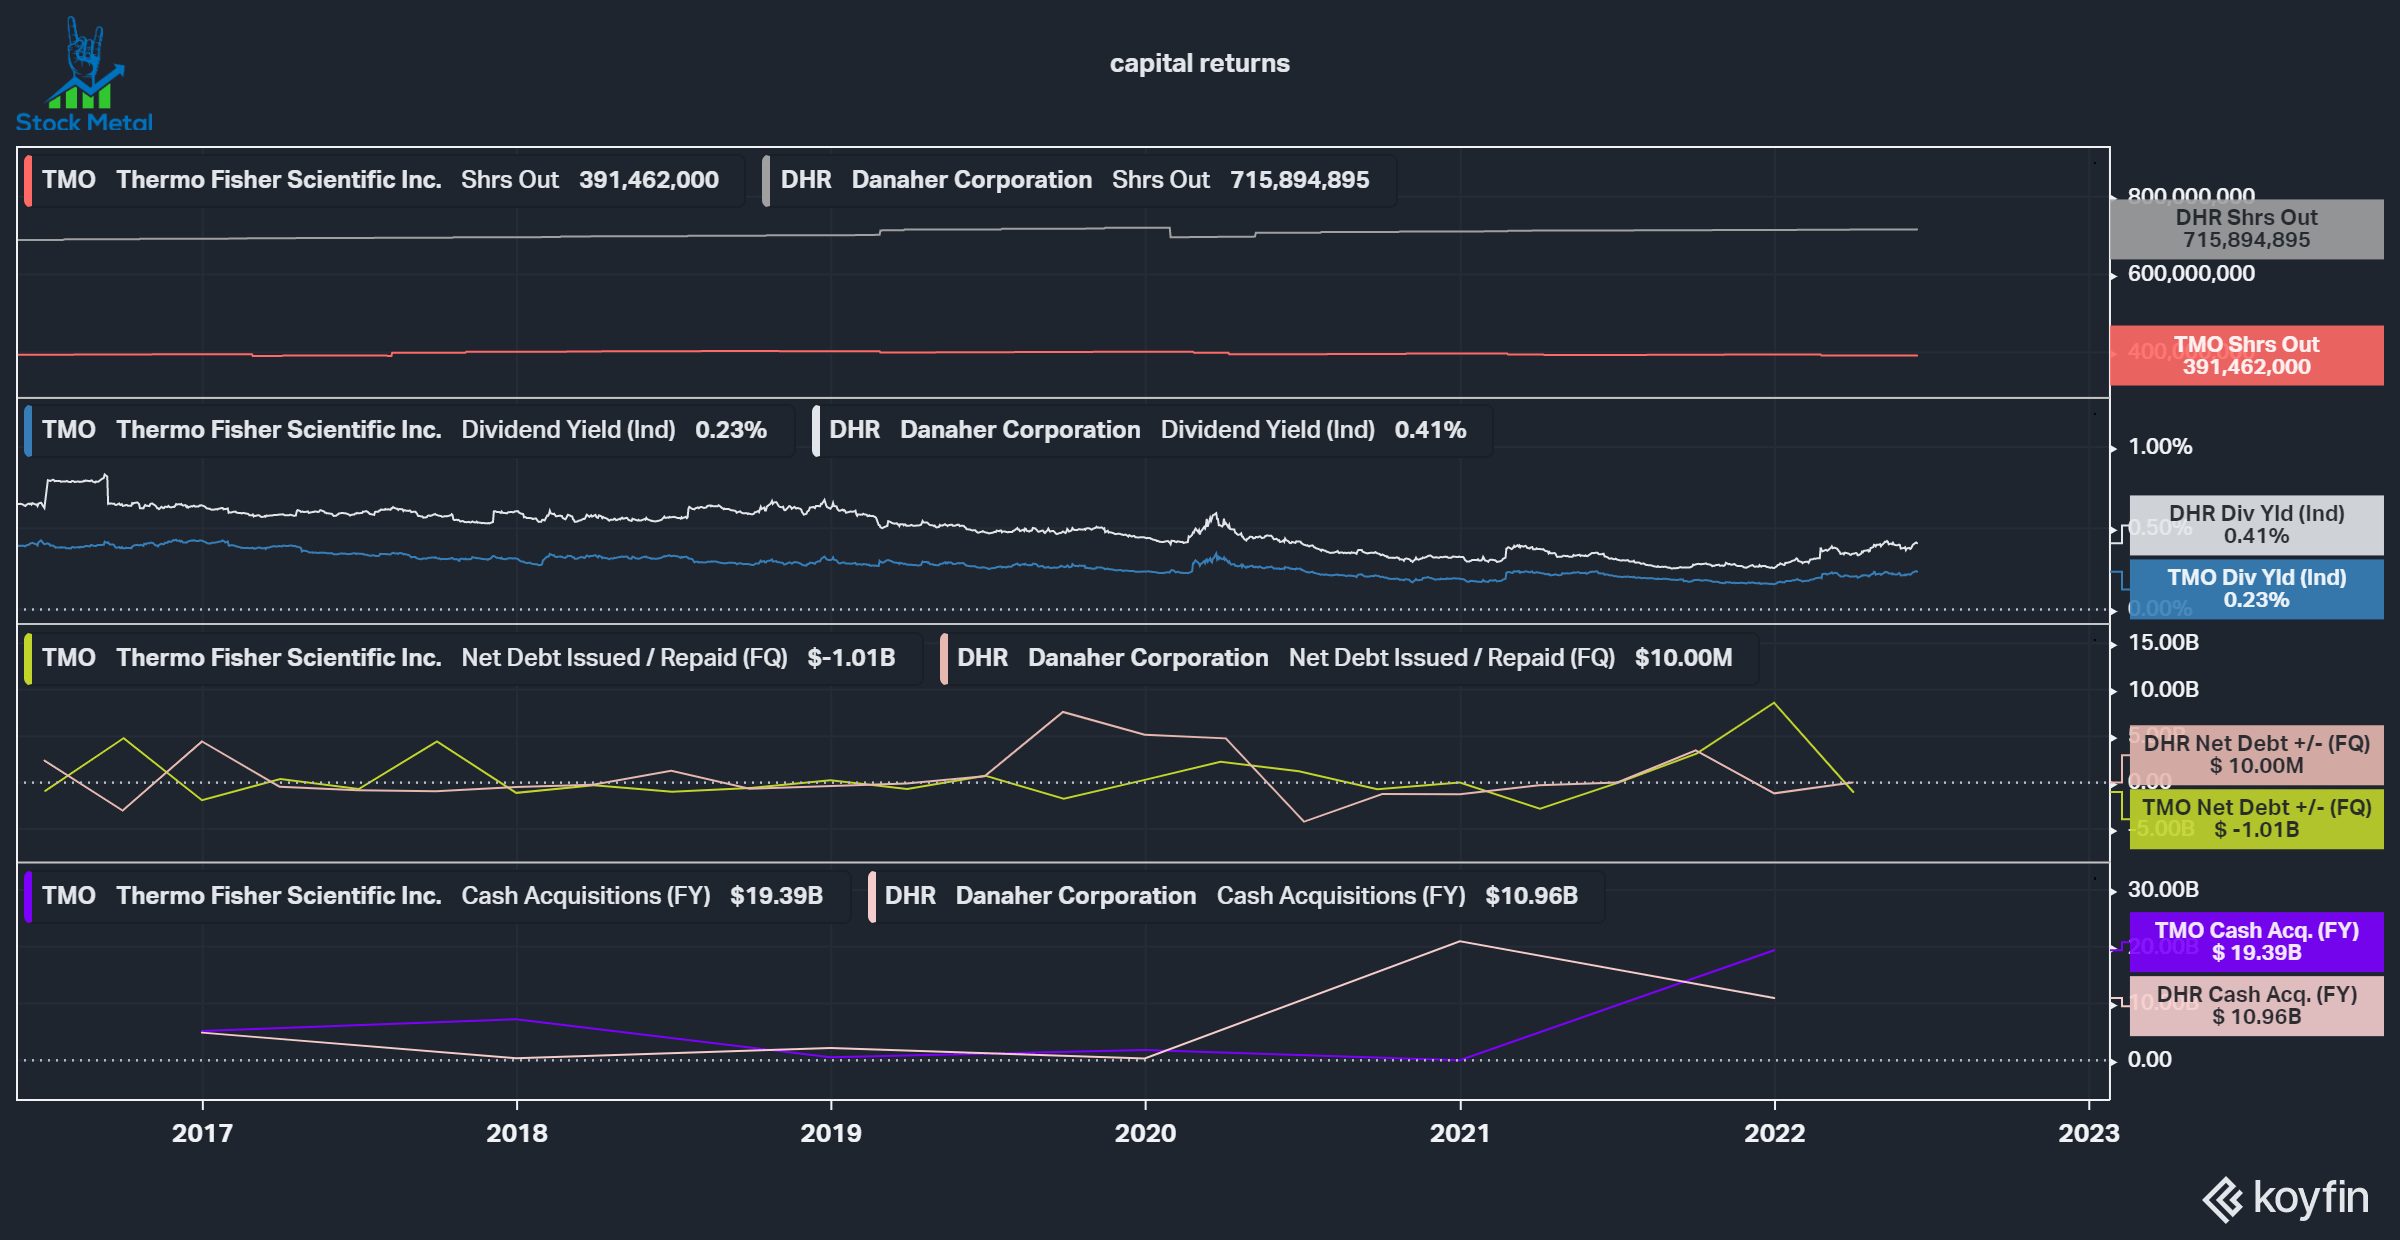
Valuation
Let’s take a look at the current valuations. Both companies have seen a considerable drawdown (22% and 26%) over the last months. We can generally see a trend that both companies trade relatively in line, which is especially evident right now. Both companies trade at 19 times forward EV/EBITDA and 23 times forward PE. During 2020 and 2021 Danaher saw a significant multiple extension, while TMO stayed at relatively normal valuations. These multiple expansions are now contracted back. Right now, Danaher is trading at a 3.62% Free Cash Flow Yield, while TMO only has a 3.02% FCF yield. Overall, both companies are now attractively valued in my opinion, considering the future growth and high quality of the businesses.
Valuation comparison (koyfin)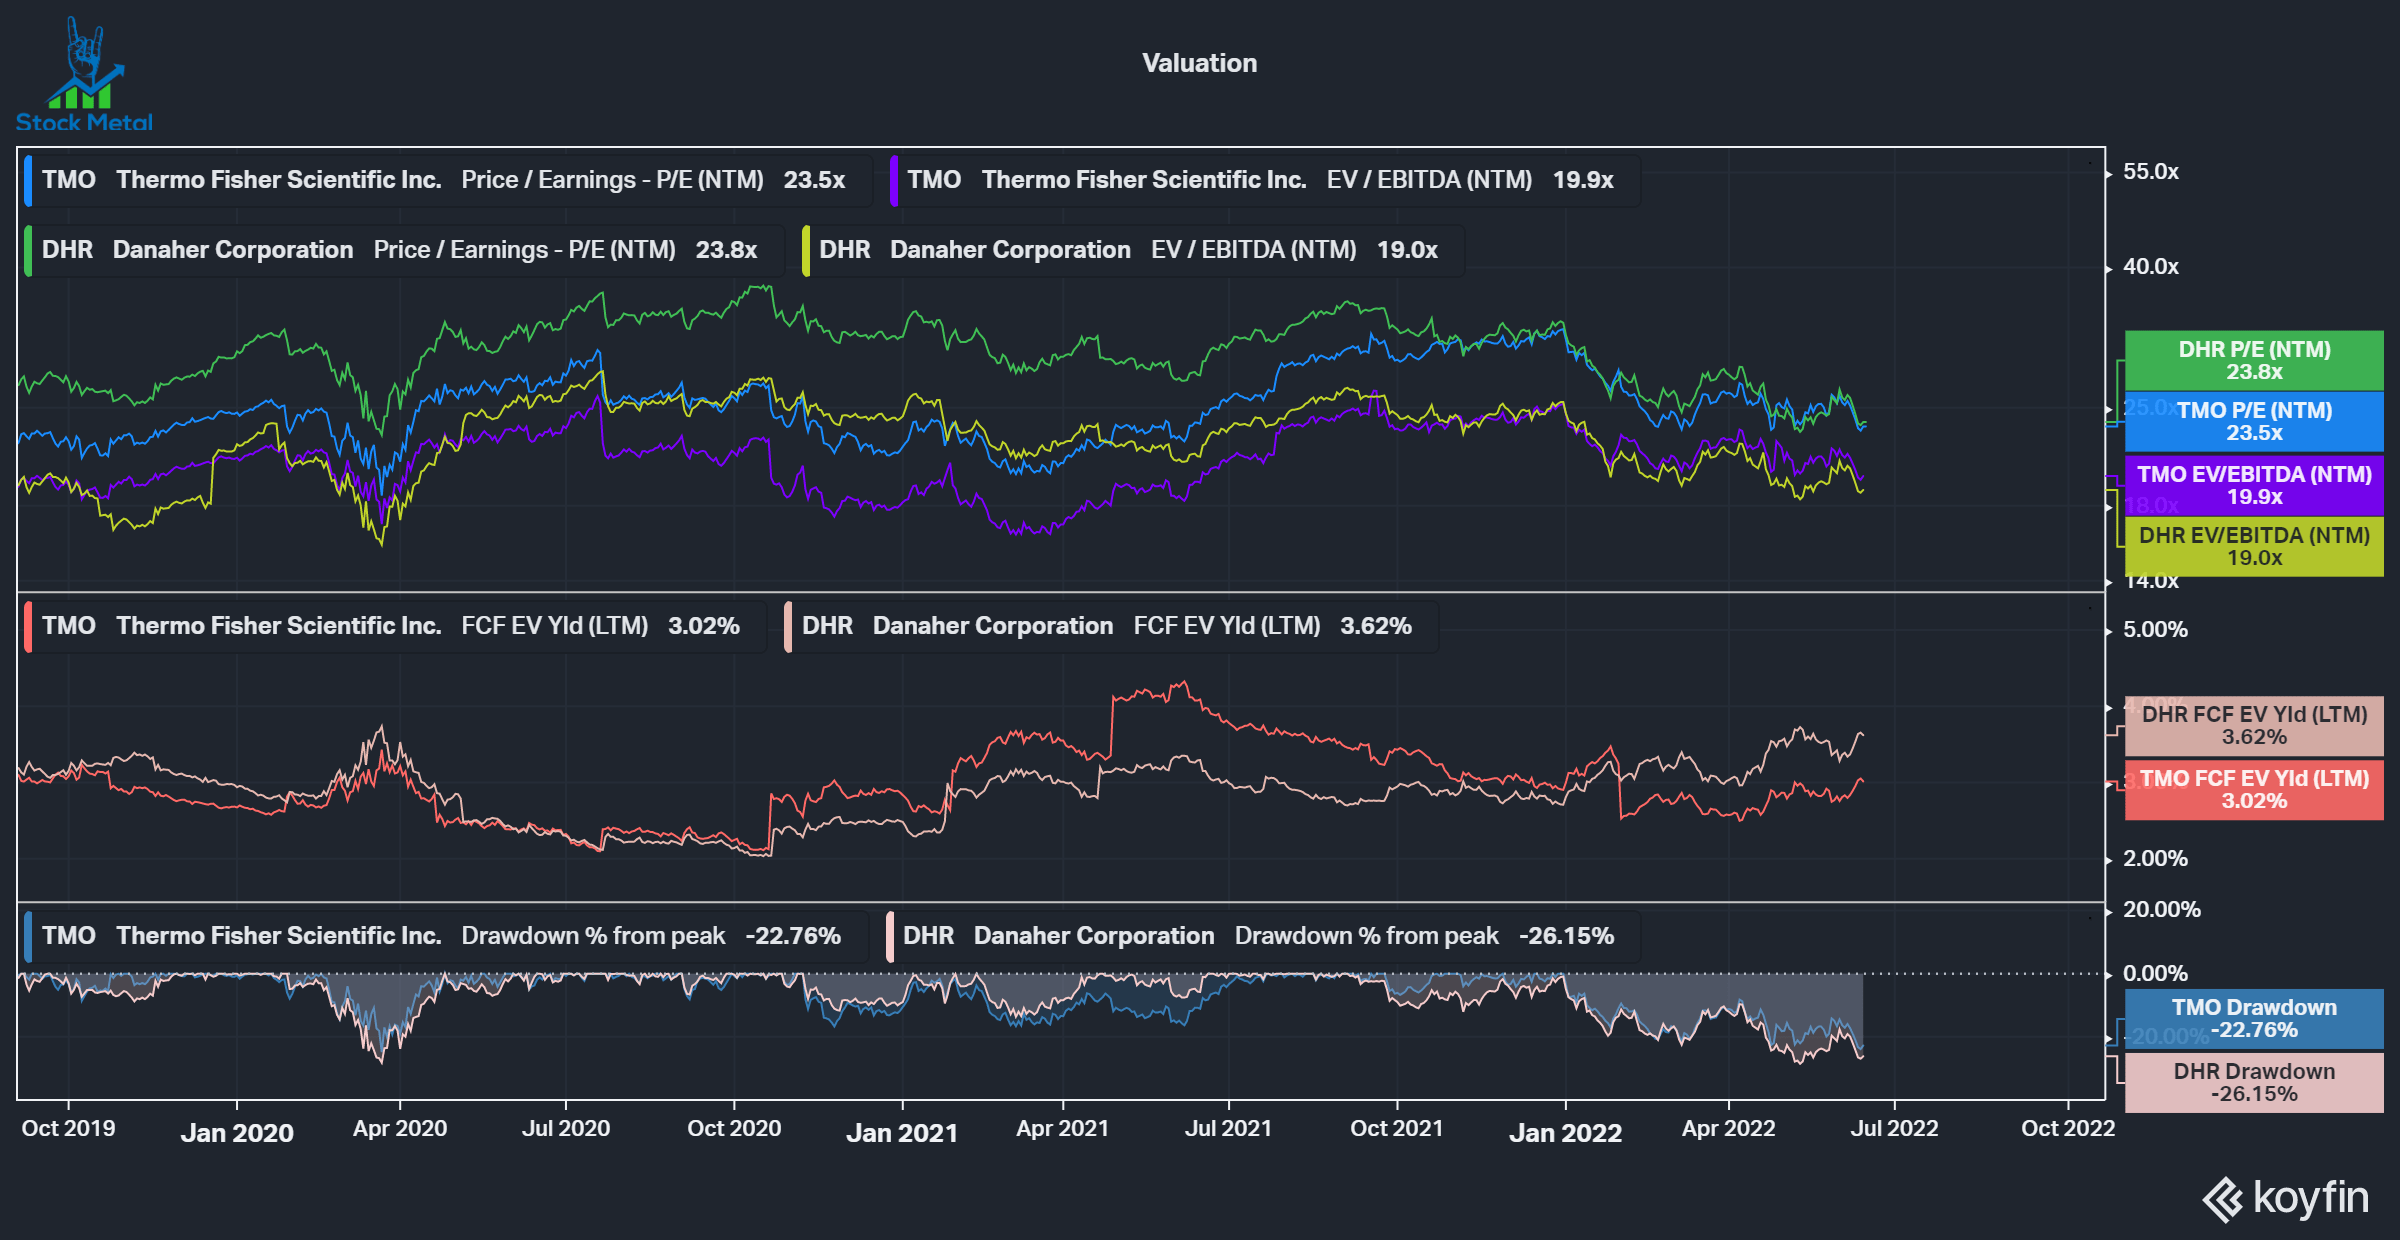
Conclusion
In conclusion, I can say that both companies are high-quality compounders with a proven track record of excellent operations and integrating M&A into its business strategy. Both companies are head-to-head and there is no way to choose a clear winner in my opinion. I consider both companies a buy, but I only own shares of Danaher at this moment. The Danaher Business System gives them a small edge in my opinion, but really it wouldn’t hurt to just put both companies at equal weighting into a portfolio.
| Danaher | Thermo Fisher | |
|---|---|---|
| Capital Reinvestment |
x |
|
| Margins | x | |
| Growth | x | |
| Capital Returns | x | x |
| Valuation | x | x |
| Future prospects | x | x |
Be the first to comment