

vzphotos/iStock Editorial via Getty Images
Price Action Thesis
We present a timely price action update on Micron Technology, Inc. (NASDAQ:MU) stock after our previous article in May, as we cautioned investors about more significant headwinds coming.
There have been significant developments in its price action structures since our May update, as we seek to provide clarity over the critical levels that investors should watch closely.
Notably, we have not yet observed a potential bear trap at the current levels. Furthermore, given its prior double top bull trap that we highlighted previously, any near-term bottom should be viewed cautiously, even with a validated bear trap.
Our reverse cash flow valuation analysis suggests that the market has lost its confidence in MU stock, as it is pricing in a significant memory downturn. But, investors should note that the market has already been setting up the stage for this collapse since its double top bull trap in January 2022, well ahead of time.
Accordingly, we reiterate our Hold rating on MU stock.
The Double Top Sell-off Has Begun
MU price chart (monthly) (TradingView)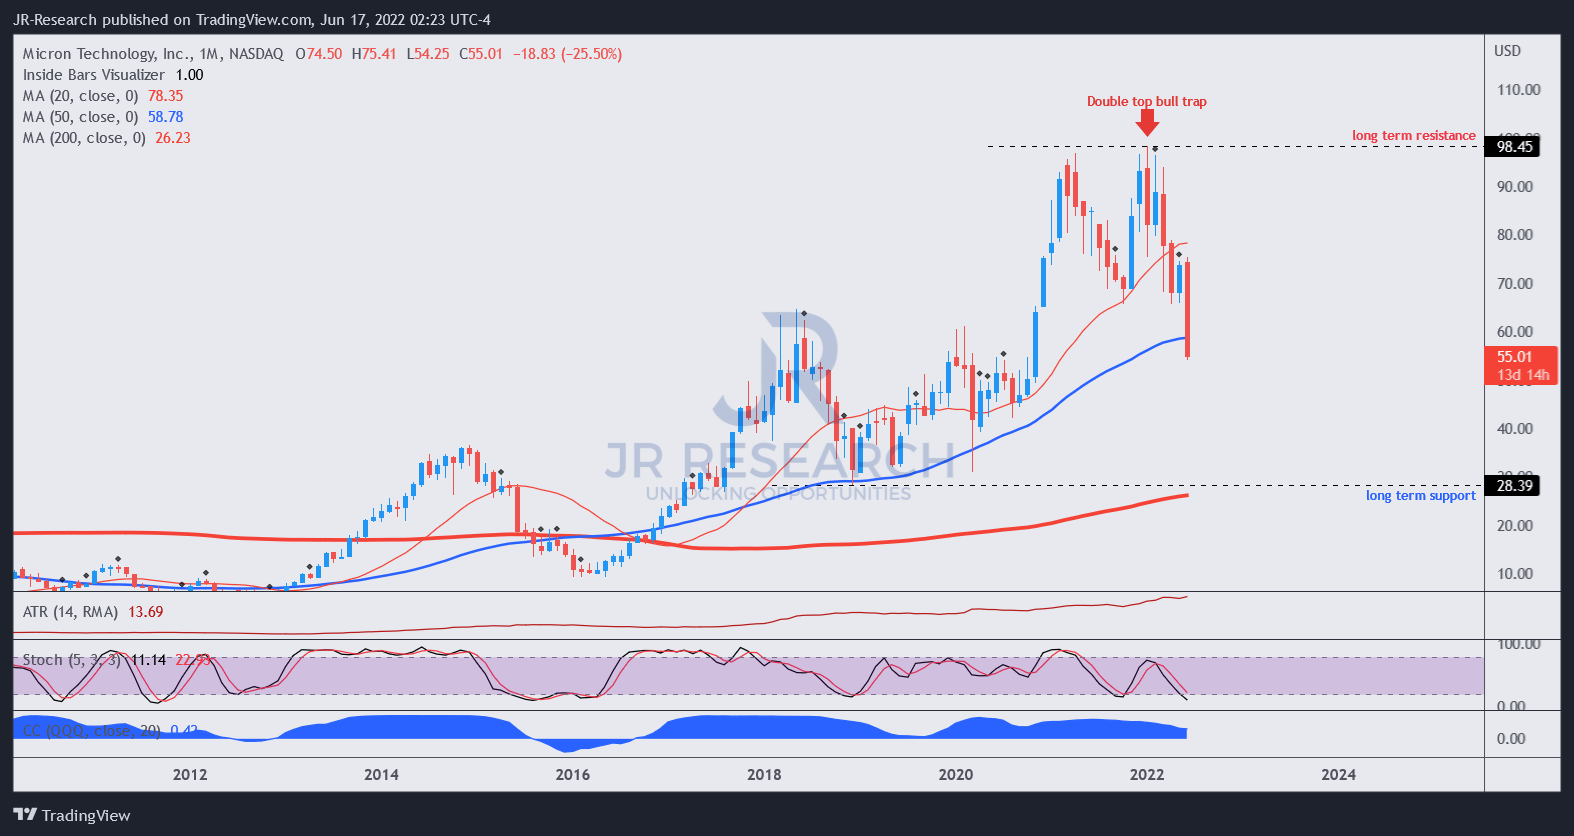
As growth investors, we have seen and ignored several such bull traps seen in MU stock above and were duly punished. Price action is not fortune telling/tea leaf reading, nor does it proffer a 100% prediction of the market’s intentions (since data changes/evolves, such as the recent 75 bps hike).
However, it offers helpful clues over the market’s forward-looking perspective, and some price action structures are regarded as higher probability set-ups. For example, one of the most potent price action structures we ignored in the past (and punished subsequently) is the double top bull trap formed in MU stock in January. It provides an early warning sign to investors that the market could start its distribution phase before the subsequent steep sell-off.
Notably, the distribution phase took close to six months before forcing it down further in early June.
MU price chart (weekly) (TradingView)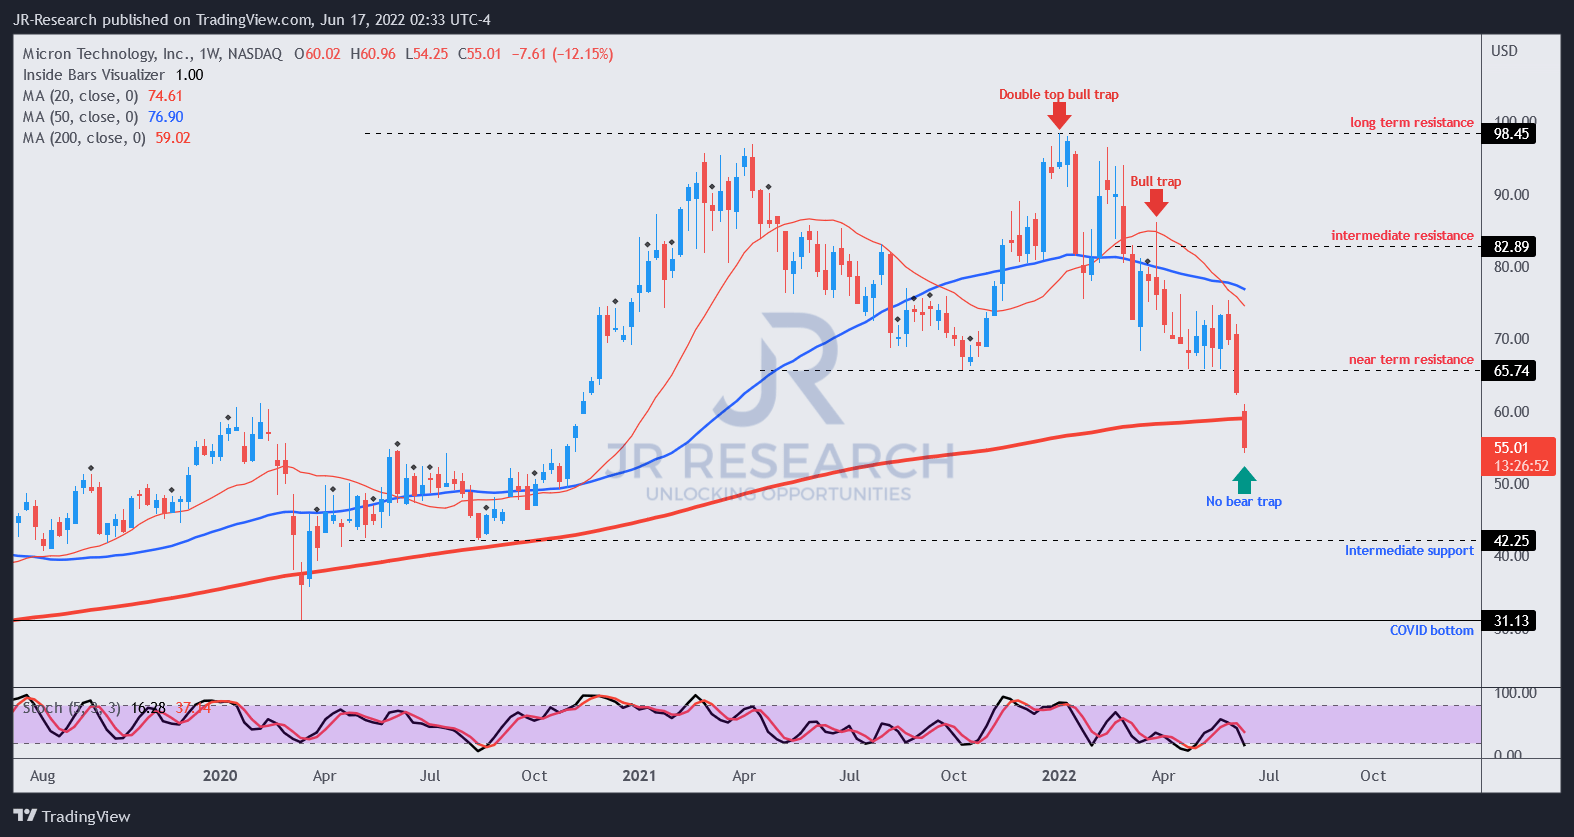
Moving over to its weekly chart, we can observe the traps and MU stock’s critical support/resistance levels.
Note the subsequent bull trap that formed in late March after its January’s double top bull trap. That signaled that the market rejected the dip-buying in March, as it continued to distribute MU stock.
However, the market is often astute in its distribution phase. In Micron’s case, it used its near-term resistance (previously MU’s near-term support), which it held since its validated bear trap in October 2021, to draw in dip buyers over the past three months.
However, MU stock had moved subtly into negative flow (bearish momentum) since April 2022, as it drew in more dip buyers. Therefore, we decided to cut our PT in our previous article and downgraded our rating, as we expected the market to go for the “slaughter” in due time. The risk of a steep sell-off was indeed brewing.
Consequently, MU stock lost its critical support level in early June and has seen no signs of stopping. Such steep sell-offs signal the end of its distribution phase, as the market moved to force rapid liquidation in MU positions.
However, we don’t see any potential bear traps at the current levels. Furthermore, the stock is mired in “no man’s land,” stranded between its crucial support and resistance zones. Therefore, any entry here could be pre-mature, and we urge investors to watch for sustained consolidation or basing.
The Market Disagrees With MU Stock’s Valuation
MU NTM FCF yields % (TIKR)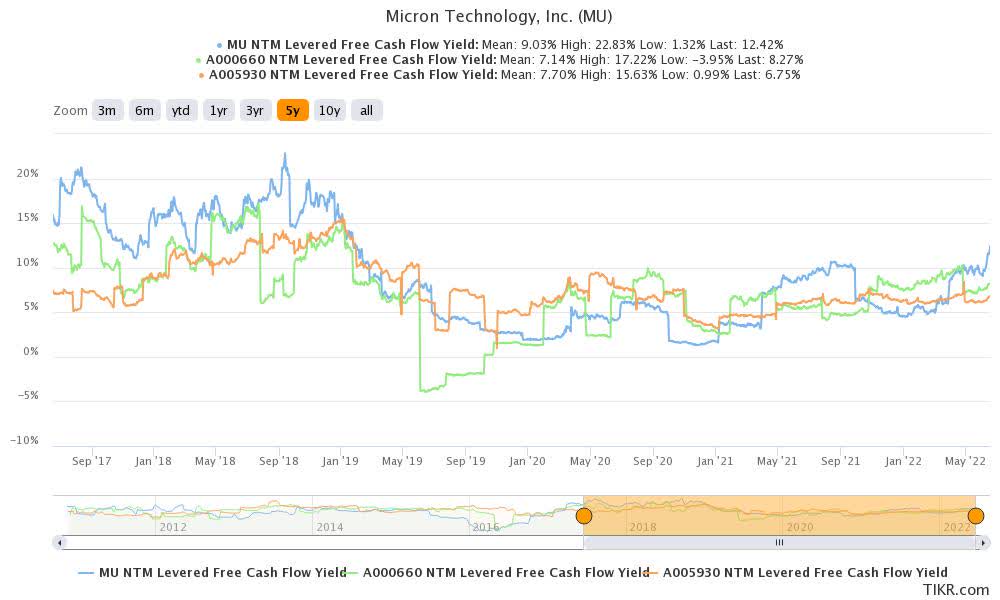
MU stock last traded at an NTM FCF yield of 12.4%, which is way above the market’s average. It’s also above its memory peers, as seen above. Moreover, MU traded at an FCF yield of 4.7% or a normalized P/E of 10x at its January highs. These are metrics that we can hardly say are expensive in general.
But, we must be careful to apply general market context when valuing MU stock. We highlighted previously that investors must pay sufficient attention to its memory peers’ valuation as they impact the market’s perception of MU stock valuation.
Notably, the market has consistently discounted the valuations of memory players against its semi peers, which we discussed in our previous articles.
MU 1M performance % (koyfin)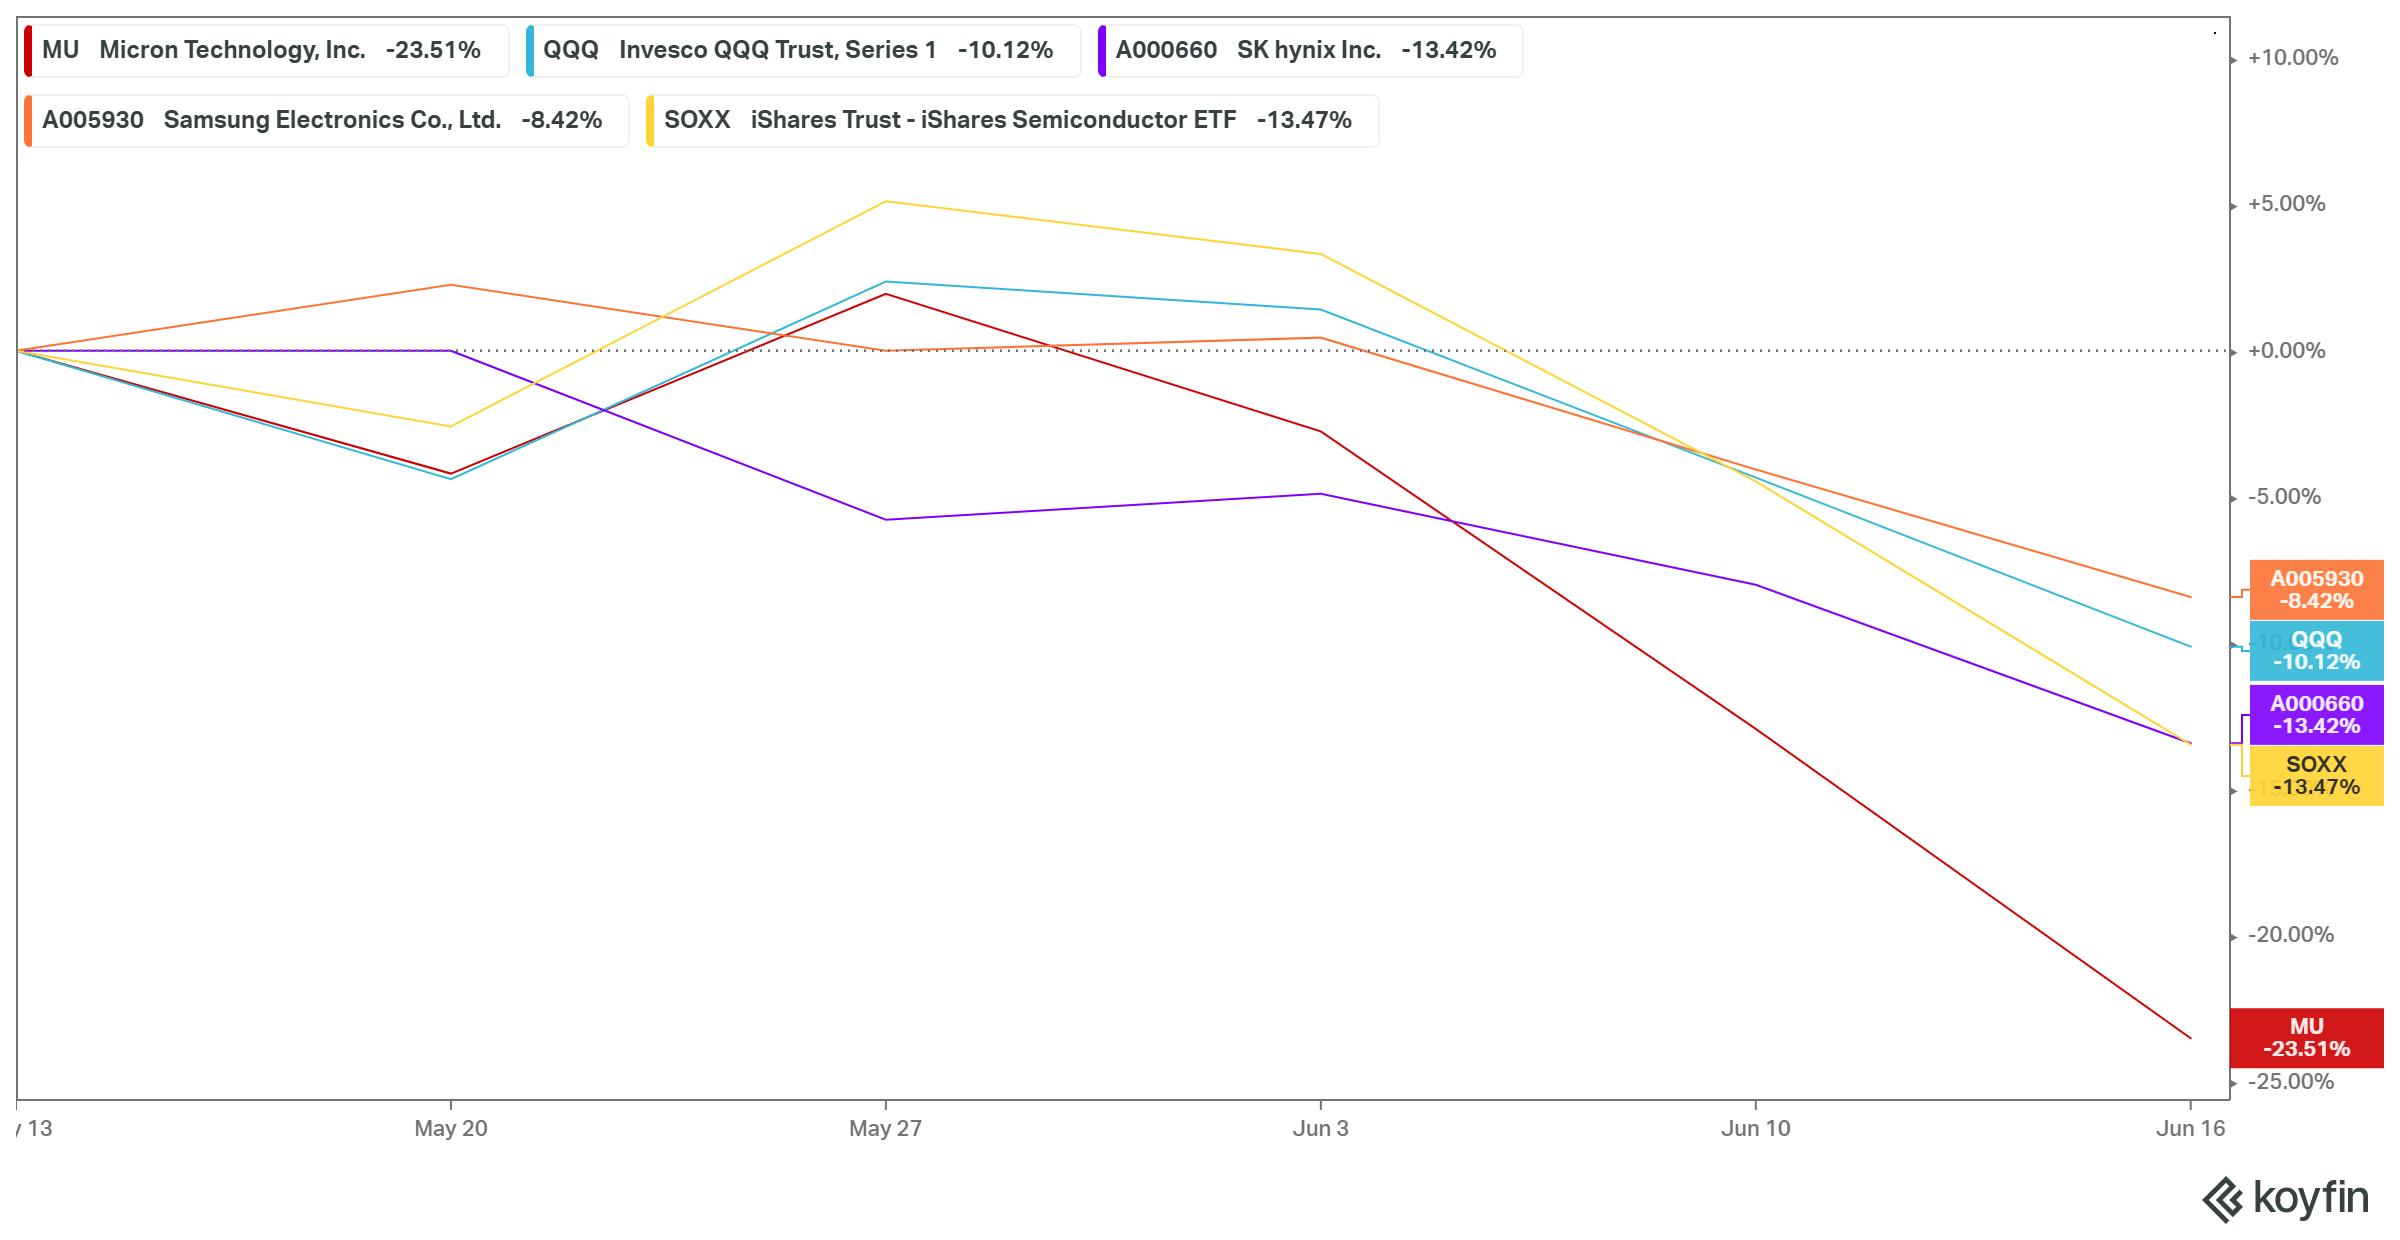
Furthermore, despite its “cheap” valuations, MU stock underperformed the market and its memory and broad semi peers over the past month.
Of course, we explained above that it’s part of the market’s move to force liquidation, which exaggerates selling pressure. But, if the market thinks MU stock is cheap, why did it also slaughter MU? We learned with past painful experiences to never argue with the market.
| Stock | MU |
| Current market cap | $61.43B |
| Hurdle rate (CAGR) | 12% |
| Projection through | CQ2’26 |
| Required FCF yield in CQ2’26 | 9% |
| Assumed TTM FCF margin in CQ2’26 | 18% |
| Implied TTM revenue by CQ2’26 | $48.33B |
MU stock reverse cash flow valuation model A. Data source: S&P Cap IQ, author
Accordingly, we used MU stock’s 5Y CAGR as our hurdle rate in our reverse cash flow valuation model. Also, using the 5Y mean of its FCF yield of 9%, we derived a TTM revenue requirement of $48.33B by CQ2’26.
But, the market doesn’t seem to agree that Micron could deliver these revenue estimates. Coupled with signs of a continued decline in DRAM pricing, we think the market has demonstrated its uncanny forward-looking ability since January.
Furthermore, Nikkei Asia reported yesterday (June 16) that Samsung “is temporarily halting new procurement orders and asking multiple suppliers to delay or reduce shipments of components and parts for several weeks due to swelling inventories and global inflation concerns.” Notably, it came after the memory leader issued an optimistic outlook last month for the rest of 2022.
| Stock | MU |
| Assumed entry price | $42.25 |
| Hurdle rate (CAGR) | 8% |
| Projection through | CQ2’26 |
| Required FCF yield in CQ2’26 | 12% |
| Assumed TTM FCF margin in CQ2’26 | 18% |
| Implied TTM revenue by CQ2’26 | $42.8B |
MU stock reverse cash flow valuation model B. Data source: S&P Cap IQ, author
Therefore, we used an assumed entry price of $42.25 (MU stock’s intermediate support level) to model the market’s possible perception of its valuation. We believe the market is expecting MU stock to underperform (thus lowering our hurdle rate to 8%). As a result, it requires a higher FCF yield, leveraging its current yield of 12%. Consequently, we need Micron to deliver revenue of $42.8B by CQ2’26.
The consensus estimates suggest that Micron could deliver revenue of $40.38B by FY23. Therefore, the market could be pricing in a potentially anemic growth in Micron’s topline through CQ2’26.
Is MU Stock A Buy, Sell, Or Hold?
We reiterate our Hold rating in MU stock. We encourage investors to wait for the stock to form a sustained base, given its poor price action dynamics.
Furthermore, our valuation model suggests that the market believes Micron could underperform moving forward.
Therefore, investors need to ask themselves whether they are willing to hold a potentially underperforming stock, given the current discounts in the tech market.
Otherwise, they should wait for the market to inform them of the appropriate entry point for MU stock.
Be the first to comment