

LeoPatrizi/E+ via Getty Images
Introduction
Danaher Corp. (NYSE:DHR) is a company focused on developing and manufacturing technologies for the life sciences, diagnostics, environmental and other sectors. I came across Danaher indirectly because I used to work with many of its subsidiaries’ products, of which I was (and still am) a big fan. This qualifies Danaher as a true “Peter Lynch” stock – invest in what you understand.
In this article, I will provide an overview of the company, its business segments, growth strategy, profitability, balance sheet quality, dividend safety and growth prospects. I will also highlight the key risks and conclude with a valuation showing at what price I would consider buying this conglomerate of leading life science and diagnostics brands.
Company Overview
Danaher grows mainly through acquisitions, so it is hardly surprising that its businesses include a number of well-known and leading brands. The company has an excellent track record, and its management team has a knack for making profitable acquisitions, much like UK-based Halma plc (OTCPK:HALMY, OTCPK:HLMAF), which I covered in detail earlier this year.
Danaher is divided into three reportable segments – Life Sciences, Diagnostics and Environmental & Applied Solutions:
Life Sciences is Danaher’s flagship segment, contributing 51% to 2021 sales and having a 29% operating margin. The segment was formed through the acquisition of Leica Microsystems, and later added AB Sciex (probably best known for its mass spectrometers), Molecular Devices (plate readers), Beckman Coulter (photometers, centrifuges), Phenomenex (chromatography columns), IDT, Cytiva, and others.
In the Diagnostics segment, Danaher develops and manufactures clinical instruments and consumables and provides software and services to e.g., hospitals and laboratories. With a 33% share of sales in 2021, it is Danaher’s second-largest segment, also in terms of operating profitability (23.5% operating margin in 2021). In addition to brands such as Hemocue, Cepheid, and Mammatome, some of the brands mentioned above are also relevant to this segment (e.g., Leica and Beckman).
The Environmental & Applied Solutions segment is the smallest segment of DHR with a sales contribution of 16% in 2021 and also the weakest operating margin of 22.7%. Its main business segments are water quality analysis (brands such as Aquatic Informatics, Hach, Pall Water, Sea-Bird, and Chemtreat) and product identification. The latter subsegment develops and manufactures printers, grading equipment, software and consumables for packaging design, appearance management, quality management, and traceability. Companies that are familiar to people in the design industry are X-Rite, Pantone and Videojet. Considering that the product identification sub-segment in particular does not necessarily fit well into the otherwise life sciences, analytics and diagnostics-focused portfolio, it does not seem surprising that Danaher recently announced its intention to spin off its Environmental & Applied Solutions segment to create an independent publicly traded company.
In its annual reports, Danaher makes a bold commitment, having united its businesses under the Danaher Business System. The company puts customers first, strives for continuous innovation, values team spirit, and – nota bene – competes for shareholders. It has adopted Japanese Kaizen principles, which means that the company constantly challenges its own assumptions in order to enhance customer well-being with a win-win solution for all stakeholders while ensuring a lean manufacturing footprint. Kaizen was made famous by Japanese automaker Toyota, which adopted its principles in response to the economic crisis in Japan after World War II.
Danaher is placing increasing emphasis on recurring revenue, which naturally reduces cash flow volatility, improves plannability, and ultimately increases the reliability of shareholder returns – a characteristic I find particularly important as a long-term investor. The percentage of recurring revenue has increased steadily since 2018 (the first year such revenue segmentation was reported), from 68.5% to 74.0% in 2021. In the first nine months of 2022, the percentage of recurring revenue increased further to 74.2%, a 2.0 percentage point increase from the first nine months of 2021.
Growth And Profitability Of DHR
As mentioned earlier, Danaher is growing mainly through acquisitions. Between 2012 and 2021, the company spent about $60 billion on acquisitions, while its revenue grew at a compound annual growth rate (CAGR) of 5.5% over the same period – not exactly a strong performance for such a company, one might think. However, over the same period, operating profit grew at a CAGR of more than 10%, confirming that management is doing a good job of selecting the most profitable businesses and divesting unprofitable assets. As shown in Figure 1, this margin expansion has mainly taken place in recent years. This is a major reason for the recent valuation multiple expansion of DHR (see final section). The consensus expectation for 2022 sales is $30.8 billion, representing 5% year-over-year growth. Given the unabated need for innovation in diagnostics, analytical and laboratory equipment, consumables, and software, Danaher should be able to continue to deliver healthy growth, but the rising cost of capital needs to be considered in this context. Of course, future success depends heavily on corporate culture and management capabilities, as I will explain in the section on risks.
Figure 1: Danaher’s [DHR] operating and normalized free cash flow margins (own work, based on the company’s 2010 to 2021 10-Ks, the 2022 10-Q3 and own estimates)![Figure 1: Danaher's [DHR] operating and normalized free cash flow margins (own work, based on the company's 2010 to 2021 10-Ks, the 2022 10-Q3 and own estimates)](https://static.seekingalpha.com/uploads/2022/12/14/49694823-16710247853102412_origin.png)
As my regular readers know, I spend much more time analyzing cash flow statements than income statements because, after all, shareholder returns such as dividends and share buybacks must be paid with cash. Therefore, it is encouraging to see that Danaher’s free cash flow (FCF, normalized with respect to working capital movements and adjusted for stock-based compensation expenses) has grown in line with operating income at a CAGR of more than 10%. Danaher partially finances its acquisition through capital increases and does not normally buy back its own shares. Therefore, FCF per share could be expected to grow at a slower pace. However, due to Danaher’s disciplined approach, FCF growth per share was only 40 basis points weaker. In addition, this does not take into account the spin-off of the Test & Measurement segment, which began trading as a separate company under the name Fortive (FTV) in 2016.
Because of Danaher’s strong – and, more importantly, reliable – cash flow conversion, its return on invested capital (ROIC) and cash return on invested capital (CROIC) are largely in line. ROIC and CROIC are my favorite measures of profitability, and I consider them particularly important in the context of companies that grow through acquisition. During periods of very low cost of debt, it is so easy to waste money on investments that are not worthwhile and ultimately provide little (or negative) return to the owners of the acquiring company. Since CROIC relates free cash flow to invested capital, it should be compared to the cost of equity (COE), which of course is not trivial to determine. I am not a fan of volatility-based determinations of COE, as done in the Capital Asset Pricing Model (CAPM), and instead consider my own assessment of business risks and future prospects. I believe Danaher is a relatively conservatively managed company with a solid track record. However, given that its economic moat is largely dependent on management’s continued ability to make profitable acquisitions, I believe a 5% equity risk premium on top of the current risk-free rate (30-year U.S. government bond yield) is appropriate. Figure 2 compares Danaher’s CROIC to its COE, which was determined using the risk-free interest rate at the end of each year. Danaher’s CROIC is relatively modest, especially compared to what I consider to be a not-too-aggressive cost of equity. At times, Danaher was not even able to generate an excess return on its invested capital. This is also true for ROIC, which was at or below the company’s weighted average cost of capital (WACC) in 2016, 2017, 2019, and 2020 (not shown). When deciding on an appropriate valuation for Danaher stock, one should keep in mind the company’s rather uninspiring profitability.
Figure 2: Danaher’s [DHR] CROIC compared to COE, based on a 5% equity risk premium on top of each year end’s 30-year Treasury yield (own work, based on the company’s 2010 to 2022 10-Ks, the 2022 10-Q3 and own estimates)![Figure 2: Danaher's [DHR] CROIC compared to COE, based on a 5% equity risk premium on top of each year end's 30-year Treasury yield (own work, based on the company's 2010 to 2022 10-Ks, the 2022 10-Q3 and own estimates)](https://static.seekingalpha.com/uploads/2022/12/14/49694823-16710247623321695_origin.png)
Danaher’s somewhat uninspired profitability becomes even more apparent when looking at the cash conversion cycle (CCC, a combined measure of the company’s working capital management efficiency) and asset turnover. DHR’s CCC has been very stable over the past decade at 72 days ± 7 days. This in itself is not a negative, but I prefer to see a company reduce its CCC over the years, as it may indicate a superior position compared to its suppliers and customers, improving inventory management, or a focus on less complex products. Danaher’s asset turnover ratio has declined from about 0.56 to 0.58 in the earlier years of the 2010s to only about 0.37 recently. That means the company is generating less revenue per dollar of assets. Its main competitor, Thermo Fisher Scientific Inc. (TMO), which follows a similar business strategy, has maintained its asset turnover at around 0.45 since 2012 (Figure 3), but its CCC has remained similarly stable to DHR’s. Over the years, inventory days increased for both companies, suggesting that both are increasingly focused on more complex products, which is hardly surprising given the technology of analytical instruments and their ever-increasing capabilities. To offset this negative effect, both companies have modified their payment terms with customers and suppliers. TMO has been more aggressive in stretching its payment terms with suppliers, while DHR has focused on streamlining its accounts receivable terms in recent years.
Figure 3: Danaher’s [DHR] and Thermo Fisher Scientific’s [TMO] asset turnover (own work, based on the two companies’ 2011 to 2021 10-Ks)![Figure 3: Danaher's [DHR] and Thermo Fisher Scientific's [TMO] asset turnover (own work, based on the two companies' 2011 to 2021 10-Ks)](https://static.seekingalpha.com/uploads/2022/12/14/49694823-16710246261173778_origin.png)
DHR’s Balance Sheet Quality And A Word On The Dividend
As already indicated, Danaher occasionally resorts to capital increases to finance acquisitions. This leads to the logical conclusion that the company’s balance sheet must be quite solid. DHR’s focus on debt- and equity-financed acquisitions is the main reason that its leverage ratio, as measured by net debt to normalized free cash flow, is usually very manageable. Sometimes, when DHR has had a somewhat large acquisition to digest, the leverage ratio has risen to a – still manageable – 4 to 5 years of free cash flow, but it is usually much lower (Figure 4).
Figure 4: Danaher’s [DHR] leverage in terms of net debt to normalized free cash flow (own work, based on the company’s 2010 to 2021 10-Ks, the 2022 10-Q3 and own estimates)![Figure 4: Danaher's [DHR] leverage in terms of net debt to normalized free cash flow (own work, based on the company's 2010 to 2021 10-Ks, the 2022 10-Q3 and own estimates)](https://static.seekingalpha.com/uploads/2022/12/14/49694823-16710248230754151_origin.png)
Danaher’s long-term debt rating was recently upgraded one notch from Baa1 (lower medium grade, BBB+ S&P equivalent) to A3 (upper medium grade, A- S&P equivalent). Moody’s highlighted solid operating performance and cash flow, even as COVID-19-related revenues decline. The rating agency expects strong cash flow going forward, providing the company with the flexibility to make acquisitions and reduce debt.
DHR’s maturity profile (Figure 5) is of little concern in light of the company’s strong normalized free cash flow of around $7 billion a year, although it is somewhat more skewed toward shorter maturities. Of the $6.1 billion maturing between 2022 and 2024, $2.8 billion is commercial paper, split roughly 50/50 between U.S. dollars and euros.
Figure 5: Danaher’s [DHR] debt maturity profile at the end of 2021 (own work, based on the company’s 2021 10-K)![Figure 5: Danaher's [DHR] debt maturity profile at the end of 2021 (own work, based on the company's 2021 10-K)](https://static.seekingalpha.com/uploads/2022/12/14/49694823-1671024708995795_origin.png)
From an interest coverage perspective, Danaher is very well positioned (Figure 6). An interest coverage ratio of approximately 20 to 30 times free cash flow before interest is very conservative and indicates that Danaher will not be significantly affected if interest rates remain higher for a longer period of time. The company’s conservative interest coverage ratio is due in part to Danaher’s significant exposure to euro-denominated debt. I welcome this strategy, as I believe the European Central Bank is in a worse position than the Federal Reserve with respect to rate hikes. However, this aspect should not be over-interpreted, as the company’s foreign currency exposure is certainly adequately hedged.
Figure 6: Danaher’s [DHR] interest coverage ratio (own work, based on the company’s 2010 to 2021 10-Ks, the 2022 10-Q3 and own estimates)![Figure 6: Danaher's [DHR] interest coverage ratio (own work, based on the company's 2010 to 2021 10-Ks, the 2022 10-Q3 and own estimates)](https://static.seekingalpha.com/uploads/2022/12/14/49694823-1671024837959674_origin.png)
The company’s strong balance sheet and only moderately cyclical business model make DHR an ideal candidate for long-term investors. The company’s dividend payout ratio is extremely conservative, at only about 10% to 15% of normalized free cash flow. This leaves ample room for growth, even in times of weaker earnings growth. In this context, it seems worth mentioning that Danaher’s dividend yield is currently very low at only 0.36%. This is surprising given that the ten-year dividend CAGR is a whopping 29% (adjusted for the 2016 spinoff) and, given the above-mentioned earnings growth, suggests that Danaher stock has experienced significant multiple expansion. Income-seeking investors must therefore remain very patient, also because Danaher’s dividend growth has slowed in recent years, as evidenced by its three-year CAGR of 13.7%. If the company continues to raise the dividend at this pace, it would take more than 18 years for the yield on cost to match the current yield on 30-year Treasury bonds. Therefore, DHR is best seen as a growth stock because capital gains far exceed returns due to dividends. An investment in DHR twenty years ago far outperformed the S&P 500 (SPY) – a long-term investor would look at a CAGR of 16.3% compared to 6.9% for the S&P 500. A hypothetical $10,000 investment in DHR would have appreciated to an almost unbelievable $236,000, of which only about $5,000 is attributable to dividends.
Risks Underlying And Investment In DHR
Thanks to its focus on the life sciences, diagnostics and environment solutions businesses, Danaher is only moderately sensitive to economic cycles. Of course, academic research budgets, as well as pharmaceutical industry R&D budgets, could be cut in the event of a significant economic downturn. However, I don’t think this is an undue risk, since academic research budgets in particular are allocated and “funded” by governments, which have an incentive to kick the can down the road rather than impose unpopular austerity programs.
Because Danaher is a global company, but reports in U.S. dollars, its profits are sensitive to exchange rate fluctuations. 60% of Danaher’s 2021 sales were generated in regions other than North America. Note that the North America segment includes an unknown contribution from Canada, but I wouldn’t necessarily consider that a risk factor because the U.S. dollar and the Canadian dollar tend to be positively correlated – except for occasional “flight-to-safety” price action in the U.S. dollar. Even though more than 60% of sales are not in U.S. dollars, it should not be forgotten that Danaher, like probably all internationally active companies, hedges its currency exposure and also has a significant amount of foreign currency debt on its balance sheet, as noted above and illustrated in Figure 7.
Figure 7: Danaher’s [DHR] debt, broken down by currency, values represent outstanding amounts according to Note 14 on p. 93 (own work, based on the company’s 2021 10-K)![Figure 7: Danaher's [DHR] debt, broken down by currency, values represent outstanding amounts according to Note 14 on p. 93 (own work, based on the company's 2021 10-K)](https://static.seekingalpha.com/uploads/2022/12/14/49694823-16710248566531558_origin.png)
Of course, like all companies that grow primarily through acquisitions, Danaher must be careful to continue to properly integrate the acquired businesses. At the same time, management must be careful not to overpay, as goodwill impairments and a decline in return on invested capital could quickly lead to a deterioration in valuation. Even if management has a good hand for profitable acquisitions, it should not be forgotten that the goodwill portion of Danaher’s balance sheet is currently very high at 50% of total assets. Other intangible assets amounted to another 27% of total assets at the end of 2021.
The risk of overpaying is significant, in my opinion, because companies in the diagnostics, life sciences, and environmental analytics segments are generally quite expensive. As mentioned earlier, Danaher has a solid balance sheet, largely due to management’s knack for profitable acquisitions and the partial use of capital increases to fund acquisitions. Opinions differ on whether we will return to another period of “easy money policies” or whether capital will remain comparatively expensive for longer. I am in the latter camp, so I think it is reasonable to expect somewhat more modest performance going forward as the cost of capital rises while valuations may remain at robust levels. If the cost of capital remains high or increases further, investors’ willingness to participate in capital raises could weaken, and Danaher could raise less capital than expected and instead have to rely on debt, weakening its balance sheet.
Other risks include input cost inflation, supply chain issues, working capital inefficiencies due to exogenous events, and a slowdown in growth due to the fading pandemic, from which Danaher has benefited greatly. These risks – I believe – are clearly visible today.
Conclusion, And The Price At Which I’d Buy Danaher
Danaher is a well-managed company that serves several important industries that will most certainly still be in solid demand thirty years from now. The management team has a knack for acquisitions, and the company’s balance sheet is in excellent shape, considering that $60 billion has been spent on acquisitions over the past decade. I consider Danaher to be a typical Peter Lynch-style investment, as I have personally worked and learned to appreciate the quality and reliability of Danaher’s instruments, consumables and services. Overall, I believe the stock is a solid long-term and, above all, future-proof investment.
But even though I don’t really believe in market timing, I do make sure that I don’t overpay for my investments. Danaher obviously benefited greatly from the pandemic and used the opportunity for further portfolio optimization. Market participants rewarded the company’s strong performance, especially in recent years. The stock has seen considerable price appreciation. Danaher’s business model is relatively recession-resistant, but also entails risks. Rising capital costs will reduce returns, and the risk of overpaying for acquisitions increases. In addition, Danaher has a disproportionate exposure to foreign economies, making its earnings vulnerable to exchange rate fluctuations and regional economic downturns.
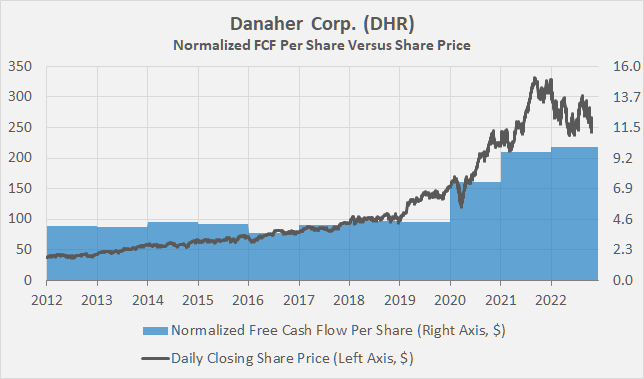
For these reasons, and taking into account the stock’s multiple expansion in recent years, I wouldn’t bet on the stock holding up overly well in an economic downturn. With a current share price of around $280, DHR appears to be overvalued, as shown in the FAST Graphs chart in Figure 8. I don’t believe the company’s 15% adjusted earnings growth and relatively modest ROIC and CROIC justify a current price-to-earnings ratio of 26, also because normalized free cash flow growth has been much weaker and largely achieved in recent years (see Figure 9). The growth was at least partly fueled by the low interest rate environment, from which Danaher benefited greatly – its weighted average interest rate was only about 1.8% (!) at the end of 2021.
Figure 8: FAST Graphs plot for Danaher [DHR] (obtained on December 14 with permission from www.fastgraphs.com) Figure 9: Danaher’s free cash flow per share compared to its share price (own work, based on the company’s 2010 to 2021 10-Ks, the 2022 10-Q3, own estimates and the daily closing price of DHR)![Figure 8: FAST Graphs plot for Danaher [DHR] (obtained on December 14 with permission from www.fastgraphs.com)](https://static.seekingalpha.com/uploads/2022/12/14/49694823-16710248987368262_origin.png)
In principle, Danaher is rightly valued like a growth stock, but I believe that growth is likely to slow in the future for the reasons mentioned above. The current dividend yield of 0.36% makes DHR unattractive to income-seeking investors. At the same time, the dividend yield underscores DHR’s overvaluation, as the five-year average dividend yield is 0.42%, according to Seeking Alpha. It should also be remembered that the historical dividend yield is largely a result of the low interest rate environment, which pushed investors out on the risk curve and led to a disproportionate appreciation in equity valuations.
Since I expect Danaher’s free cash flow growth to weaken going forward, it is only reasonable to expect valuation multiples to contract accordingly. I can envision opening a small initial position in the stock at around $200, which would equate to an expected free cash flow yield of 5% in 2022 – certainly not a bargain, but reasonable for this sector. From a discounted cash flow analysis perspective, DHR would need to grow at a terminal rate of over 5% to justify a $200 share price, and if a cost of equity of 8.8% is deemed reasonable. Based on the company’s FCF growth in the past, such an expectation for the future does not seem unreasonably high, but one must keep in mind the background against which this growth was achieved. Therefore, I would not be extremely bullish on the stock until it reaches around $150, which admittedly may seem like an unrealistically low expectation. However, it should not be forgotten that Danaher – of course, not the diversified and highly profitable company it is today (e.g., capex ratio of typically only about 15%) – was trading at a price-to-earnings ratio of about 13 during the Great Financial Crisis.
Thank you very much for taking the time to read my article. In case of any questions or comments, I am very happy to read from you in the comments section below.
Be the first to comment