

mphillips007
As one of America’s largest homebuilders, D.R. Horton (NYSE:DHI) is a good proxy for household growth in the country. With net income increasing 53% in the latest quarterly report, DHI shows no sign of letting up despite the potential risk of a recession looming. But at seven times earnings, it’s hard to ignore how cheap the stock is trading.
With a healthy backlog in sales orders, which amounts to almost $12 billion in value or 43% of last year’s annual revenue, D.R. Horton has a meaningful moat to insulate itself in the event the economy contracts sharply in the near term. (It’s worth noting that the value of sales orders would decline due to cancelled orders, but would not disappear entirely.) Still, there are signs that growth may be slowing.
Google Finance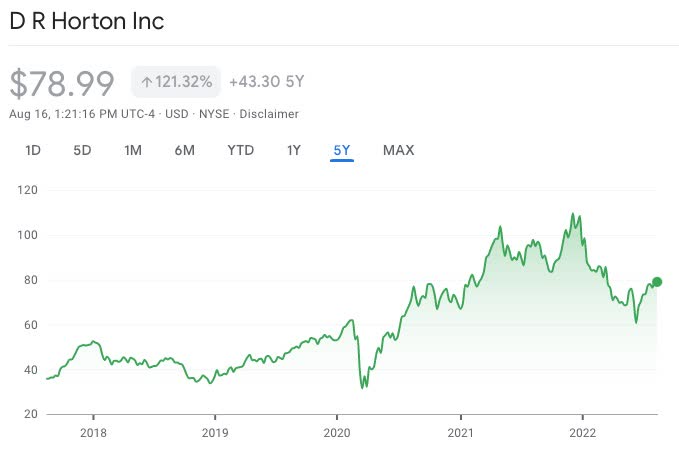
Recession Risk
In the most recent quarterly report dated July 21st, the company reported that net sales orders decreased 7% for the quarter, and cancellation rates increased to 24% from 17% from the prior year. Acknowledging the recent headwinds, Donald R. Horton, Chairman of the Board, stated:
In June, we began to see a moderation in housing demand as mortgage interest rates increased substantially and inflationary pressures remained elevated.
Yet, the company remains confident:
Although these pressures may persist for some time, we believe we are well-positioned to meet changing market conditions.
In July, new single-family home purchases fell by 8.1%, which is the biggest drop in more than two years. Since housing is a recessionary indicator, a potentially larger correction may be ahead. The chart below shows that when home inventories exceed a 3 ½ month supply, history has shown that it has led to a recession.
Capital Group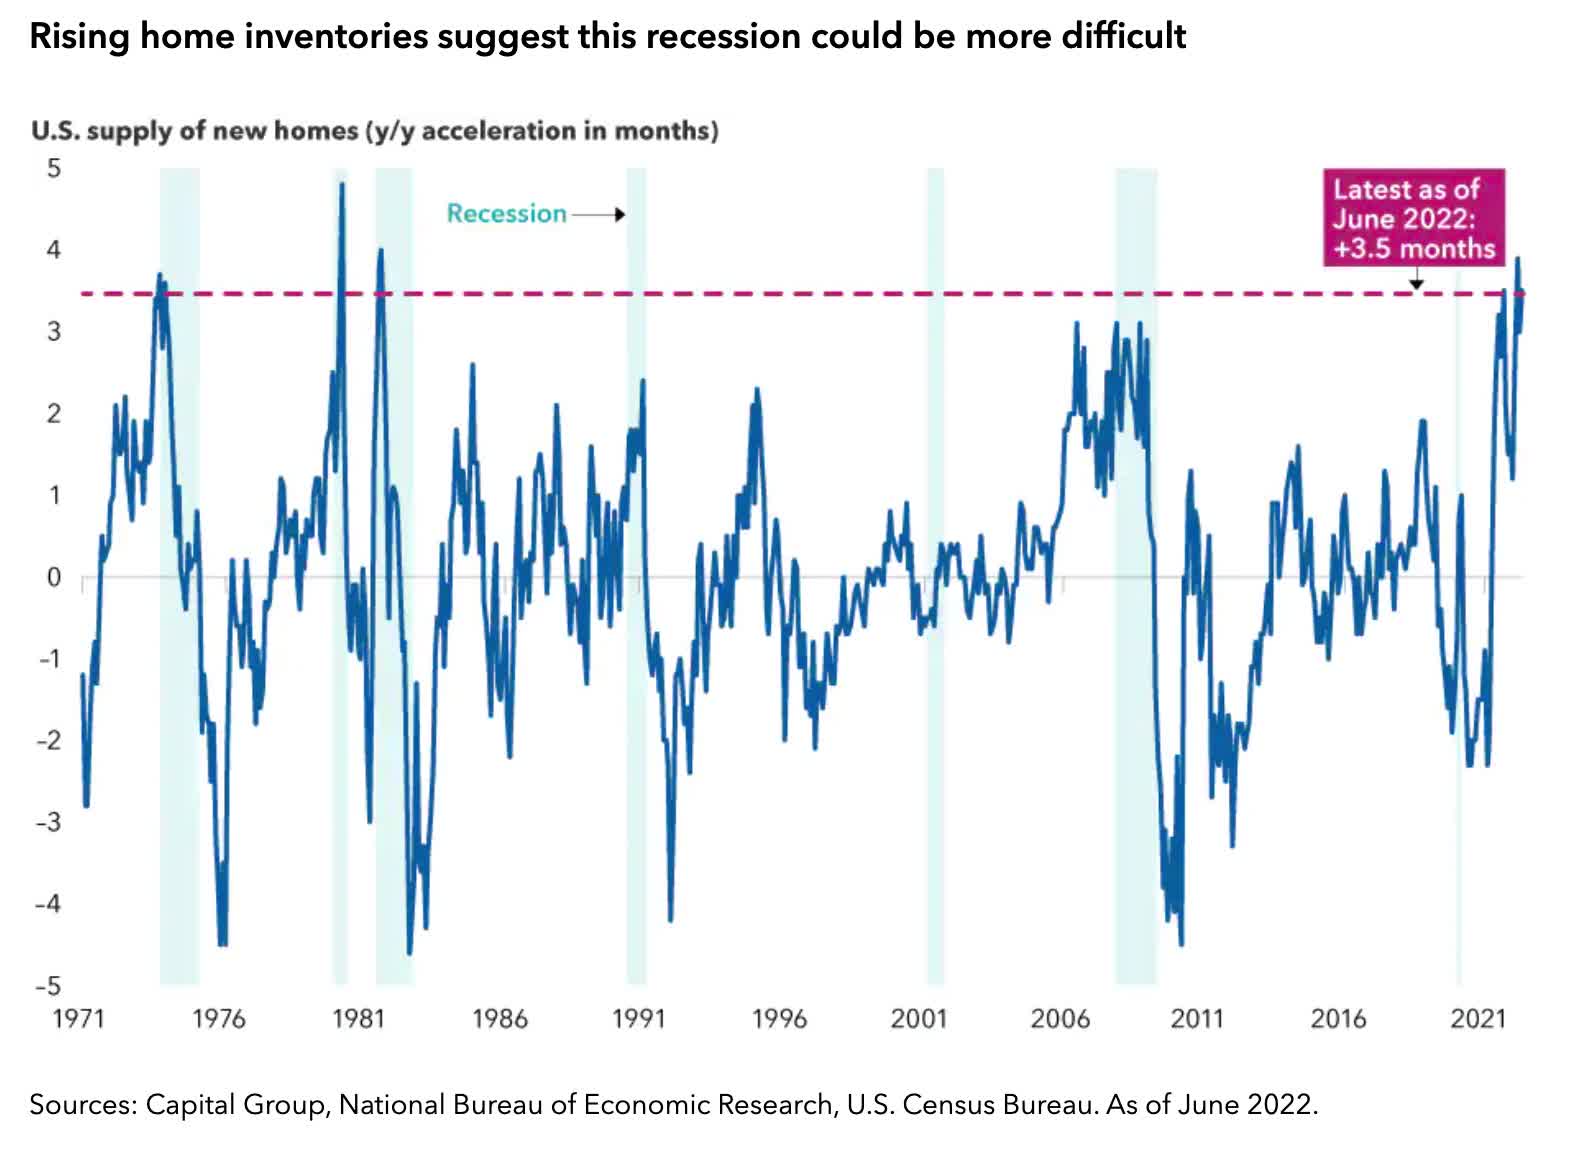
Since the official arbiter of U.S. recessions, the National Bureau of Economic Research, typically shares its findings after a recession has started, it is possible that the U.S. economy is already in a recession. As a result, D.R. Horton’s next quarterly report will be more meaningful for investors than the previous one.
Analysis
Buy Rating: Despite the risk of a recession, I have a Buy rating for D.R. Horton’s stock with a five-year target price of $262 per share.
In my analysis of D.R. Horton’s stock, I believe the company can maintain a 15% net margin over the next 5 years. In anticipation of a recession, I’ve lowered the company’s revenue growth from its most recent annual growth rate of 37% to 18%, which is more in line with its five year average. Finally, I anticipate that the stock’s price-to-earnings ratio (P/E) will expand from 7 to 11 as the overall market recovers.
Below is a table contrasting the company’s current metrics and stock price to the 5-year estimate:
| D.R. Horton |
Current* (as of 8/16/22) |
5-Year Estimate |
|
Revenue (in millions) |
$27,770 |
$53,785 |
|
Net Margin (%) |
15.03% |
15.03% |
|
Net Income (in millions) |
$4,176 |
$8,084 |
|
# Outstanding Shares |
365,800,000 |
339,000,000 |
|
Net Income per Share |
$11.41 per share |
$23.85 per share |
|
Price/Earnings (P/E) Ratio |
6.9 |
11 |
|
Stock Price |
$78.82 |
$262 |
Source of company metrics: Morningstar, D.R. Horton
*Current metrics based on fiscal year end 2021
Author’s Note
The purpose of my analysis is to provide a concise and transparent calculation in deriving a price target in the future, which in my hope will show the reader what their potential return is if they were to buy the stock (for buy ratings) at current prices.
As a long term investor, I provide a 5-year price target. In identifying a stock for a Buy rating, I look for stocks that can double in price within 5 years. This would produce close to a 20% annual return which would still exceed the market’s long term average annual return of 8.91%.
When estimating a target price in the future, I try to be as transparent as possible in the methodology and metrics I use in my analysis and research to gain the reader’s confidence in my conclusions. This is a methodology that I have successfully used for over 25 years as an investment adviser and portfolio manager through the bull market of the 1990s, the dotcom bubble, the credit crisis of 2008-2009 and more recently through the Great Resignation.
To better understand how to read the table above, read my previous article Meta: Attractive Valuation.
Be the first to comment