


piranka
Cyxtera (NASDAQ:CYXT) came public via a SPAC in the summer of 2021. The company is a sub-scale operator of data centers leased from facility owners. The leasing strategy, high-cost retail model, low space utilization as evidenced by 14 of 23 center with below 70% utilization, and excess leverage drive bottom of the industry cash generation. We believe that financial performance is unlikely to improve going forward. Continued negative leasing dynamics and an ill-considered financial strategy exposing the company to cost inflation and rising rates will likely pressure margins further going forward.
The company reported negative financial results for 2Q22 on August 11th. Financial underperformance left the company with only $40M in cash after burning $30M in the quarter. Management lowered guidance for 2H22 modestly in expectation of cost increases.
In testimony to the precariously low cash balances, the company filed an S-3 shelf registration for $300M in new securities and the sale of 130M of shares owned by insiders and the SPAC’s PIPE investors. We believe that the offering will be the catalyst that begins to send the stock toward fair value of $2-3.
Key issues include:
Cannot generate cash from operations to cover necessary CapEx – Low capacity utilization and poor service offering results in sub-par cash flow from operations; coupled with high CapEx requirements drives the company’s large cash burn. In 2021, the company generated only $25.8M in CFO and negative free cash flow of ($51.7M). We believe that further low quality offerings will likely pressure utilization and cash flows going forward.
Crippling levels of leverage – The company’s excessive debt load creates an interest expense that consumes an average of 80-85% of all cash generated by the business. Leverage makes CYXT’s financial model unsustainable, in our view. One of the company’s revolvers was not renewed, the other revolver is due in 11/23 and $868M of debt is due in 2024.
Insiders are selling – The S-3 also includes 130M shares of recently unlocked shares owned by insiders, the SPAC sponsor, and PIPE investors. The float will increase roughly 4x from ~48M shares to 178M plus whatever is sold in the offering.
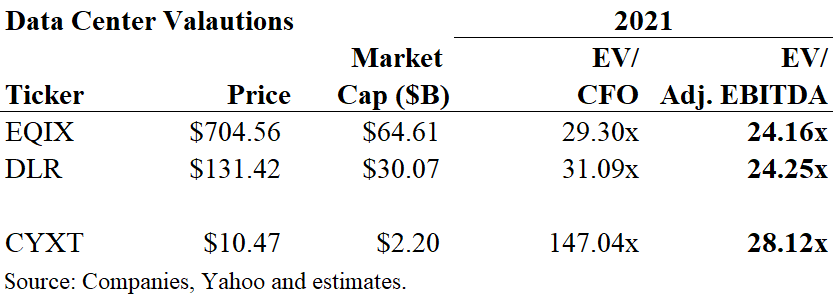
High comparative valuation – Despite being the weakest public data center operator, CYXT currently trades at an EV/Adjuste868d EBITDA of 30x compared to 25x for peers, which convert ~80% of EBITDA to cash flow compared to 4% for CYXT. A discounted multiple indicates the stock is worth $2-3 or 70-80% below current levels.
CYXT’s collection of poor, leased retail data center assets makes for a low margin business in the best case. We believe that excess leverage makes the company’s model unsustainable.
I. An Unsustainable Business Model
We believe the company’s business model is fundamentally flawed. As a provider of retail colocation space, labor and engineering are significant costs. Leasing the facilities fixes the costs and subjects the firm to potential rent increases, but persistently low utilization results in sub-par revenue and low margins.
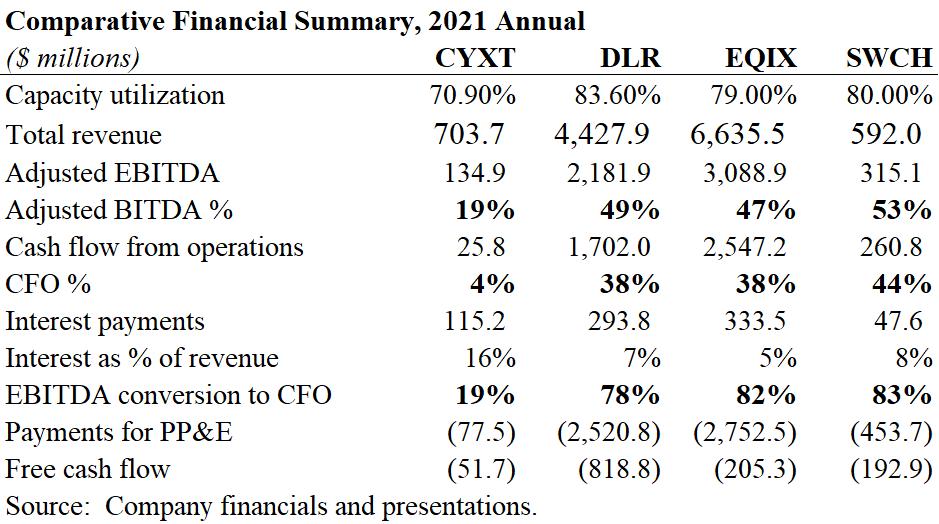
The company’s flawed business model results in very weak cash flow relative to the other players in the data storage space, as indicated in the table below.
Company filings and estimates.
CYXT is the weakest financial performer of the group. Low utilization leads to poor EBITDA. (Note that Adjusted EBITDA is constructed to provide comparable metrics. For CYXT we exclude stock-based compensation and changed from warrant liability. For DLR and EQIX, we exclude stock-based compensation, gains on sale and losses on debt extinguishment.) Cash flow from operations in 2021of $25.8M equates to only 4% of revenues, compared with ~40% for the peer group.
Weak cash generation is a long-standing problem. Between 2019 and 2Q22, the company generated only a total of $162.7M in cash from operations and accumulated aggregate negative free cash flow of ($160.1M).
The company has pursued what we view as short-term financing fixes. In 1Q22, the company completed a sales leaseback that generated $10M. The company factors receivables for short-term financing. During 2021, factoring resulted in net proceeds of $99.5M net of fees. Factoring reduces receivables and increases cash flow from operations. In 1H22, the company factored $11M of receivables.
The factoring likely creates a maximum 30-day financing, given the company’s monthly billing cycle. The discount paid implies a 1.8% cost, which is annualized to ~24%. In our view, 24% interest rate for such short-term financing is indicative of severe cash shortages.
We believe the sub-par cash flow evident in 2021 is unlikely to change going forward. In 1H22, the company generated only $11.7M in cash flow from operations. Including $62M of CapEx, free cash flow was ($50.6M) for the period.
Management lowered guidance modestly for 2H22, reflecting higher expected costs. We estimate that the company will burn an additional $50M in the period taking full-year cash burn to ~($100M).
Management strategy may exacerbate the margin problem going forward. Unlike most peers, CYXT does not hedge the cost of power. The company rents mostly on an ‘all in’ basis, including power. Although the company can pass along 90% of power cost increases, they absorb 10% and collect the remainder with a lag. Additionally, all outstanding financial debt is floating rate, exposing the company to rising rates, which will eat-away at the already razor thin cash margin.
Cost inflation has already had an impact. For 1H22, the cost of utilities was up $11.5M, increasing cost of revenues 6% for the period. Management expects power cost inflation to accelerate in 2H22. The company’s debt is LIBOR based, which has increased to 2.92% from 0.12% a year ago. The debt reset should raise the cost of interest making the cash flow margin yet smaller.
II. Persistently Low Capacity Utilization
Since purchasing the business in 2017, CYXT has not been able to consistently increase utilization. Between 4Q19, the first period for which we have data, and 1Q22, total occupancy only increased to 70% from 67%. Occupancy as of 2Q22 was 73.33%. We consider the unusually high net-add during the quarter an anomaly; occupancy statistics available in the quarterly supplemental suggest it was driven primarily by a significant sale in a large market.
Going forward, we believe the leasing dynamics will be negative, pressuring occupancy. Four factors drive the negative dynamics.
1. Built-in occupancy headwinds – Lumen Technologies (LUMN), formerly CenturyLink from which CYXT was spun off, was 10% of revenues in 2021. Lumen’s contract ends in April 2025 and has staggered disconnects until then creating leasing headwinds.
2. We believe the company offers a low-quality service. This is evidenced by the fact that the company has not been successful leasing space in high-demand markets with low vacancy. As an example, in 1Q20, CYXT opened in Amsterdam with 12,338 square feet. After renting only 1,029 square feet as of 4Q21, the company increased space to 23,655 square feet. According to Cushman and Wakefield, Amsterdam is one of the world’s 10 largest data center markets with total vacancy less than 10%, yet according to company filings, CYXT has only rented 1,169 square feet in 2½ years for a 95% vacancy rate.
CYXT’s inability to rent space in a high demand market suggests the product does not meet customer standards. Current and former employees writing on Glassdoor support the low-quality thesis with posts stating that CYXT’s maintenance and customer service has eroded substantially since the company was purchased by the private equity owners.
3. Increasing competition in key markets. 51% of CYXT’s rented space is in five markets that have significant amounts of data center space under construction, according to Cushman and Wakefield. According to company occupancy statistics, in 3 of 5 markets, the company has had very limited success growing occupancy between 4Q19 and 2Q22 despite high demand and low vacancy. We believe that as new space comes online in these highly competitive markets, the company will be vulnerable to customer losses.
4. The struggle in lackluster markets will intensify – Top-10 markets accounted for 98% of all rental space gains between 4Q19 and 2Q22. CYXT’s remaining 14 markets contributed only 2%. 7 of the 14 markets have lower occupancy now than in 4Q19. This excludes the two most underperforming markets that were shuttered, and are not included in the 14. 3 of the 7 with occupancy increases over the period are near capacity, severely limiting further upside in the markets. This leaves a mere 4 out of 14 markets with a clear path to stronger occupancy. The overall dynamics in markets outside the top-10 indicate pressure on occupancy will increase going forward.
Granular analysis of occupancy trends suggests that CYXT’s protracted efforts to reposition company assets and build occupancy are far from over. We believe a mix of low quality product, increasing competition in strong markets and presence in many lackluster markets means the balance of pressure on occupancy is to the downside.
III. Over-levered and Needs to Raise Capital
CYXT has a total of $2B in debt, consisting of $1.1B in capital leases and $888M of financial debt. The company had a $20M revolving credit line due May 2022 that was not renewed. To repay the facility, the company drew down $20M from a new revolving line due November 2023.
$868M in first lien facilities mature in 2024. All facilities are LIBOR plus a margin of 3-4%. As of 2Q22, the rate on $775M was 4% and $95M 5%.
The 3-month LIBOR has increased to 2.9% from 0.12% a year ago. We estimate the interest expense on the credit facilities can increase by $16.5M to ~$53M upon reset. Put in context, a $16.5M increase in interest expense amounts to 64% of all cash flow from operations generated in 2021.
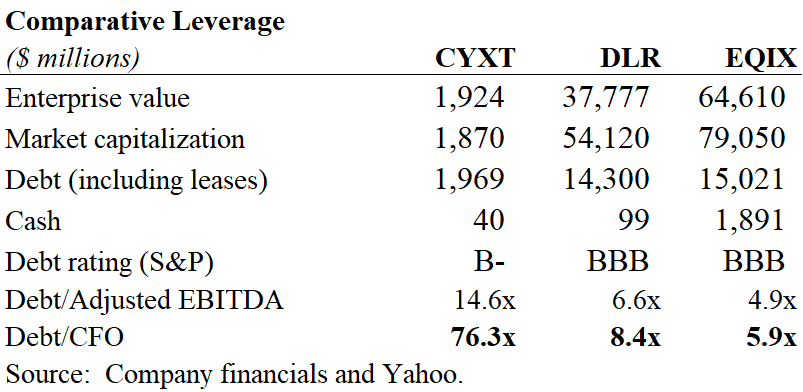
CYXT is the most highly-levered company in the group as shown in the table below.
Company filings and estimates.
Debt to 2021 Adjusted EBTIDA of 14.6x compares to 5-7x for the peers. Debt to cash flow from operations of 76x leads to an unsustainably high interest rate expense.
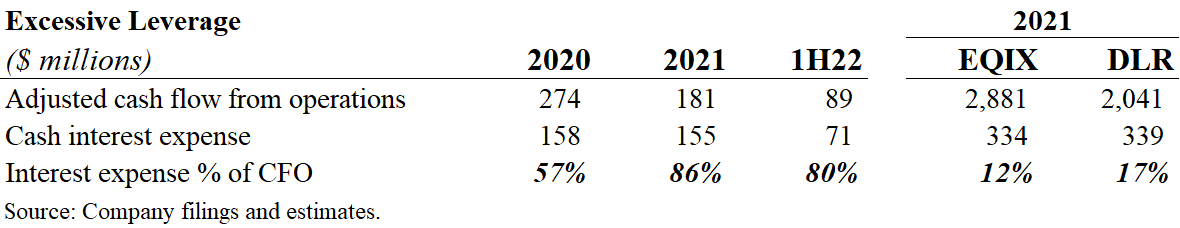
In the table below we adjust CFO by adding-back the cash interest expense. We then show the cost of interest as a percentage of adjusted cash flow. We provide the statistic for EQIX and DLR for comparative purposes.
Company filings and estimates.
In 2020, GAAP cash flow from operations was unusually high as the company squeezed all it could from working capital to dress for a transaction. In 2021 and 1H22, 80-86% of cash flow went to cash interest payments.
S&P stated that it could lower the rating should the company’s path to delever become less credible. Consequently, we believe it is likely that the company uses some cash from the pending equity offering to repay debt. We believe the long-standing failure to improve financial performance coupled with higher rates would make refinancing the entire balance difficult and very expensive.
We believe the cash shortages and current price above the $10 SPAC IPO will drive the company to raise as much cash as possible with the current shelf-registration.
IV. The Comparative Valuation is High – a White Knight Unlikely
In April 2022, less than 1-year after going public via the SPAC, management announced that they had hired bankers to explore strategic options. We think a buyer at the current valuation is unlikely to emerge – the equity is significantly overvalued at the current stock price of $10.50.
We look at value using cash flow and an EBITDA metric. We constructed an adjusted EBITDA metric that is comparable across the publicly traded data centers. The results are shown in the table below.
Company filings and estimates.
Be the first to comment