


typhoonski/iStock Editorial via Getty Images
Earnings of Cullen/Frost Bankers, Inc. (NYSE: CFR) will likely remain flattish this year relative to last year. Strength in the Texan economy and higher interest rates will boost the net interest income. On the other hand, the net provision expense will likely normalize this year partly because of the increase in credit risk following the interest rate hike. Overall, I’m expecting Cullen/Frost to report earnings of $6.68 per share for 2022, down by just 1% year-over-year. The year-end target price suggests a small downside from the current market price. Based on the total expected return, I’m upgrading Cullen/Frost Bankers to a hold rating.
Regional Economy to Boost Loan Growth
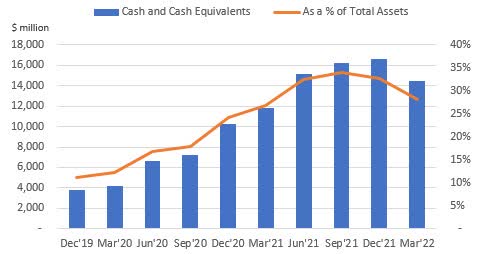
Cullen/Frost Bankers’ loan growth slowed to 1.3% in the first quarter of 2022, or 5.2% annualized. The management mentioned in the latest conference call that it expects full-year average loan growth to remain in the high-single-digit range. In my opinion, the management’s target appears ambitious given the recent performance. Excess cash has continued to remain at elevated levels as Cullen/Frost has been unable to grow loans at the same level as deposits. The company reported cash and cash equivalents of $14.5 billion at the end of March 2022, which is much higher than the pre-pandemic level of $3.8 billion at the end of December 2019.
SEC Filings
The excess cash on Cullen/Frost’s books raises serious concerns about the management’s capabilities. Loans, which are the highest-yielding earning assets, made up an abysmal 34% of total earning assets, while cash equivalents made up 30% of total earning assets at the end of March 2022.
Further, the faster-than-expected monetary tightening can dampen the credit appetite of borrowers. The management also implied in the conference call that it fears higher cap rates can trigger pay downs in the commercial real estate segment.
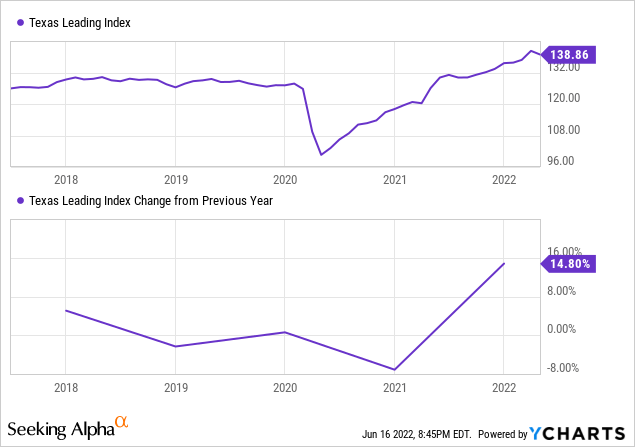
On the plus side, Cullen/Frost operates in Texas, whose economic growth in the coming quarters should lift loan growth for all banks in the region, including Cullen/Frost. The Dallas Fed’s leading index for Texas gives hope for good economic growth in Texas in the coming months, which should translate to healthy loan growth for the company.
Further, the company’s loan pipelines were up 29% from the end of 2021, as mentioned in the conference call. There’s plenty of room for growth in the commercial lines of credit as well. As mentioned in the conference call, the advanced rate of commercial working capital lines were at 34.8% at the end of March 2022, much below the normal range of 38% to 40%.
Overall, I’m expecting the loan portfolio to grow by 7% by the end of 2022 from the end of 2021. Deposit growth will likely outpace loan growth this year because of the strong deposit growth in the first quarter of the year. The following table shows my balance sheet estimates.
| FY17 | FY18 | FY19 | FY20 | FY21 | FY22E | ||||
| Financial Position | |||||||||
| Net Loans | 12,990 | 13,968 | 14,618 | 17,218 | 16,088 | 17,208 | |||
| Growth of Net Loans | 9.9% | 7.5% | 4.7% | 17.8% | (6.6)% | 7.0% | |||
| Other Earning Assets | 16,450 | 15,794 | 16,530 | 22,167 | 31,726 | 33,332 | |||
| Deposits | 26,872 | 27,149 | 27,640 | 35,016 | 42,696 | 46,919 | |||
| Borrowings and Sub-Debt | 1,383 | 1,602 | 1,931 | 2,352 | 2,989 | 2,218 | |||
| Common equity | 3,153 | 3,224 | 3,767 | 4,148 | 4,294 | 3,822 | |||
| Book Value Per Share ($) | 48.8 | 49.8 | 59.2 | 65.8 | 67.0 | 59.3 | |||
| Tangible BVPS ($) | 38.6 | 39.6 | 48.9 | 55.4 | 56.8 | 49.1 | |||
|
Source: SEC Filings, Author’s Estimates (In USD million unless otherwise specified) |
|||||||||
Moderately Rate-Sensitive Interest Income to Benefit from Higher Rates
While the excess cash position gives Cullen/Frost the opportunity to quickly benefit from higher interest rates, it also raises concerns about the management’s ability to seize that opportunity. The management mentioned in the conference call that it plans to invest an additional $5 billion of excess liquidity into investment purchases through the remainder of the year. This rate of deployment is not only slow, but it will also leave the excess cash level above the pre-pandemic level. Therefore, the elevated cash position will continue to keep margins at sub-optimal levels into 2023. Nevertheless, even partial deployment will have a material impact on the margin as there is currently a large difference between the yields earned on cash equivalents and securities. As mentioned in the latest 10-Q filing, Cullen/Frost earned an average yield of 2.88% on its securities portfolio and an average yield of only 0.18% on its interest-bearing deposits with other banks (a cash component) during the first quarter of 2022.
As mentioned in the 10-Q filing, Cullen/Frost’s balance sheet is currently asset-sensitive, which means that asset re-pricing will overweigh liability re-pricing this year. However, the gap is not too large; therefore, the topline is only moderately sensitive to rate changes. The management’s interest-rate sensitivity analysis shows a 200-basis points increase in interest rates can boost the net interest income by 5.8% over twelve months.
Considering these factors, I’m expecting the margin to increase by 28 basis points in the last nine months of 2022 from 2.33% in the first quarter of the year.
Provision Normalization Ahead
Cullen/Frost reported a close to zero net provision expense for the first quarter of the year. Going forward, the provisioning will likely normalize on the back of the loan additions discussed above. Moreover, I’m not expecting big provision reversals in the year ahead because high interest rates have increased the probability of defaults, which will discourage the management from releasing reserves.
The allowances-to-nonaccrual loans ratio stood at 504.09% at the end of March 2022, which appears quite high. Therefore, I’m not expecting the provisioning for expected loan losses to exceed normal levels.
Overall, I’m expecting the provision expense, net of reversals, to make up 0.34% of total loans in 2022. In comparison, the net-provision-expense-to-total-loan ratio averaged 0.22% from 2017 to 2019 and 0.41% for the last five years.
Expecting Flattish Earnings
The anticipated provision normalization will drag earnings this year. Further, the management plans on increasing operating expenses in the low-double-digit range, as mentioned in the conference call.
On the other hand, loan growth and margin expansion will support the bottom line. Overall, I’m expecting Cullen/Frost to report earnings of $6.68 per share in 2022, down by just 1% year-over-year. The following table shows my income statement estimates.
| FY17 | FY18 | FY19 | FY20 | FY21 | FY22E | ||||
| Income Statement | |||||||||
| Net interest income | 866 | 958 | 1,004 | 976 | 985 | 1,105 | |||
| Provision for loan losses | 35 | 22 | 34 | 241 | 0 | 60 | |||
| Non-interest income | 336 | 351 | 364 | 465 | 387 | 439 | |||
| Non-interest expense | 759 | 779 | 835 | 849 | 882 | 984 | |||
| Net income – Common Sh. | 356 | 447 | 436 | 324 | 436 | 434 | |||
| EPS – Diluted ($) | 5.51 | 6.90 | 6.84 | 5.10 | 6.76 | 6.68 | |||
|
Source: SEC Filings, Author’s Estimates (In USD million unless otherwise specified) |
|||||||||
The earnings estimate mentioned above is much higher than the estimate I gave in my last report on Cullen/Frost, which was issued back in November 2021. Since then, the economic outlook has drastically changed. At the time of my last report, the Federal Reserve projected Federal Funds rate of 0.3% (median) for 2022. The Fed now projects the Federal Funds rate to be around 3.4% for 2022. The change in interest rate outlook is the main reason for the significant change in the earnings estimate.
Actual earnings may differ materially from estimates because of the risks and uncertainties related to inflation, and consequently the timing and magnitude of interest rate hikes. Further, the threat of a recession can increase the provisioning for expected loan losses.
Upgrading to a Hold Rating
Cullen/Frost is offering a dividend yield of 2.6% at the current quarterly dividend rate of $0.75 per share. The earnings and dividend estimates suggest a payout ratio of 45% for 2022, which is in line with the five-year average of 46%. Therefore, I’m not expecting any change in the dividend level for the year ahead.
I’m using the historical price-to-tangible book (“P/TB”) and price-to-earnings (“P/E”) multiples to value Cullen/Frost. The stock has traded at an average P/TB ratio of 2.08 in the past, as shown below.
| FY17 | FY18 | FY19 | FY20 | FY21 | Average | |
| T. Book Value per Share ($) | 38.6 | 39.6 | 48.9 | 55.4 | 56.8 | |
| Average Market Price ($) | 92.2 | 106.6 | 94.6 | 74.9 | 115.1 | |
| Historical P/TB | 2.39x | 2.69x | 1.93x | 1.35x | 2.03x | 2.08x |
| Source: Company Financials, Yahoo Finance, Author’s Estimates | ||||||
Multiplying the average P/TB multiple with the forecast tangible book value per share of $49.1 gives a target price of $102.1 for the end of 2022. This price target implies a 12.7% downside from the June 16 closing price. The following table shows the sensitivity of the target price to the P/TB ratio.
| P/TB Multiple | 1.88x | 1.98x | 2.08x | 2.18x | 2.28x |
| TBVPS – Dec 2022 ($) | 49.1 | 49.1 | 49.1 | 49.1 | 49.1 |
| Target Price ($) | 92.3 | 97.2 | 102.1 | 107.0 | 112.0 |
| Market Price ($) | 117.0 | 117.0 | 117.0 | 117.0 | 117.0 |
| Upside/(Downside) | (21.1)% | (16.9)% | (12.7)% | (8.5)% | (4.3)% |
| Source: Author’s Estimates |
The stock has traded at an average P/E ratio of around 15.5x in the past, as shown below.
| FY17 | FY18 | FY19 | FY20 | FY21 | Average | |
| Earnings per Share ($) | 5.51 | 6.90 | 6.84 | 5.10 | 6.76 | |
| Average Market Price ($) | 92.2 | 106.6 | 94.6 | 74.9 | 115.1 | |
| Historical P/E | 16.7x | 15.4x | 13.8x | 14.7x | 17.0x | 15.5x |
| Source: Company Financials, Yahoo Finance, Author’s Estimates | ||||||
Multiplying the average P/E multiple with the forecast earnings per share of $6.68 gives a target price of $103.8 for the end of 2022. This price target implies an 11.3% downside from the June 16 closing price. The following table shows the sensitivity of the target price to the P/E ratio.
| P/E Multiple | 13.5x | 14.5x | 15.5x | 16.5x | 17.5x |
| EPS 2022 ($) | 6.68 | 6.68 | 6.68 | 6.68 | 6.68 |
| Target Price ($) | 90.5 | 97.2 | 103.8 | 110.5 | 117.2 |
| Market Price ($) | 117.0 | 117.0 | 117.0 | 117.0 | 117.0 |
| Upside/(Downside) | (22.7)% | (17.0)% | (11.3)% | (5.6)% | 0.1% |
| Source: Author’s Estimates |
Equally weighting the target prices from the two valuation methods gives a combined target price of $103.0, which implies a 12.0% downside from the current market price. Adding the forward dividend yield gives a total expected return of negative 9.4%.
I adopted a sell rating in my last report on Cullen/Frost Bankers due to a significant price downside. Since then, the stock price has plunged which has reduced the price downside. Based on the total expected return, I’m now upgrading Cullen/Frost Bankers to a hold rating.
Be the first to comment