

PercyAlban/iStock Unreleased via Getty Images
VictoryShares US Small Cap High Div Volatility Wtd ETF (NASDAQ:CSB) is a $201 million fund focusing on generous dividend payers from the small-cap echelon, with attention paid to the volatility factor to ensure there will be no frenetic price swings that dividend investors who typically pick stocks for the long haul certainly do not like.
Unfortunately, CSB is a vivid example of how factor investing can go wrong. At first glance, it had an almost perfect portfolio for hawkish 2022. Volatility-weighted small-size U.S. equities from the value echelon (i.e., generous dividend payers). No blockbuster growth stories or lofty multiples. Underweight tech. Hence, not that vulnerable to the reduction of growth premia, which happens when interest rates creep higher. However, its total return is almost equal to the result the iShares Core S&P 500 ETF (IVV) has delivered since the beginning of the year. IVV is a bellwether tech & growth-heavy fund that bore the brunt of the capital rotation 2.0.
Seeking Alpha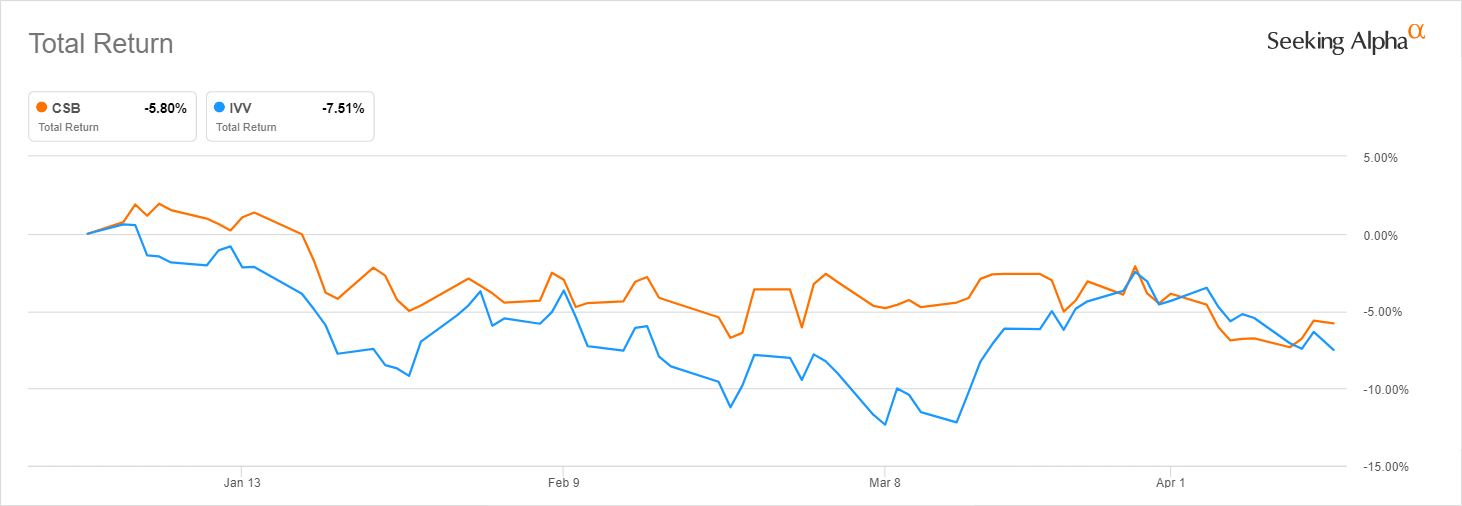
Of course, we should investigate this anomaly. For that purpose, we will be discussing CSB’s investment strategy and attentively reviewing its portfolio. Additionally, since CSB is a dividend fund, I would like to pay special attention to the profitability factor, dividend credentials of its holdings, as well as distributions growth. All these should allow us to arrive at a balanced verdict if the ETF is worth considering or not.
The investment strategy and holdings
The fund tracks the Nasdaq Victory U.S. Small Cap High Dividend 100 Volatility Weighted Index.
The constituents are selected from the Nasdaq Victory U.S. Small Cap 500 Volatility Weighted Index; to qualify for inclusion in it, a company must be profitable for the trailing twelve months. It also must have a sub-$3 billion market value.
The earnings screen should positively impact the overall quality of the CSB portfolio (as we will see below) and somewhat reduce the value trap risk, but, certainly, issues inherent to small caps (i.e., weaker, less stable margins) will not go anywhere.
Stocks selected for CSB’s underlying index must be in the top 100 cohort in terms of dividend yields; so, the resulting mix should have pronounced value characteristics.
The index has been reconstituted just recently, in March. The key factor influencing a constituent’s weight is the “standard deviation over the past 180 trading days.” Next time it will be rebuilt in September.
As of April 13, CSB was long 97 common stocks. We do not see any material deviations in terms of size as only two companies sport market capitalizations above $3 billion, namely MGE Energy (MGEE) and Patterson Companies (PDCO). MGE, a public utility holding company, is CSB’s largest holding with a ~1.9% weight. Firms valued at less than $1 billion account for ~19% of the portfolio, with a $613 billion Ethan Allen Interiors (ETD) being the smallest company in the mix.
The fund is overweight in equities from the financial, industrial, and consumer discretionary sectors; they have ~22.6%, ~18%, and ~16% of the net assets, respectively. The allocation is rather similar to the one the iShares Core S&P Small-Cap ETF (IJR) has, except for the third-largest sector, which is the IT in the case of the latter.
As the small size in most cases is synonymous with lower multiples compared to sector medians, CSB has an unsurprisingly impressive exposure to the value factor. Over 62% of its holdings have at least B- Quant Valuation grade; Benchmark Electronics (BHE) is one of the examples of grossly undervalued stocks. Just ~5% were overvalued (D+ grade or worse) as of April 14. Nothing short of impressive.
Its allocation to growth stocks is also rather substantial, ~27%, which is a bit strange since companies that pay generous dividends mostly have tepid growth stories, as they return cash to shareholders instead of injecting it into growth projects.
Discussing profitability and dividend credentials
But what about the quality factor? If wrapped properly, data could tell a lot. So, first, a scatter plot.
Created by the author using data from Seeking Alpha and the fund
Please take notice that the chart covers only ~74% of the portfolio as financials and REITs were removed.
It seems most companies in the group have positive cash flows and EBITDA. Both form the cornerstone of dividend sustainability. It points to the fact that quality is more than adequate.
Second, another chart, with Return on Equity and net income margins. These metrics are certainly not ideal measures but since there are financials (and a lot) in the portfolio, we have no other choice.
Created by the author using data from Seeking Alpha and the fund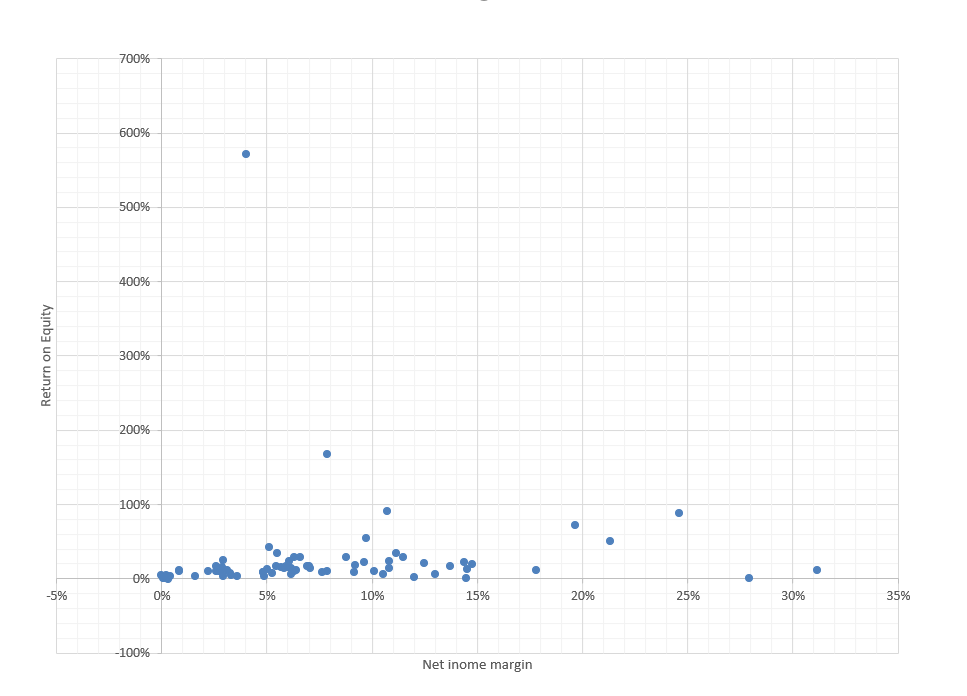
It should be noted that Vector Group (VGR) and Jack in the Box (JACK) do not have data for ROE as both have negative shareholder equities. Also, the outlier with a 572% ROE is Camping World Holdings (CWH); it has an enterprise value problem, and its figure is so high since shareholder equity is impacted by gargantuan debt (a Debt/Equity ratio of ~1,037%).
Third, a quick fact: just ~33% of the CSB holdings have a Quant Profitability grade of B- or better. For my taste, that is too low for a dividend fund.
But why the share is so low? This might be contradictory at first glance as almost all companies are profitable, with positive EBITDA and seemingly strong cash flows. But it perfectly makes sense.
Small caps can be profitable, even with a cash surplus. But they typically do worse than their large counterparts, hence, their metrics are only on par or below sector medians, partly due to competitive advantages the latter typically enjoy.
So, the primary things investors seeking exposure to the small-cap echelon should understand is that smaller-size companies are inherently more vulnerable to the economic cycles given their lower quality compared to their respective sectors. They have smaller, less stable margins that are not protected against the vagaries of the economic cycle, including the essential problem – inflation. The cost of goods sold goes up quicker than sales grow, and profits go down. Though the sensitivity varies, and some players might even improve their financial footing amid spiraling inflation, it is worth keeping this rule in mind.
Now, dividends. The scatter plot below illustrates the forward yields and three-year dividend CAGRs of the holdings. As you might notice, most have yields between 2% and 5%. Dividend growth, however, is rather tepid.
Created by the author using data from Seeking Alpha and the fund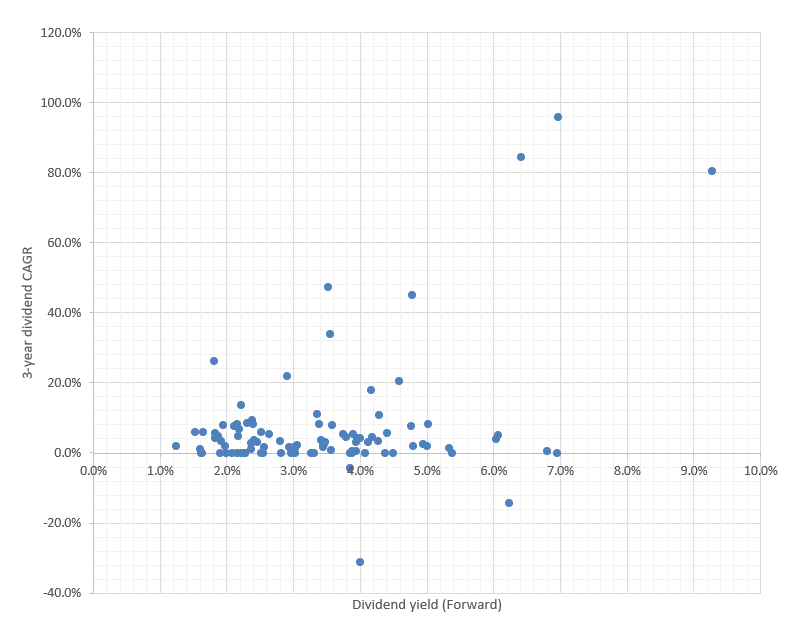
Performance
What returns CSB had been capable of delivering since its inception in July 2015? Nothing spectacular, though marginally ahead of in line with the iShares Core S&P Small-Cap ETF (IJR), a CAGR of ~12.1% vs. IJR’s 11.2%. Both lagged IVV which delivered ~14.3%. Surprisingly, CSB and IJR failed to outperform IVV in 2021 despite a capital rotation that was supportive; total returns were ~27%, ~26.6%, and ~28.8%, respectively.
The question is why CSB has been in the red this year, while some value plays like the Invesco S&P 500 Pure Value ETF (RPV) have been on a tear. The small-cap portfolio Avantis U.S. Small Cap Value Fund (AVUV) has also been doing better.
Seeking Alpha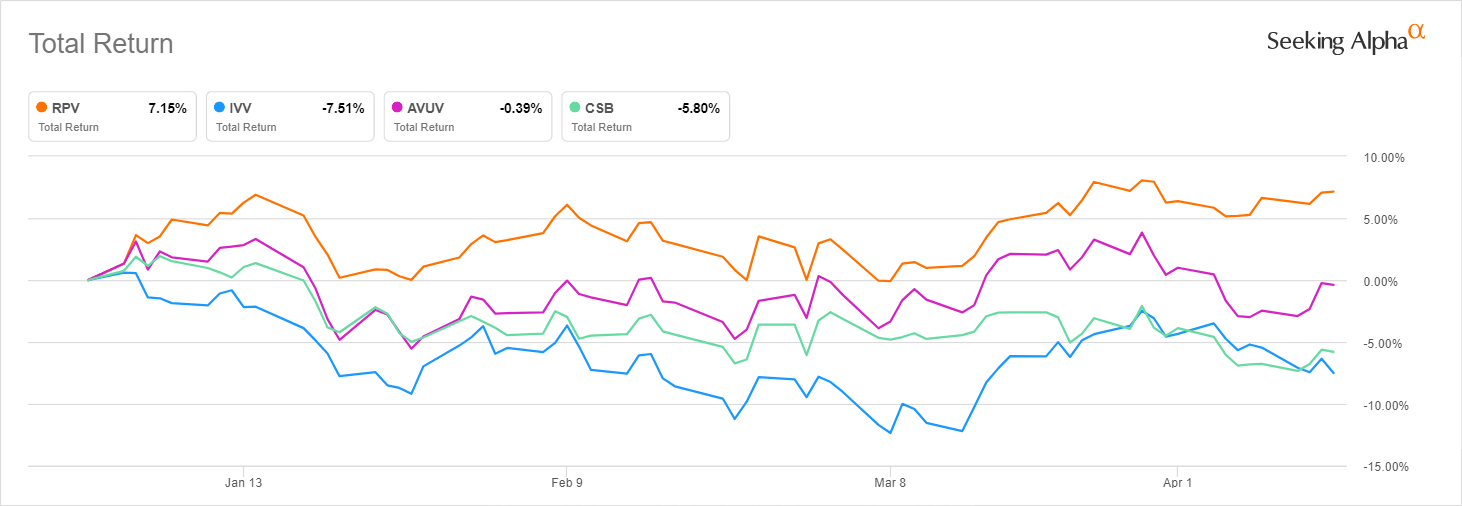
In my view, this might be partly the result of the volatility weighting. Also, there are examples of CSB’s holdings that have an almost perfect combination of factors, but they still took a battering due to company-specific downside catalysts, like Dana Corporation (DAN), a value stock, which price has declined by more than 32% due to the string of negative news.
Final thoughts
CSB’s surprisingly sluggish performance in 2022 to date despite a seemingly winning combination of factors provides a textbook example of how even carefully calibrated factor investing strategies can go wrong.
Also, I would not say its dividend yield of 3% is alluring. The standardized yield that excludes the expense ratio of 35 bps is even lower; it was 2.65% as of the end of February (the subsidized one). Dividend CAGRs are also bleak; the ETF’s 5-year CAGR stands at only ~6.3%, which is on par with the class median (also influenced by ETFs with no dividend focus).
Another issue I see is that the fund is burdened by the quality-related problems typical for small-cap equity mixes. I am skeptical about dividend strategies that are not backed by at least ~60% allocation to stocks with a solid Quant Profitability rating.
All things considered, quality and dividend investors should give this ETF a pass. I am also skeptical about the capital appreciation potential. The fund is a Hold.
Be the first to comment