

Crude Oil Price Talking Points
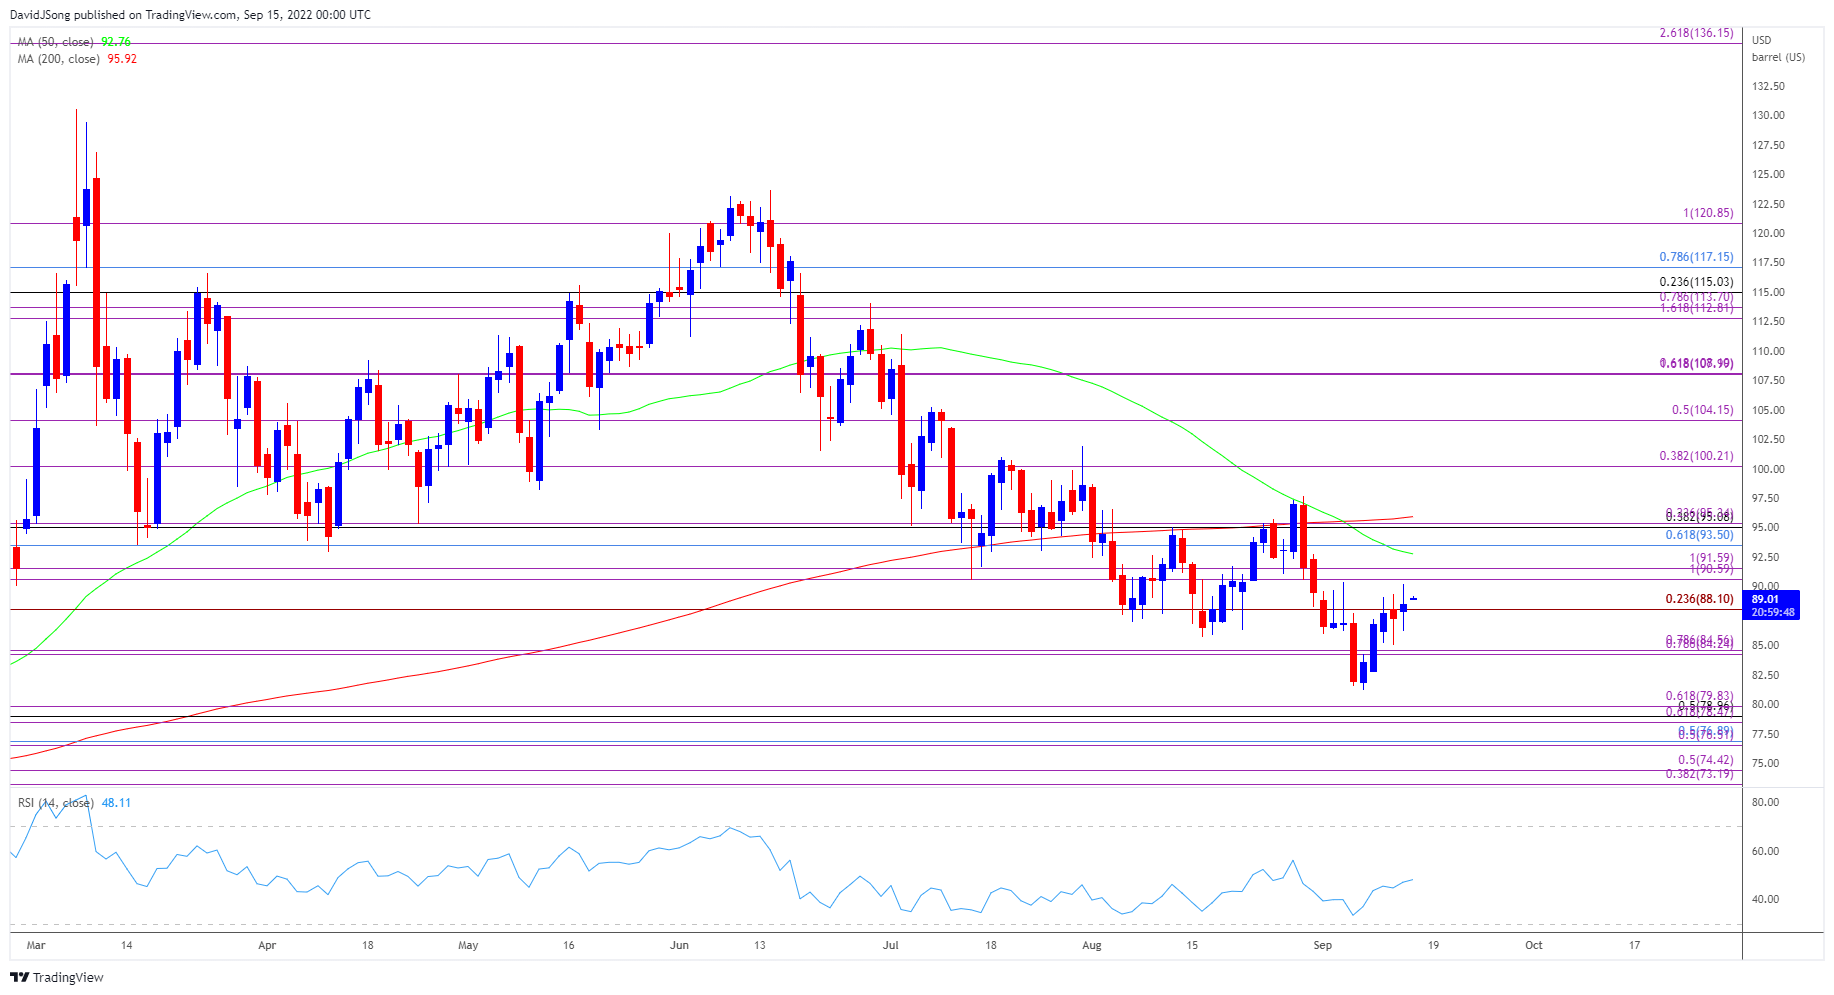
The price of oil is on the cusp of testing the monthly high ($90.39) despite a larger-than-expected rise in US inventories, and crude may push towards the 50-Day SMA ($92.76) if it clears the opening range for September.
Crude Oil Price to Test 50-Day SMA on Break Above Monthly Opening Range
The price of oil appears to have reversed course ahead of the January low ($74.27) as it extends the advance from the monthly low ($81.20), and crude may stage a larger rebound over the coming days as signs of easing demand encourages the Organization of Petroleum Exporting Countries (OPEC) to scale back on production.
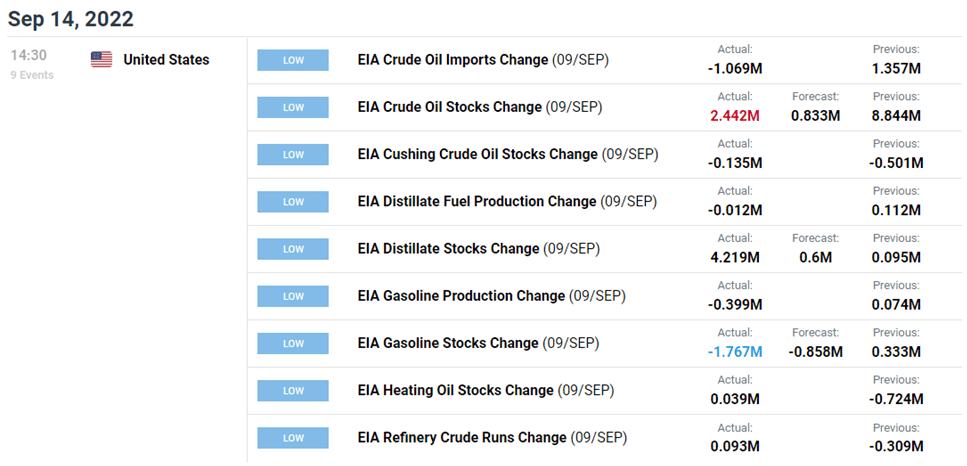
Fresh data prints coming out of the US may influence OPEC as crude inventories increase for the second week, with stockpiles climbing 2.442M in the week ending September 9 versus forecasts for a 0.833M rise.
In response, OPEC may continue to switch gears over the coming months as they revert to their previous output schedule, but expectations for robust demand may keep the group on a preset course as the most recent Monthly Oil Market Report (MOMR) states that “world oil demand for 2022 is expected to rise by 3.1 mb/d, y-o-y unchanged from last month’s report.”
The MOMR goes onto say that “in 2023, expectations for healthy global economic growth, combined with anticipated improvements in the containment of COVID-19 in China, are expected to boost oil consumption,” and the projections may push OPEC to provide a steady supply as “the demand outlook for 2023 remains at 2.7 mb/d, unchanged from the last MOMR.”
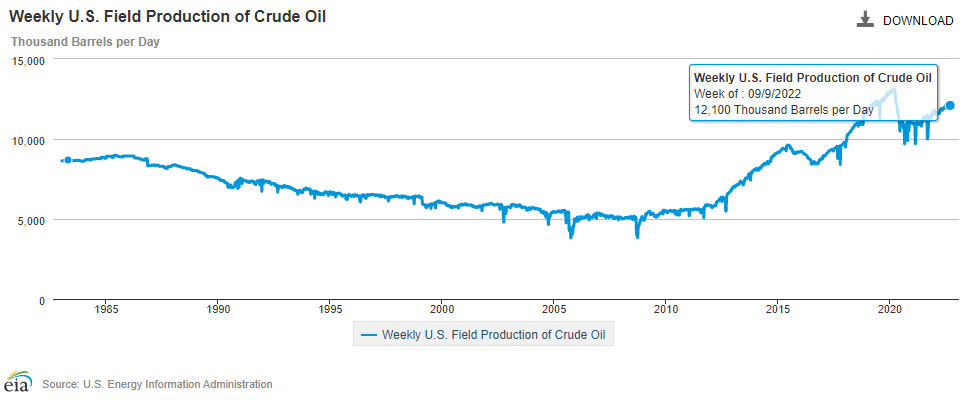
In turn, the price of oil may stage a larger rebound ahead of the next Ministerial Meeting on October 5 as OPEC retains a positive outlook for crude consumption, and it remains to be seen if the developments coming out of the US will influence the organization as a deeper look at the figures from the Energy Information Administration (EIA) show weekly field production printing at 12,100K for the third consecutive week.
With that said, current market conditions may prop up the price of oil as expectations for robust demand are met with indications of limited supply, and crude may attempt to test the 50-Day SMA ($92.76) if it clears the opening range for September.
Crude Oil Price Daily Chart
Source: Trading View
- The price of oil approaches the $90.60 (100% expansion) to $91.60 (100% expansion) region following the failed attempt to test the Fibonacci overlap around $78.50 (61.8% expansion) to $79.80 (61.8% expansion), and crude may attempt to test the 50-Day SMA ($92.76) if it clears the opening range for September.
- However, the price of oil may track the negative slope in the moving average to largely mirror the price action from last month, and lack of momentum to hold above $88.10 (23.6% expansion) may push crude back towards the $84.20 (78.6% expansion) to $84.60 (78.6% expansion) area.
- Failure to defend the monthly low ($81.20) brings the overlap around $78.50 (61.8% expansion) to $79.80 (61.8% expansion) back on the radar, with the next area of interest coming in around $76.50 (50% retracement) to $76.90 (50% retracement).
Foundational Trading Knowledge
Commodities Trading
Recommended by David Song
— Written by David Song, Currency Strategist
Follow me on Twitter at @DavidJSong
Be the first to comment