

Crude Oil Price Talking Points
The price of oil pulls back from a fresh yearly high ($89.72) despite an unexpected decline in US inventories, and looming developments in the Relative Strength Index (RSI) may undermine the recent advance in crude if the oscillator falls below 70 to indicate a textbook sell signal.
Crude Oil Price Susceptible to Larger Pullback on RSI Sell Signal
The price of oil retains the series of higher highs and lows from the start of the week as the Organization of Petroleum Exporting Countries (OPEC) plans to “adjust upward the monthly overall production by 0.4 mb/d for the month of March 2022,” and indications of stronger demand may keep the group on a preset course as US crude inventories contract 1.046M in the week ending January 28 versus forecasts for a 1.525M rise
As a result, current market conditions may keep price of oil afloat as OPEC’s most recent Monthly Oil Market Report (MOMR) emphasizes that “in 2022, world oil demand growth has been kept unchanged at 4.2 mb/d with total global consumption at 100.8 mb/d,” and the group may layout the same production schedule at the next Ministerial Meeting on March 2 as even though US output remains far from pre-pandemic levels.
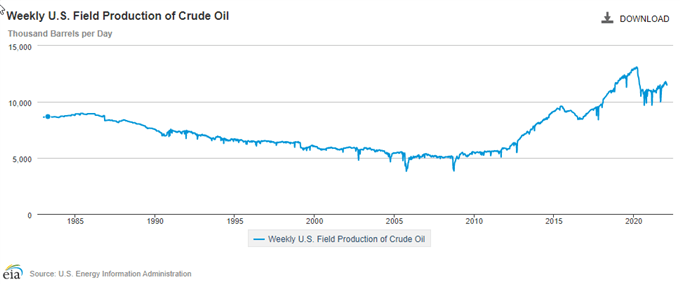
A deeper look at the figures from the Energy Information Administration (EIA) show weekly field production of crude oil narrowing for the second week, with production falling to 11,500K from 11,600K in the week ending January 21. In turn, expectations for stronger demand along with indications of limited supply may keep the price of oil afloat in 2022, and the price of oil may exhibit trend throughout the year as OPEC and its allies appear to be on a preset course in restoring production.
With that said, the price of oil may attempt to test the October 2014 high ($92.96) as it pushes to a fresh yearly high ($89.72) in February, but looming developments in the RSI may indicate a larger pullback in crude if the oscillator falls back from overbought territory to offer a textbook sell signal.
Crude Oil Price Daily Chart
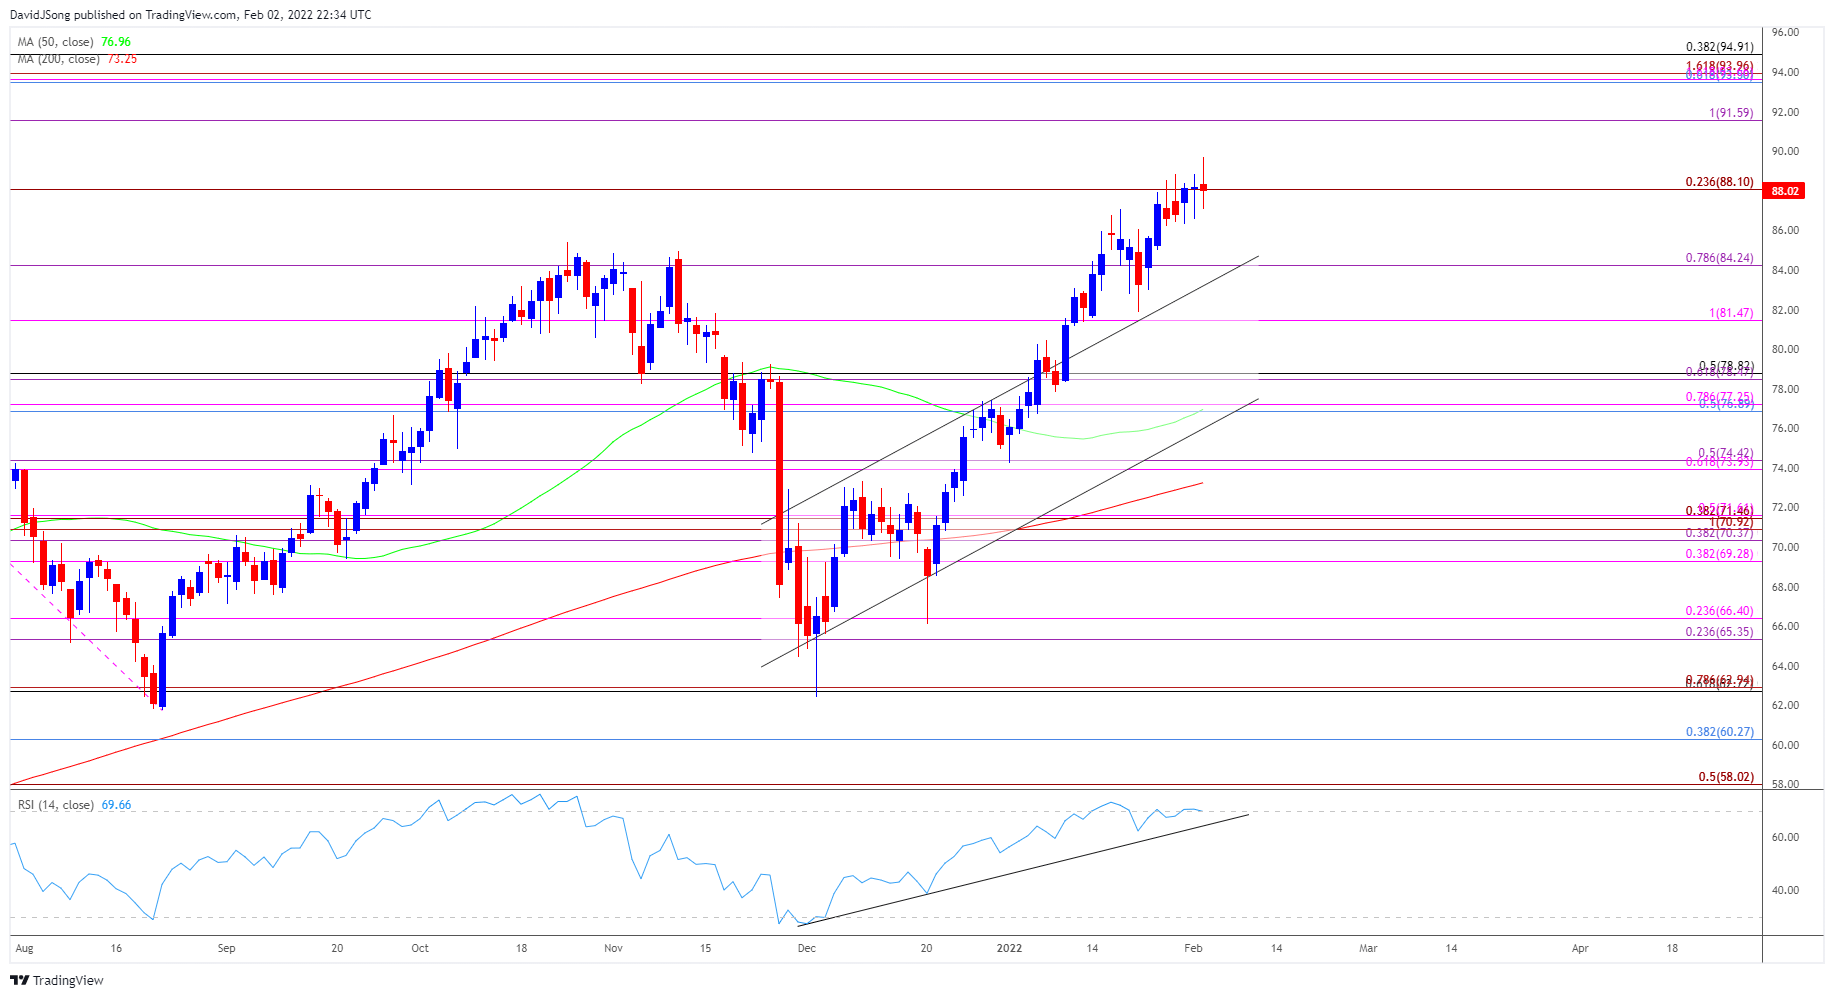
Source: Trading View
- Keep in mind, the price of oil cleared the July high ($76.98) after defending the May low ($61.56), with crude trading to a fresh 2021 high ($85.41) in October, which pushed the Relative Strength Index (RSI) above 70 for the first time since July.
- A similar development materialized in January as the price of oil cleared the 2021 high ($85.41), and crude may continue to exhibit a bullish trend as it trades to a fresh yearly high ($89.72) in February.
- However, looming developments in the RSI may indicate a near-term pullback in the price of oil as the oscillator appears to be falling back from overbought territory, and lack of momentum to hold above the $88.10 (23.% expansion) region may push crude towards $84.20 (78.6% expansion), with the next area of interest coming in around $81.50 (100% expansion).
- Nevertheless, the price of gold may continue to trade to fresh yearly highs as it retains the recent series of higher highs and lows, but need a break/close above the $91.60 (100% expansion) region to bring the October 2014 high ($92.96) on the radar.
— Written by David Song, Currency Strategist
Follow me on Twitter at @DavidJSong
https://www.tradingview.com/symbols/NYMEX-CL1!/
Be the first to comment