

Crude Oil Price Talking Points
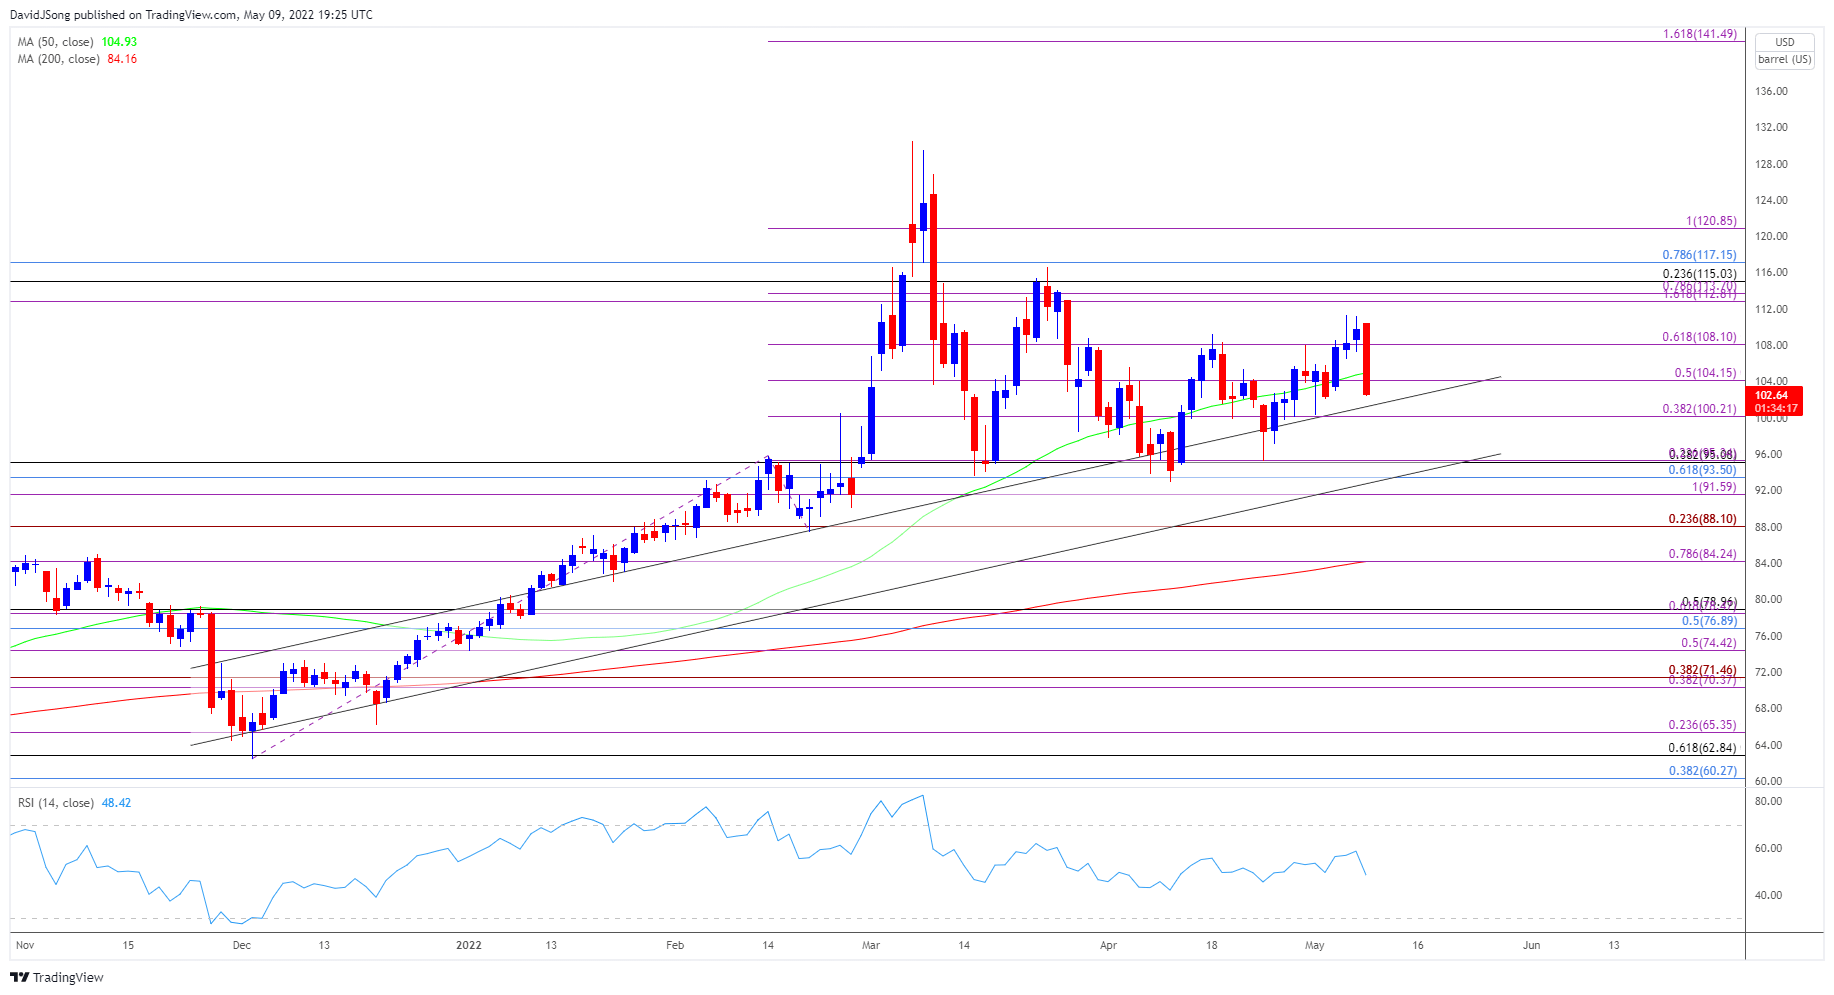
The price of oil slips back below the 50-Day SMA ($104.94) as it snaps the series of higher highs and lows from last week, but crude may continue to track the positive slope in the moving average if it manages to defend the monthly low ($100.28).
Crude Oil Price on Track to Test Monthly Opening Range
The price of oil snaps a three-day rally even as the as the Organization of Petroleum Exporting Countries (OPEC) stick to the current production schedule, and developments surrounding the global economy may sway crude prices as the European Union (EU) struggles to a secure a deal in banning Russian oil.
It remains to be seen if the EU will implement more sanctions against Russia as European Commission President Ursula von der Leyenplans to “phase out Russian supply of crude oil within six months and refined products by the end of the year,” but the ongoing invasion of Ukraine along with the renewed lockdown in China may keep the price of oil under pressure amid the weakening outlook for growth.
In turn, the price of oil may face headwinds ahead of the next OPEC Ministerial Meeting on June 2 as the most recent Monthly Oil Market Report (MOMR) reveals that “world oil demand is projected to average 100.5 mb/d, which is 0.4 mb/d lower than the previous month’s estimates and approximately 0.3 mb/d higher than 2019,” but crude may continue to track the positive slope in the 50-Day SMA ($104.94) as the group plans to “adjust upward the monthly overall production by 0.432 mb/d for the month of June 2022.”
With that said, the price of oil may defend the opening range for May as OPEC retains a steady approach in increasing supply, and lack of momentum to test the monthly low ($100.28) may offer a bullish outlook for crude as it managed to clear the April high ($109.20) during the previous week.
Crude Oil Price Daily Chart
Source: Trading View
- The price of oil snaps the series of lower highs and lows from last week after failing to test the $112.80 (161.8% expansion) to $113.70 (78.6% expansion) region, with crude trading back below the 50-Day SMA ($104.94) as it snaps the series of higher highs and lows from last week.
- The move below the $104.20 (50% expansion) area brings the $100.20 (38.2% expansion) region on the radar, and failure to defend the monthly opening range may push the price of oil towards the Fibonacci overlap around $93.50 (61.8% retracement) to $95.30 (23.6% expansion) as the advance from the April low ($92.93) unravels.
- Nevertheless, the price of oil may continue to track the positive slope in the moving average if it manages to hold above the monthly low ($100.28), with a move above the $104.20 (50% expansion) area bringing the $108.10 (61.8% expansion) region back on the radar.
— Written by David Song, Currency Strategist
Follow me on Twitter at @DavidJSong
Be the first to comment