

SIphotography/iStock via Getty Images
With the aim of being more diversified as well as enabling investors to benefit from portfolio protection, I have been investigating various strategies, namely, using precious metals, commodities, covered calls, and even shorting tech stocks.
With this thesis, my objective is to highlight the importance of getting exposure to high-quality companies with superior FCF (free cash flow) and the need to opt for more actively managed ETFs in periods of high market turbulence. For this purpose, I start by comparing the Pacer US Cash Cow 100 ETF (BATS:BATS:COWZ) and the Trim Tabs FCF US Quality ETF (BATS:BATS:TTAC) and will later extend the comparison using two iShares Russel ETFs.
As shown in the table below, both TTAC and COWZ were incepted in 2016, but the latter has grown into a much larger fund, with assets under management of $7.2 billion.
Comparing the Key metrics: COWZ and TTAC (Seeking Alpha)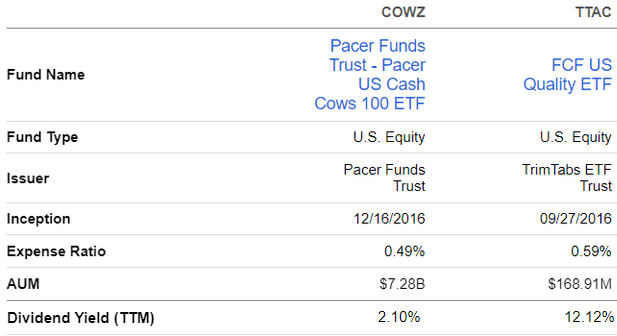
Despite its much lower AUM of around $169 million, TTAC seems to pay a much higher dividend yield of 12.12%, but it is important to assess whether this is sustainable and explore the distribution history.
I start by providing insights as to why it is important to focus on the FCF in a macroeconomic environment where the Federal Reserve is aggressively tightening monetary policy.
The FCF Yield Rationale
There are various ways to look for high-quality stocks and different metrics can be used for this purpose, such as profitability. Value investors normally opt for those with the best valuations on a price-to-earnings basis.
I opt for the FCF yield.
For a recap, FCF is the cash that is available after a company has paid its expenses, interest, taxes, and long-term investments. Most companies use part of the FCF to pay dividends, perform stock repurchases, or do M&As. Going one step further, the yield is obtained by dividing the FCF per share by the current share price. Now, since share price takes into account the market capitalization of a company, the FCF yield then measures the cash generated relative to its valuation.
I see this metric as becoming more important after the Federal Reserve embarked on monetary tightening through interest rate hikes, conversely reducing the spending power of corporate America. Also, it stopped buying treasuries and mortgage-backed securities in March this year in order to lighten its balance sheet.
Pursuing further, some will remember that in the aftermath of the Ukrainian conflict, the Federal Reserve warned of deteriorating liquidity conditions across key financial markets in its financial stability report in May 2022. In this respect, most of us have been used to the era of cheap money for the last decade and have no idea about the risks associated with the deterioration of liquidity in the financial markets which can go to the extent of impacting the ease of buying or selling a financial asset.
Without dramatizing, credit quality in the housing market is better than during the great financial crisis of 2008-2009, but there have been recent issues like the liquidity crisis at crypto lending company Celsius in June. This resulted in the company freezing withdrawals at one point and there was even some fear about contagion to other asset classes.
In these circumstances, it is important to look beyond companies sitting on big piles of cash, at something more important in the form of FCF yield, which measures their very ability to produce cash by market value.
I start with the Pacer ETF.
COWZ and its Regular Income
The Fund managers use a rules-based methodology to screen the top companies of the Russell 1000 index for the top 100 companies. Criteria include strong cash flow yields and healthy balance sheets, plus stocks that trade at a discount. Well, this is not too difficult in the current equity market where high-quality stocks have seen their valuations plummet since the beginning of 2022.
This strategy saw the emergence of the Pacer U.S. Cash Cow 100 Index (which is tracked by COWZ) boasting an FCF yield of 12.79% compared to only 3.76% for the Russel 1000 Index as shown below. The top ten holdings are shown in the figure below, with 25% of assets allocated to the healthcare sector, in front of Materials and Consumer Discretionary.
Comparing FCF Yields With Russell 1000 (Pacer ETFs)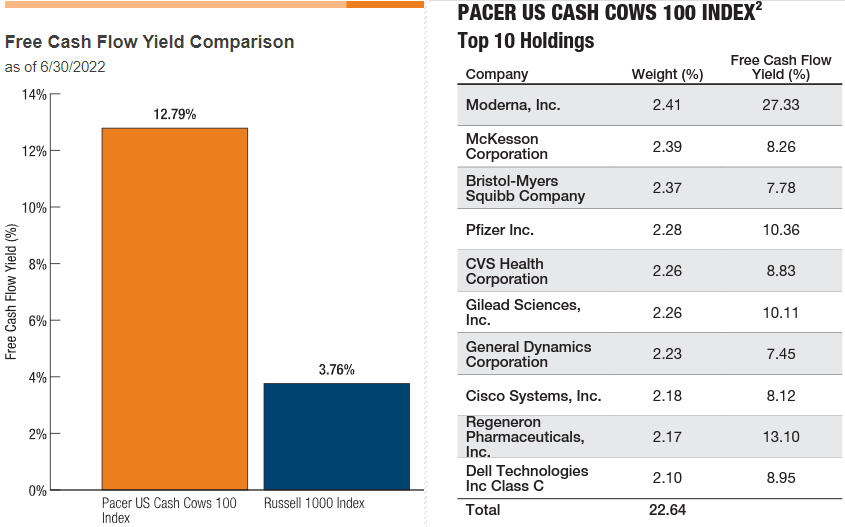
The strategy to rely on high free cash flow yield makes sense also from the dividend standpoint as COWZ has been paying regular quarterly dividends for the last five years, but the amount has varied depending on economic cycles. One example is the low of July 2020 as shown in the chart below, but, despite a lot of uncertainty around COVID, the Pacer ETF delivered an $0.11 dividend, which is important for those depending on a regular income.
Dividend History – COWZ (Seeking Alpha)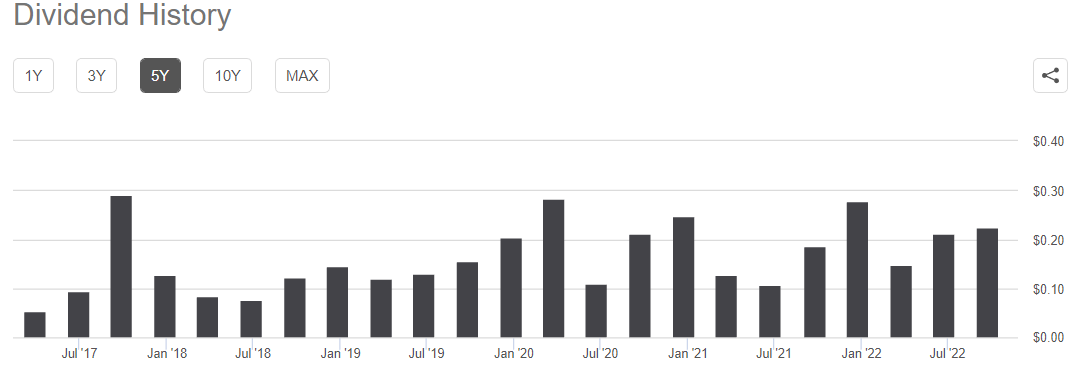
Inserting a cautionary note into this bright picture, the fund managers, while mentioning that they aim to grow dividends over time, also add that there is no guarantee dividends will be paid.
It is time to look at TTAC’s dividend history.
TTAC and its Exposure to Large Caps
A completely different picture emerges, or one where distributions are made less frequently, on an annual basis as shown in the table below. I highlighted the amount of $5.32 declared on December 30, 2021, which translates into the 12% yield I mentioned earlier. In this case, both the dividend history and the fund’s exceptional 25% performance last year tend to indicate that such a high dividend yield is not sustainable.
A more objective measure of yields for 2022 would be TTAC’s 30-Day SEC Yield of 1.04% based on the net income earned over the past 30 days, as computed using the Security and Exchange Commission’s standardized formula. For COWZ, the 30-Day SEC Yield is 2.27%.
Dividend History – TTAC (Seeking Alpha)
Now, to be fair, neither the investment objectives of COWZ and TTAC are the same, nor do they hold the same stocks, but, nonetheless, their aims remain the same, namely to screen for the top companies based on FCF. For this matter, while COWZ uses FCF yields, TTAC uses a “proprietary quantitative free cash flow analysis”, aided by fundamental analysis.
Another difference is that TTAC chooses its stocks from the Russell 3000 Index, which is a much wider basket than the Russell 1000 Index, and as shown by its holdings in the table below, there are many large caps.
TTAC – Sector Allocation and Top 10 Holdings (FCF Advisors)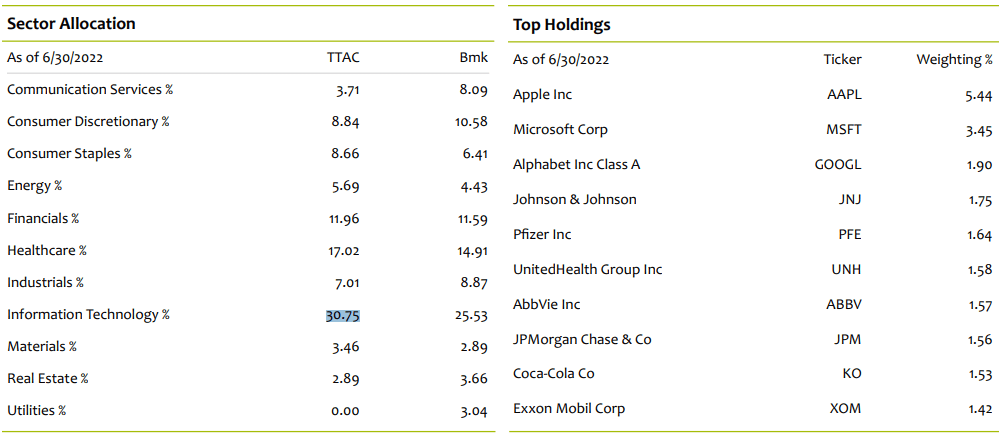
Continuing with sector exposure, TTAC’s 30.75% exposure to tech has been particularly detrimental to its price performance since the beginning of 2022 when it became clear that inflation would not be transitory and prompting the Fed to be very aggressive in hiking interest rates. This in turn increases financing costs, making it more difficult for tech stocks to avail of the cheap cash needed to fund their high growth rates and maintain their relatively higher valuations.
Moreover, big names like Apple (NASDAQ:AAPL) and Microsoft (NASDAQ:MSFT) resisted well in the first half of 2022, but, with demand concerns for iPhones and a strong dollar making U.S.-made software more expensive in the rest of the world, these two stocks have not been spared from the volatility impacting the broader market.
Comparison of Performance
In addition to higher exposure to healthcare as I mentioned earlier, which is considered a more defensive sector during periods of uncertainty, COWZ also disposes of more energy assets, at 13.13% of its portfolio compared to TTAC’s 5.69%. Thus, the Pacer ETF has more sector strength.
This is the reason for which I foresee that, after delivering a performance of 51% during the last five years, COWZ which is shown in the pale blue chart below should continue to outperform the iShares Russell 1000 ETF (IWB) shown in orange. The Pacer ETF did not always outperform IWB though and this only started in 2022, during a period marked by high volatility for stocks.
Along the same lines, COWZ’s strategy to provide “capital appreciation over time by screening the Russell 1000″ has worked, and it has also delivered a regular income stream in the process.
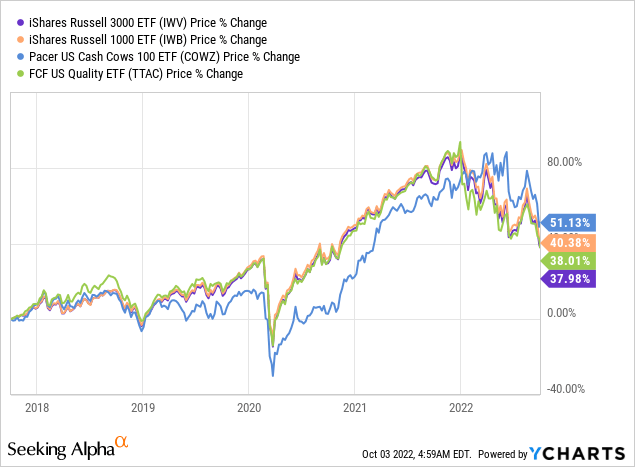
As for TTAC in green, it has been less successful than COWZ, but, has been less volatile compared to the iShares Russell 3000 ETF (IWV). Including the dividend payments, signifies that its aim to generate “long-term returns in excess of the total return of the Russell 3000 Index, with less volatility” has succeeded.
Conclusion
Therefore, the fact that both COWZ and TTAC have performed better than IWB and IWV respectively signifies that more active management strategies to provide protection are working. This statement is further evidenced by the actively managed ETFs’ one-month and six-month price performances, achieved during times of heightened volatility being better than the year-to-date and one-year performances as per the table below.
Comparison of key Metrics (Seeking Alpha)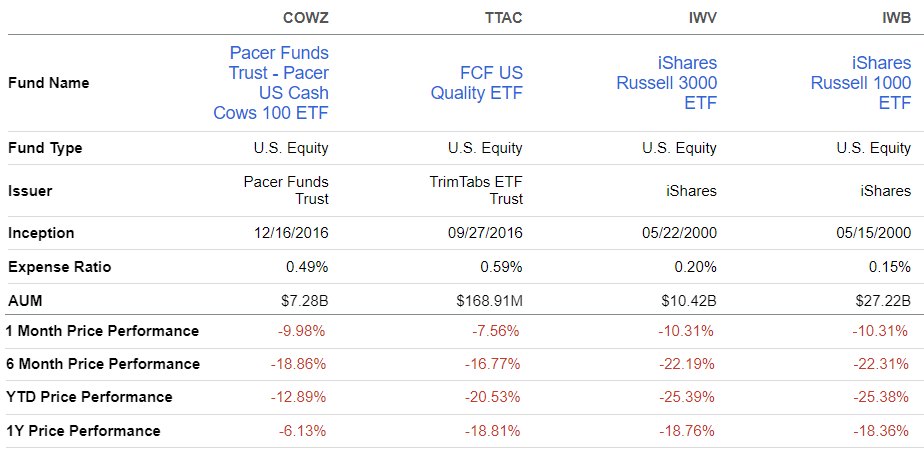
Going forward, with more tightening to come as the Fed remains adamant on its inflation-reduction goal and liquidity being actively filtered out of the system, I foresee that the actively managed ETFs which charge more than the Russel ETFs, as shown in the table above, will continue to outperform.
Coming back to the other purpose of this thesis which was to make a comparison based on the FCF metric, COWZ is better for those favoring a regular income stream.
Finally, I am not bullish on any of these ETFs at this juncture as volatility should continue till the Fed’s hawkish stance does not change, but, in the event of a sudden and significant deterioration in liquidity, they could outperform peers.
Be the first to comment