

filadendron
Cousins Properties (NYSE:CUZ) is an office-focused real estate investment trust (“REIT”) with a concentrated portfolio that is located exclusively within the Sunbelt region of the U.S, with significant exposure to various submarkets within Atlanta, Georgia and to Austin, Texas.
The company’s Class-A portfolio differentiates itself by being of newer age, with approximately a third of the total portfolio being less than five years old or recently redeveloped. The Class-A nature of their properties, together with the relative age provide key competitive advantages in the current market landscape, one of which is their draw to companies taking a “flight to quality” as they reassess spacing needs in the new world of hybrid work.
For perspective, management noted that since the onset of the COVID-19 pandemic, properties built since 2010 have recorded over 80M square feet (“SF”) of positive net absorption nationally, while those built in the 1980s have recorded nearly 90M in negative net absorption. Given that this is expected to continue in future periods, CUZ is likely to remain a beneficiary of new signings from tenants seeking higher quality space for employees that are increasingly being called back into the office for at least part of the week.
In their most recently released earnings report, the quality and draw of their existing portfolio was affirmed by their strong quarterly results in the face of a challenging macro backdrop. Despite positive developments, however, shares are still trading around their lows and are down over 40% YTD. For long-term investors, this presents an attractive opportunity to add a quality office REIT to their diversified income-earning portfolios.
Visible Runway For Continued Improvements In Occupancy Levels
As of September 30, 2022, overall quarter end leased occupancy stood at 90.1%, while the weighted average occupancy rate closed at 87.3%. This is essentially unchanged from the second quarter. But compared to the December 31, 2019, pre-pandemic benchmark, average occupancy is still down 280 basis points (“bps”).
Consistent with prior periods, their top markets continue to be concentrated in the Sunbelt region of the U.S., with Atlanta and Austin collectively accounting for nearly 70% of total quarter net operating income (“NOI”).
Q3FY22 Investor Supplement – Map Of Geographic Concentration By Share Of NOI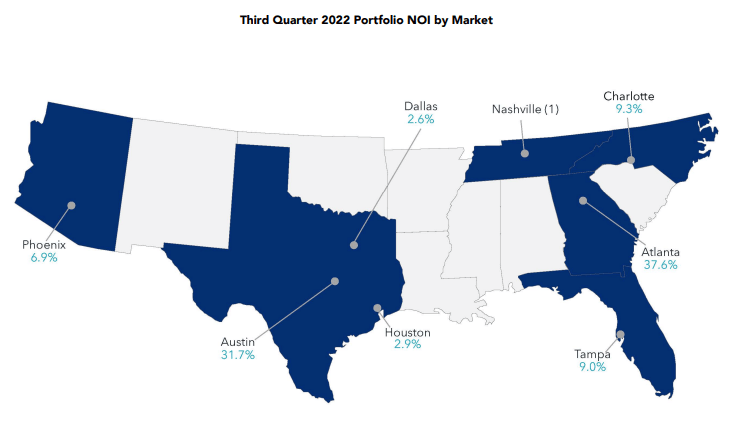
In these two markets, average occupancy rates were 83.3% and 91%, respectively. Though there was a 270bps improvement in Austin, occupancy was down 240bps in Atlanta, due to a large move-out in one of their properties in a more suburban market.
This is notable because the property, Northpark, accounts for about 8.3% of the company’s rentable square footage. While an improvement opportunity exists, it can be more challenging to backfill this particular property, as acknowledged by management, due to the greater amount of vacancies in the area.
Leasing Activities Are Still Generating Positive Cash Spreads And Extended WALTs
Despite the challenging environment, leasing activities continues unabated at positive renewal spreads. In the current quarter, 431K SF of space was signed at a cash spread of 4.8%. And when excluding their non-core asset in Houston, the adjusted spread was 7.3%. Overall, there were 48 total signings, which is just four fewer than their record count last quarter.
In addition, about 50% of total leasing activity was attributable to new and expansion leases. With an overall weighted average lease term (“WALT”) of 8.3 years in their current signings, it appears companies are continuing to make long-term commitments for their spacing needs. It’s also worth noting that the WALT is up modestly from the 7.9 years reported in Q2, an indication, perhaps, of growing certainty among companies of their long-term spacing needs.
Leasing concessions did tick higher during the quarter, which may be another reason for the increase in the WALTs. But despite the higher level of concessions, net effective rents per square foot are still up nearly $1.50 from the first half of the year and are at the second highest level since the beginning of 2021.
Key Markets Continue To Outperform
Within individual markets, CUZ is experiencing particular strength in Tampa and Phoenix, two markets that collectively account for about 16% of total NOI. In Tampa, nearly 100K SF of space was signed, 55% of which were new and expansion leases. And according to management, citing JLL Research, direct vacancy in the market is less than 12%, which is the lowest vacancy rate since pre-COVID. Additionally, rents in Phoenix were signed at cash spreads of 19.6% on leasing activity totaling 40K SF, led by heightened levels of demand in the market for Class-A office space.
In the Austin market, CUZ does have significant exposure to the technology sector, which is currently facing a more severe bear market than the broader averages, but 75% of their exposure is with high-quality publicly traded companies, such as Amazon (AMZN) and Meta Platforms (META). While concerns regarding downsizing at these companies are valid, portfolio metrics in the overall market continue to outperform, with leased rates at 95% at quarter end paired with healthy WALTs of over six years.
Q3FY22 Investor Supplement – Summary Of Top Five Tenants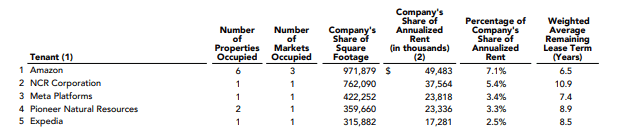
Current Lease Expiration Schedule Is A Key Competitive Advantage
In the coming years, CUZ also benefits from one of the most accommodative lease expiration schedules among their many peers. Through the end of 2024, for example, just 12.1% of their contractual rent expires. In addition, much of these expirations are from smaller tenants, with just one greater than 100K SF expiring during the back half of 2023.
September 2022 Investor Presentation – Lease Expiration Schedule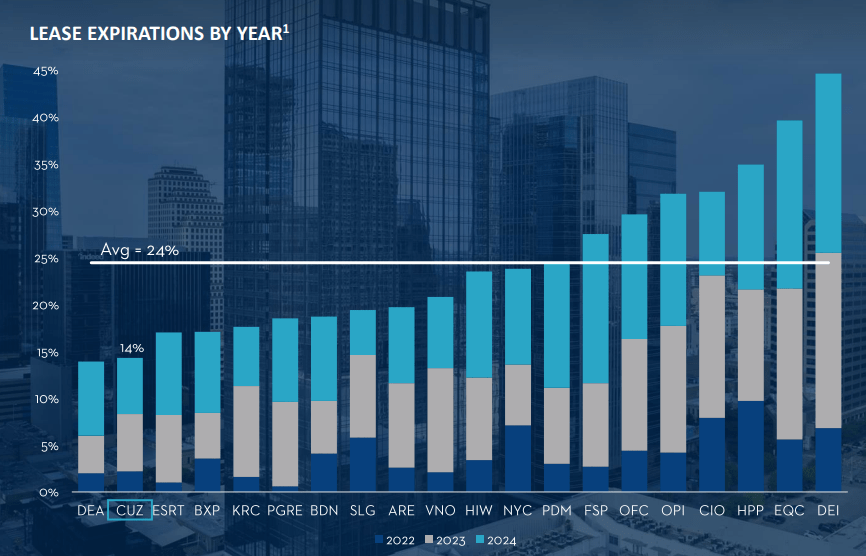
While limited expirations does inhibit markup opportunities, this is offset by reduced vacancy risk, which is of paramount importance in the office sector in the current market environment. With the threat of expirations minimized in the near-medium term, greater emphasis can be placed on earnings growth on existing leases.
Positive Outlook For Future Periods
In the current period, cash NOI increased by 1.5% compared to last year, driven by a large commencement on an Amazon property in their Austin market. This is a notable improvement from the first two quarters of the year, which came in flat on a YOY basis.
And looking ahead, the company has about 890K SF of new and expansion leases that are signed but not yet commenced. Combined with their +$570M development pipeline that is approximately 70% preleased, CUZ should realize materially relevant incremental NOI growth during 2023 and 2024.
The strong quarter, in addition to positive developments within the overall sector enabled the company to revise the midpoint of their full-year funds from operations (“FFO”) guidance by a positive $0.01/share, while also reaffirming their full-year guidance for same-property cash NOI.
A Premium To Peers Is Justified
CUZ’s Sunbelt concentration with a trophy portfolio of newer properties gives it an edge against their peers. An elevated level of corporate relocations and expansions into their targeted markets is one pertinent tailwind in the current market environment, as is the continued flight to quality that is driving demand for new, more amenitized properties.
September 2022 Investor Presentation – Map Of Corporate Relocations And Expansions Into CUZ’s Operating Markets
CUZ’s current period results reflect continuing strength in their markets, despite challenging overall economic conditions. One large move-out in a primary submarket was one blemish in an otherwise positive release. But this was offset by stability in the overall portfolio, with stable occupancy levels and healthy leasing volumes.
On expiring leases, the company continued to realize positive leasing spreads, with particular strength in certain key markets, such as Phoenix, Arizona. To date, they’ve now realized 34 straight quarters of increases. While nonrenewal risk is ever-present, CUZ is more shielded than their peers due to their sector-low expiration schedule and extended WALTs on existing leases.
Though the environment for external growth is presently uncertain, there is ample opportunity to improve organically via further occupancy gains and rising commencements on existing developments. A peer-leading balance sheet with significant existing liquidity and minimal leverage also positions the company competitively to capitalize on those external opportunities that do ultimately arise in the current market environment.
Though shares are trading at less than 10x forward FFO, they still trade at a premium to several of their peers. Vornado (VNO) and SL Green (SLG), for example, both trade at 7.7x and 5.9x, respectively, compared to CUZ’s 8.8x multiple. Piedmont Office Realty (PDM), another Sunbelt office REIT, also trades significantly lower at just 5.1x.
While the premium may steer some investors to competing names that currently boast of higher dividend yields than CUZ’s current sub 5.5% offering, the stock still makes for a solid long-term portfolio holding with significant upside potential. The age and quality of their portfolio in premier Sunbelt locations with limited near-medium term expiration risk and a sub 5x-levered balance sheet are a few traits that justify a higher premium in relation to their peers.
At the end of 2019, shares traded at about 16.3x FFO. That is double where shares are trading today, despite physical occupancy levels in certain segments of their portfolio that are well above 70% pre-COVID levels. At 11x FFO, shares would be valued at about 70% of their 2019 benchmark and would have implied upside of about 25% from current levels. For most investors, this would be an acceptable rate of return over current risk premiums.
Be the first to comment