

adaask
Both The Williams Companies, Inc. (NYSE:WMB) and Enbridge Inc. (NYSE:ENB) are investment-grade high yield midstream businesses that have proven to be effective passive income generators and growers for investors. While WMB has a lower EV/EBITDA and is a pureplay on natural gas, ENB has a higher credit rating and higher dividend yield.
In this article, we will compare them side-by-side and offer our take on which one is a better buy at the moment.
WMB Vs. ENB – Balance Sheet
Both businesses boast solid investment grade credit ratings, though ENB has the edge here with a BBB+ credit rating from S&P with a stable outlook whereas WMB has a Baa2 rating from Moody’s (equivalent of a BBB rating from S&P) with a stable outlook.
WMB’s leverage ratio declined during Q3 to 3.68x and the company is on pace to achieve an end of year net debt to adjusted EBITDA ratio of 3.6x, which is better than its 3.82x leverage ratio as of the end of Q2 and management’s initial end of year guidance of 3.8x.
Its weighted average interest rate is 4.78% and is fixed rate, which is good in the current environment. On top of that, its weighted average term to maturity for its debt is 12.2 years, and the vast majority of its debt matures in 2028 and beyond.
ENB’s balance sheet leverage it higher than WMB’s, but its superior scale and high quality cash flows can support it. Furthermore, it has an even more impressive debt maturity profile than WMB has just about all of its debt locked in at fixed interest rates. A substantial percentage of its debt does not mature until the 2030s, 2040s, 2050s, 2060s, and even 2080s. This – combined with its conservatively structured business model – positions it to compound shareholder wealth at a very attractive cost of capital for years to come with little risk of financial distress.
WMB Vs. ENB – Business Model
WMB is focused on servicing the natural gas industry with its midstream infrastructure, which is a good thing if you believe some research that indicates that it has a bright future in the global economy as mankind searches for more clean sources of energy.
On top of that, WMB has built a strategically located portfolio of assets that services 14 key supply regions. In particular, WMB has built its transmission pipelines near regions with more densely concentrated populations in order to maximize bang for its buck. These assets provide it with numerous lucrative growth investment opportunities, including 35 transmission growth projects either in execution or under development, six high return Deepwater GOM expansion projects, four Northeast G&P expansion projects, and five Haynesville & Wamsutter G&P growth projects.
When combined with its impressive track record of growing adjusted EBITDA adjusted earnings per share, and its dividend per share every year since 2018 regardless of the macroeconomic and industry-specific challenges thrown at it during that time, WMB’s business model is very impressive.
Meanwhile, ENB enjoys significant scale and energy commodity diversification. As a result, it enjoys competitive advantages due to having the U.S.’s second-longest natural gas transmission pipeline network and the largest natural gas distribution business and longest crude oil pipeline in North America. It also benefits from exciting growth opportunities in its emerging wind and solar energy production portfolio.
With such a wide variety of assets and commodities under its control, ENB is never lacking for growth investment opportunities. This enables it to grow its cash flows per share and dividend at an attractive and consistent rate over time. On top of that, its cash flow profile is almost utility-like, given that 98% of its contracts are commodity price resistant and 95% of its cash flow stems from investment grade counterparties.
Overall, we consider this comparison a draw. If you want a more general midstream sector investment, ENB will be preferable. However, if you simply want to focus on benefiting from the natural gas growth story, WMB is the preferable investment.
WMB Vs. ENB – Dividend Outlook
Both companies’ dividends are very safe. WMB’s dividend is expected to be covered by over 2x in the coming years, while ENB’s is expected to be covered 1.5x:
| Metric | WMB | ENB |
| DCF/Share 2022 | $3.68 | $3.89 |
| DCF/ Share 2023 | $3.68 | $4.00 |
| Dividend 2022 | $1.71 | $2.54 |
| Dividend 2023 | $1.78 | $2.62 |
| Coverage Ratio 2022 | 2.2x | 1.5x |
| Coverage Ratio 2023 | 2.1x | 1.5x |
The growth profiles for both businesses looks pretty weak based on analyst estimates, as WMB is only expected to grow its discounted cash flow (“DCF”) per share at a 0.7% CAGR through 2026 and its dividend per share at a 5.2% CAGR through 2026. ENB is expected to grow its DCF per share at a 2.2% CAGR through 2026 and its dividend per share at a 2.7% CAGR over that span. That said, we expect both businesses to outperform this guidance and give WMB a slight edge here given its superior dividend coverage ratio.
WMB Vs. ENB – Track Record
When it comes to track record, ENB is the clear winner here:
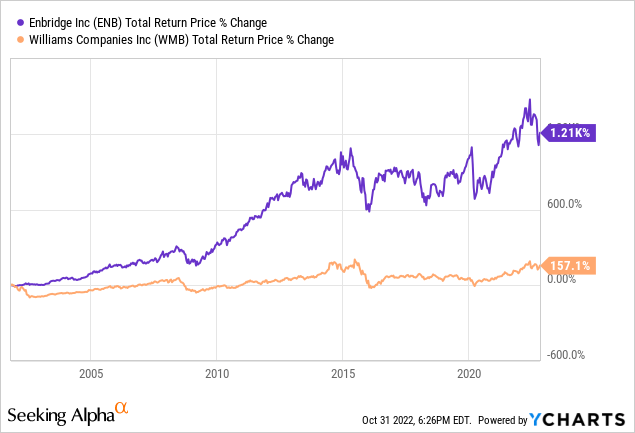
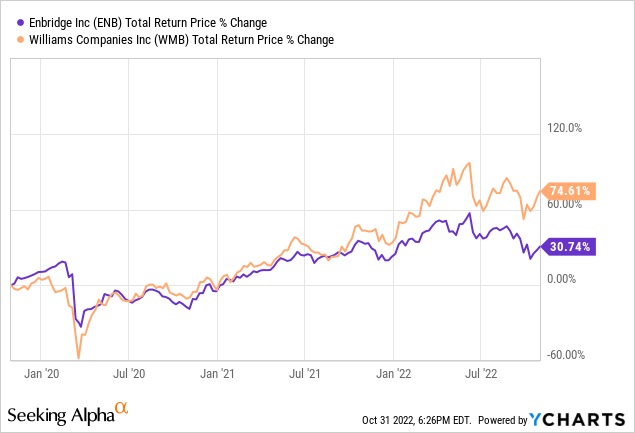
In recent years, however, WMB has more than doubled the total returns generated by ENB, as it has been generating very attractive returns on invested capital, so investors should keep that in mind when comparing the two:
WMB Vs. ENB – Risks And Catalysts
The main risk facing both of these businesses is a prolonged downturn in the fossil fuels energy sector, leading to a loss of access to debt capital as well as declining demand for their midstream infrastructure services. The main catalysts are sustained high energy commodity prices, leading to more favorable capital market conditions and greater demand for their infrastructure assets as producers increase production to capitalize on higher prices and greater demand.
The main difference here is that WMB’s fortune is more closely aligned to the demand and pricing for natural gas, whereas ENB’s fortune is more broadly spread across the midstream sector.
WMB Vs. ENB – Valuation
When it comes to comparing their valuations, ENB wins the dividend yield comparison convincingly. However, WMB is cheaper on an EV/EBITDA basis and P/DCF basis on both a relative and historical basis. As a result, we give the slight edge to WMB here.
|
Valuation Metric |
WMB |
ENB |
|
Dividend Yield |
5.2% |
6.9% |
|
Dividend Yield (5-Yr Avg) |
6.3% |
6.7% |
|
EV/EBITDA |
10.0x |
12.4x |
|
EV/EBITDA (5-Yr Avg) |
10.6x |
12.6x |
|
P/DCF (2022) |
8.9x |
10.0x |
|
P/DCF (2023) |
8.9x |
9.7x |
Investor Takeaway
This matchup really boils down to what you are looking for. We think a strong case can be made for either midstream business against the other here. WMB is better for investors looking for a concentrated investment in WMB, so as an addition to a broader midstream portfolio we prefer WMB at the moment. However, if we could only own one midstream stock in our portfolio and had to pick between WMB and ENB, we would pick ENB given its greater diversification and higher credit rating.
It is also worth noting that ENB is a Canadian stock whereas WMB is a U.S. stock, so keep currency fluctuations and tax implications in mind when deciding between the two.
Furthermore, for investors looking for higher current yield, ENB is clearly the superior option, whereas WMB offers investors greater growth potential. While we are finding more attractive midstream opportunities elsewhere right now, we still rate both WMB and ENB as low risk Buys at the moment.
Be the first to comment