

jetcityimage/iStock Editorial via Getty Images
Price Action Thesis
We present our detailed price action analysis on Costco (NASDAQ:COST) stock following our pre-earnings article. As postulated, we indicated that the stock was likely at a near-term bottom, given oversold technicals. We also highlighted a possible path for the stock to rally before meeting robust selling pressure at its near-term resistance ($483). That thesis has broadly played out over the past month.
COST is still testing its near-term resistance. However, we also noted that its momentum has shifted from bullish to bearish as it failed to regain positive flow. Notwithstanding, we have not observed a bull trap price action (significant rejection of buying momentum). Therefore, we posit that the market is likely still in a distribution phase before setting up the bull trap to force the subsequent steep sell-off. Given COST’s reversal from its bullish bias, we believe lower highs/lows are on the horizon.
Our reverse cash flow valuation model suggests that COST will likely underperform the market and its historical performance over the next four years. Therefore, we believe investors should use the current consolidation phase to layer out/cut exposure in COST.
As such, we reiterate our Sell rating on COST stock. New investors are urged to be patient, given its embedded growth premium.
Costco – Testing Its Near-Term Resistance As Expected

COST price chart (TradingView)
As seen above, COST bullish bias was thrown significantly off course by the double top bull trap that formed in April. As a reminder, we also cautioned investors of the presence of that bull trap in an early May article.
Given the extent and speed of its liquidation, COST fell into deeply oversold territory in mid-May. Furthermore, it formed a validated bear trap (significant rejection of selling momentum) predicated on its May lows, helping stage its recent bounce.
However, given its potency, we often underscore the importance of avoiding the initial bear trap after the appearance of a double top. Double tops are often early warning signs indicating a potential reversal in bullish bias. Notably, stocks could struggle to regain bullish momentum, even with a bear trap after a double top.
Consequently, we noted that COST’s bounce from its May bear trap has met with selling pressure at its near-term resistance ($483). But, we have not observed a bull trap yet. Therefore, we believe the market is using a distribution phase to draw in dip buyers before forcing a steeper sell-off subsequently.
As highlighted earlier, COST has lost its bullish bias as its momentum has turned bearish. And the longer that COST struggles to regain its bullish momentum, the higher the likelihood that the current consolidation is a distribution phase. Therefore, we urge investors to observe the price structures carefully.
COST – Premium Valuation Could Lead To Underperformance

Costco revenue change % and adjusted EBIT change % consensus estimates (S&P Cap IQ)
Despite the increasing likelihood of a recession, the consensus estimates (generally bullish) suggest a moderation (but not a collapse in Costco’s revenue growth).
As seen above, Costco’s revenue growth is projected to fall to 15.1% in FY22 before moderating to 8.4% in FY23. Notably, its adjusted EBIT growth is also estimated to weaken, moderating to 17.2% in FY22 before falling to 11.5% in FY23. Hence, the market has astutely priced in Costco’s potential forward weakness since April, corroborating the forward-looking perspective of price structures.
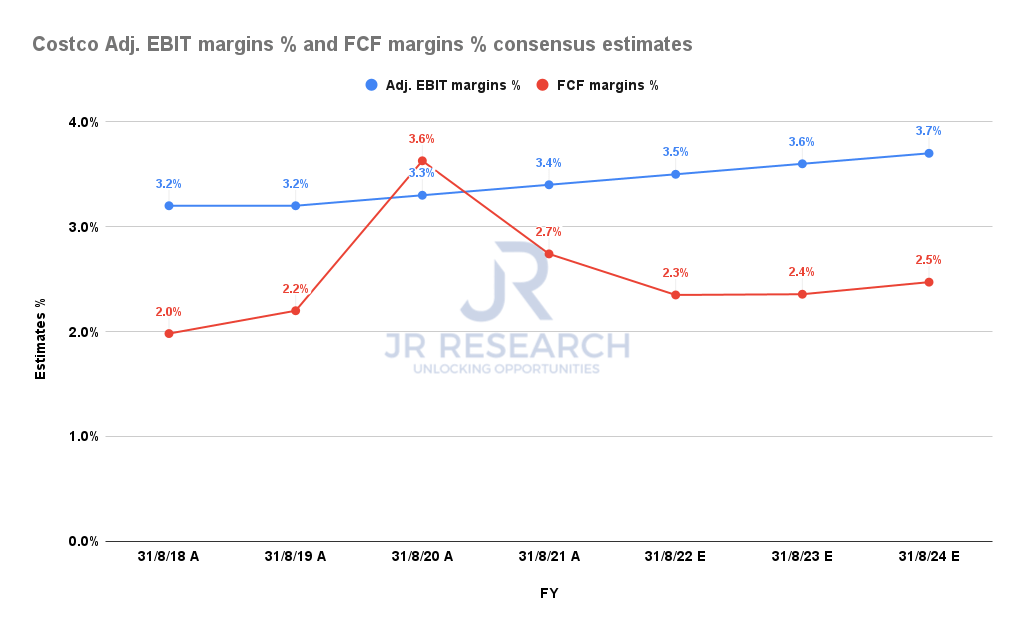
Costco adjusted EBIT margins % and FCF margins % consensus estimates (S&P Cap IQ)
Notwithstanding, Costco’s adjusted EBIT margins and free cash flow (FCF) margins are projected to remain robust, despite the recessionary fears. Costco’s defensive business and superb operating model have drawn plaudits over the years. Therefore, we believe the Street’s modeling seems credible.
| Stock | COST |
| Current market cap | $212.38B |
| Hurdle rate (CAGR) | 7.5% |
| Projection through | CQ4’26 |
| Required FCF yield in CQ4’26 | 4% |
| Assumed TTM FCF margin in CQ4’26 | 2.71% |
| Implied TTM revenue by CQ4’26 | $434.05B |
COST reverse cash flow valuation model. Data source: S&P Cap IQ, author
But, we think COST’s valuation has been driven to such heights that even its highly robust operating cannot sustain further outperformance.
Notably, over the past five years, COST has been a massive winner for its investors. It posted a 5Y total return CAGR of 26.56%, well ahead of the SPDR S&P 500 ETF’s (SPY) 11.93%. Therefore, it has significantly outperformed the market.
But, Costco also registered a 5Y revenue CAGR of 10.5%. Moreover, even the bullish Street’s modeling suggests a marked moderation in topline growth, as seen previously. Therefore, we believe it’s highly challenging for investors to expect Costco to deliver such outperformance moving forward.
As seen in our reverse cash flow model, we applied a hurdle rate of 7.5%, with an FCF yield of 4% (Vs. 5Y mean of 2.41%). With slowing revenue growth, we believe the market will likely ask for higher FCF yields to justify holding COST stock. It doesn’t make sense to expect the market to accept its average yields in a slowing environment.
Assuming a blended TTM FCF margin of 2.71%, we require Costco to post a TTM revenue of $434.05B by CQ4’26. However, the Street’s modeling suggests revenue of $259.93B in FY24 (ending August 2024). Therefore, we believe Costco will likely underperform significantly, as it’s unlikely to meet our revenue target.
Is COST Stock A Buy, Sell, Or Hold?
We reiterate our Sell rating on COST stock.
Notwithstanding, investors can wait for a validated bull trap before executing their sell orders. Otherwise, they can start to layer out/cut exposure and increase their selling cadence if a bull trap appears subsequently. We posit that COST is unlikely to regain its bullish bias at its current valuation. It needs to fall much further before the stock can be attractive again.
Our reverse cash flow model indicates that COST is still overvalued. Also, investors adding to the current levels should be prepared for underperformance.
Be the first to comment