


Money doesn’t grow when it’s flying in a circle.
pavlen
Cornerstone Strategic Value Fund (NYSE:CLM) is a closed-end diversified management company which seeks to generate returns by investing in equity securities in the US and beyond. Investors may find their interest piqued by the current 24.97% dividend yield and with monthly distributions already announced through the end of the year some dividends should come through implying that yield.
But the company has also already announced that 2023 distributions will be set at 21% of whatever NAV is at the end of October 2022. With the most recent NAV of $6.94, it would need to rise considerably in the next month for the current $0.1808 monthly distribution to continue.
Given this and the reality that the distributions are eating away at NAV this is a strong sell.
CLM’s Portfolio
They published their certified shareholder report on August 26th outlining the portfolio as of June 30th. This filing gives a window into the fund’s portfolio which can help us to understand performance and if the dividend is sustainable.
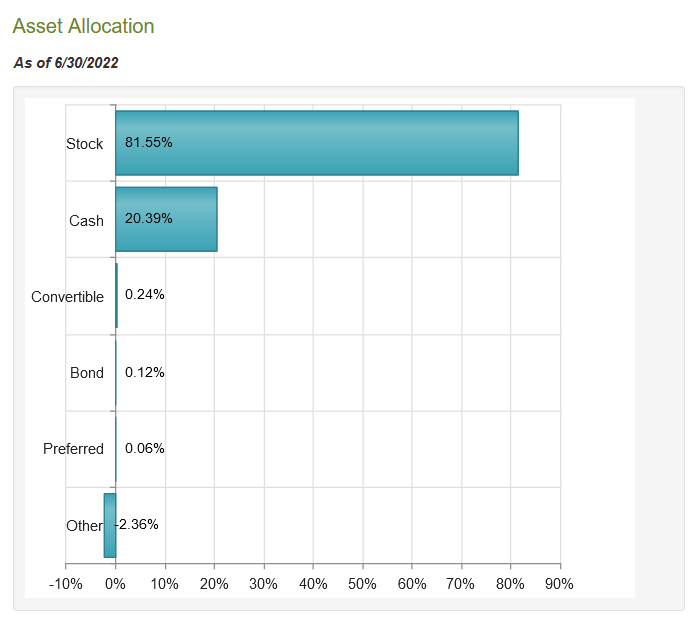
The company had 165 holdings with the majority held in stocks and about 20% held in essentially cash.
CEFConnect
I say essentially because the position technically is in Fidelity Investments Money Market Government Portfolio (FIGXX) which is a mutual fund. This mutual fund normally invests at least 99.5% of total assets in cash, U.S. government securities and/or repurchase agreements that are collateralized fully. This vehicle is a proxy for cash and historically has essentially just preserved capital. Here are some return data points for FIGXX from TD Ameritrade.
TD Ameritrade
If we look at CLM’s stock holdings we can see their top positions:
|
Apple Inc |
$82.31M |
5.30% |
|
Microsoft Corp |
$79.10M |
5.09% |
|
Alphabet Inc Class C |
$61.25M |
3.94% |
|
Amazon.com Inc |
$46.73M |
3.01% |
|
UnitedHealth Group Inc |
$37.75M |
2.43% |
|
Tesla Inc |
$35.02M |
2.25% |
|
Berkshire Hathaway Inc Class B |
$33.85M |
2.18% |
|
Visa Inc Class A |
$22.05M |
1.42% |
|
Pfizer Inc |
$21.23M |
1.37% |
We can see a number of tech names in this chart. In fact the portfolio is 19.96% allocated towards technology stocks which is its highest concentration. Healthcare stocks come in second at 12.94% of the portfolio.
According to data from CSIMarket.com the tech sector has seen -37.15% YTD performance. The healthcare sector is down -30.81% YTD.
Net Asset Value Review and Peer Comparison
Net asset value on June 30th came in at $7.60 per share. If we look at the website for CLM we can find a more recent NAV of $6.94 on September 23rd. With the stock price at $8.54 this represents about a 23% premium to NAV.
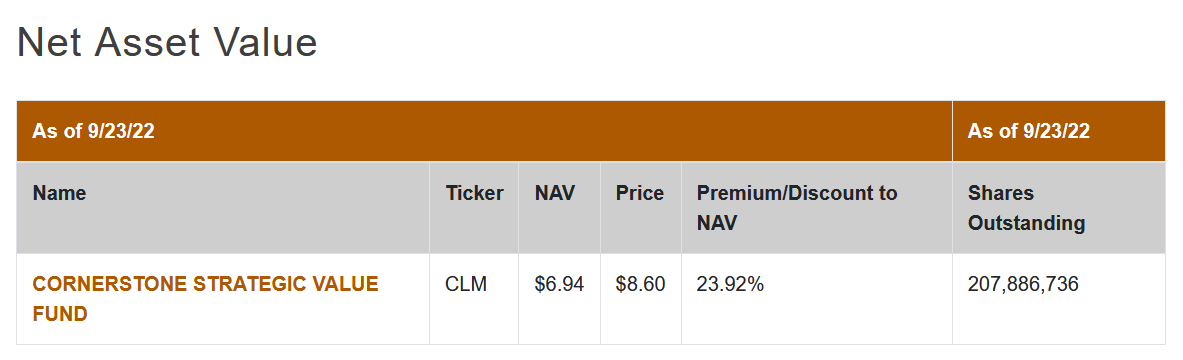
CLM Website
Within the context of CLM trading at a premium to NAV seems to be normal. According to data from CEFConnect the 52-week average premium to NAV is 35.68%. We can also note that the $6.94 NAV is at a 52-week low currently.
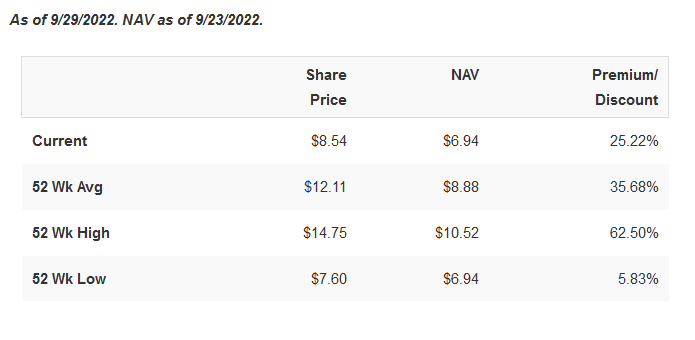
CEFConnect
This was a bit puzzling to me. As I looked at the holdings of the company there didn’t appear to be anything particularly unique about this fund and yet on average over the last 52-weeks it traded at what I judged to be a significant premium to NAV. So I started to pull some date CEFConnect on peer CEFs to see what an average premium might look like.
Pulling a bucket of CEFs labeled under the same strategy as CLM I was left with 21 funds. According to this table the average is actually a -7.23% discount to NAV.
If we consider all 448 CEFs which come up in CEFConnect’s Daily Pricing tool the average discount to NAV is similarly -7.63%. So clearly it is not normal for a CEF to trade at such a premium. But the data revealed something else that was abnormal about the fund which may explain the premium: the high dividend yield.
CLM’s dividend yield of 25.41% is over double the peer group average of 10.89%. If we consider the entire group the average dividend yield is even lower at 9.23%. Management has noted in their announcement of distributions through the end of the year that “These distributions are not tied to each Fund’s investment income or capital gains and do not represent yield or investment return on each Fund’s portfolio.”
Translation: they are using cash to pay these distributions which are coming straight out of the NAV. The press release itself highlights this when it notes that “a substantial portion of each Fund’s distributions made during the current calendar year is expected to consist of a return of the stockholder’s capital.”
They also announced that for the upcoming year the distributions would be pegged at 21% of whatever NAV is at the end of October 2022. If we use our most recent NAV of $6.94 and a 21% annual distribution we get an estimated monthly distribution of $0.1215. Monthly distributions through the rest of the year are at $0.1808 which is where the 25% dividend yield comes from.
So if distributions were set based on today’s NAV, the distribution in 2023 is likely to be cut by 33%. Unless one believes that between now and the end of October there is a rally in the markets it seems quite likely that this distribution cut will happen. In order for the monthly distribution of $0.1808 to be maintained NAV would need to hit $10.33 by the end of October – that’s a 49% increase.
What I suspect is more likely is that either NAV will be around current levels or even lower as the market continues to roil. Overall this is a strong sell signal and indicates that the current dividend yield numbers are implying a rosier picture than is indeed likely.
Conclusion
For those that are interested in CLM long term I think selling today and waiting to see where NAV is at the end October is likely a prudent approach. The distribution is likely to be cut and with that there will be pressure on the stock price as a result of the news. With the October NAV number one can calculate the expected 2023 distribution yield overall and decide then if they want to buy back in.
But I would caution those who look to this as a long-term investment. As noted above, the distributions are a return of capital, meaning the company is simply giving you back your own money. While it may seem like month-to-month you are generating a high level of income with the double-digit dividend yield, the reality is this money is coming directly out of the company’s NAV and ultimately will drive the stock price lower.
One look at the stock price chart over a long period of time paints the picture.
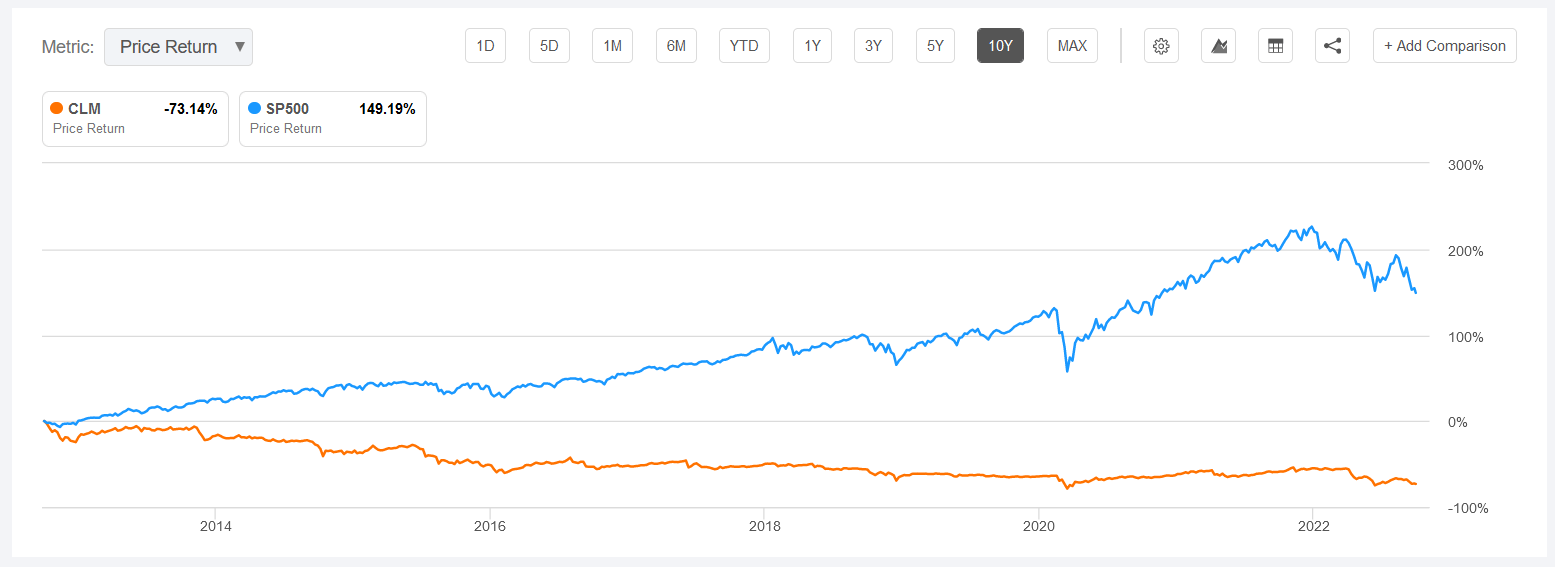
Seeking Alpha
Looking over a ten year time frame we can see that the price return on CLM has been -73.14%. So we can see that over time the stock price is declining. But this isn’t the whole picture though as it doesn’t include the distributions as part of the returns. Instead we should look at a total return chart for an understanding of what an investor might have made if they bought and held for the last ten years.
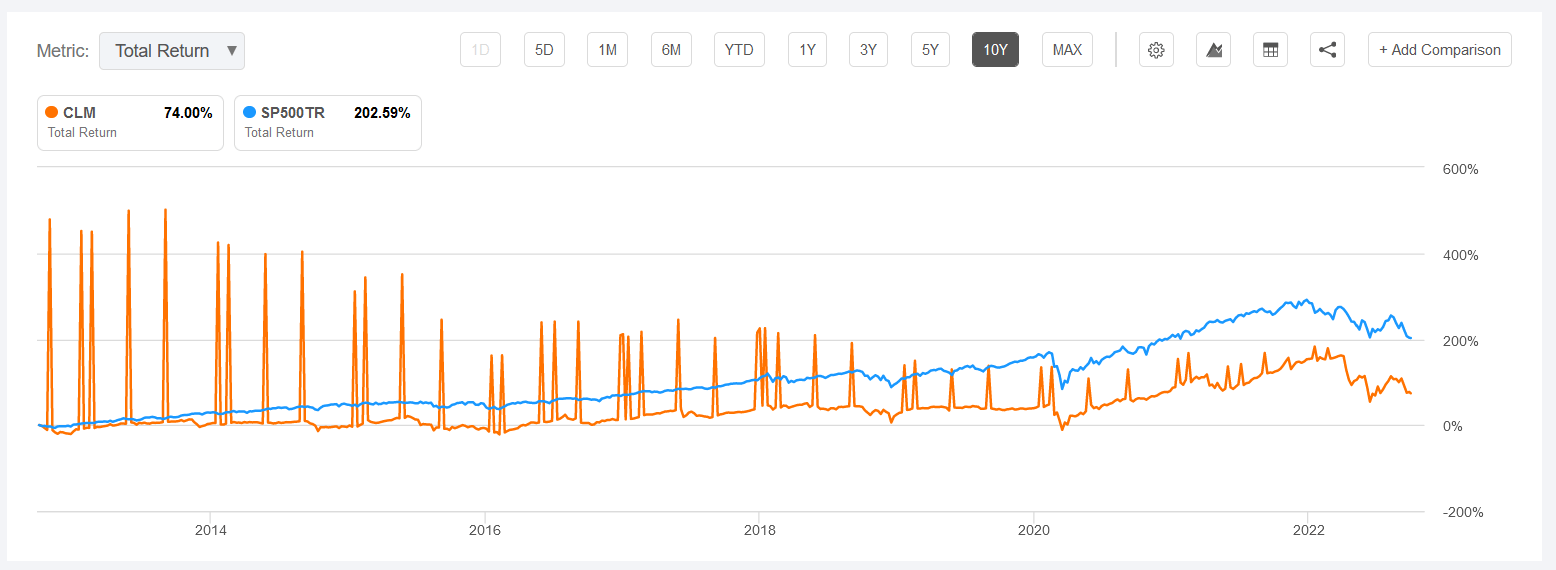
Seeking Alpha
The picture is a bit better here in that there is a positive total return of 74% over the last ten years. This implies annualized return of just 7.4% over that period though as compared to the S&P 500’s 10-years annualized return of 20.26%. This means that investors in CLM would have made nearly triple their money if they just invested in the S&P 500.
So don’t be fooled by the high dividend yield. That is just your money coming back to you monthly and is eroding value in the company. This is not a strategy for sustainability. Nor returns.
Be the first to comment