

U.S. DOLLAR ANALYSIS & TALKING POINTS
Recommended by Warren Venketas
Get Your Free USD Forecast
USD FUNDAMENTAL BACKDROP
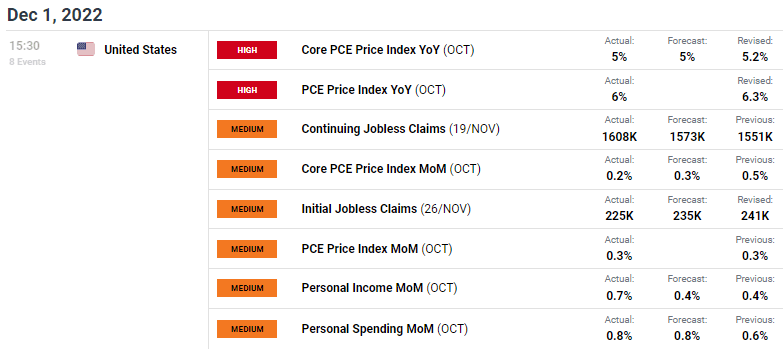
The Dollar Index (DXY) remained depressed after the much anticipated core PCE print was released. On the face of it, the principal PCE and Core PCE indexes delivered forecasted figures (see economic calendar below) but looking at the better than expected initial jobless claims seemed to continue with the narrative delivered by Fed Chair Jerome Powell yesterday.
Trade Smarter – Sign up for the DailyFX Newsletter
Receive timely and compelling market commentary from the DailyFX team
Subscribe to Newsletter
ECONOMIC CALENDAR
Source: DailyFX economic calendar
Looking at the Federal Reserve’s interest rate probability matrix through to December 2023 (see below), the terminal rate has fallen further to 4.913% in May.
FEDERAL RESERVE INTEREST RATE PROBABILITIES
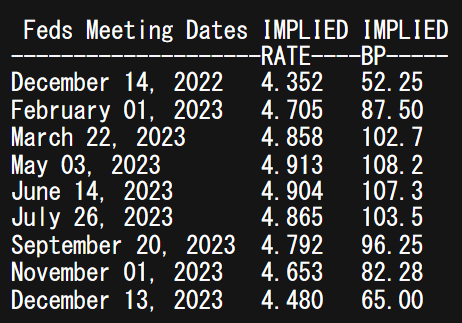
Source: Refinitiv
Today’s core inflation report should not be taken in a solely dovish light because ore personal consumption expenditure is still increasing albeit at a lesser rate than expected which keeps the core element of inflation elevated an entrenched for now. The mandate from the Fed thus far in 2022 has been to combat inflation and has the capacity to remain on an aggressive path due to the strength of the U.S. economy relative to other nations.
TECHNICAL ANALYSIS
U.S. DOLLAR INDEX DAILY CHART
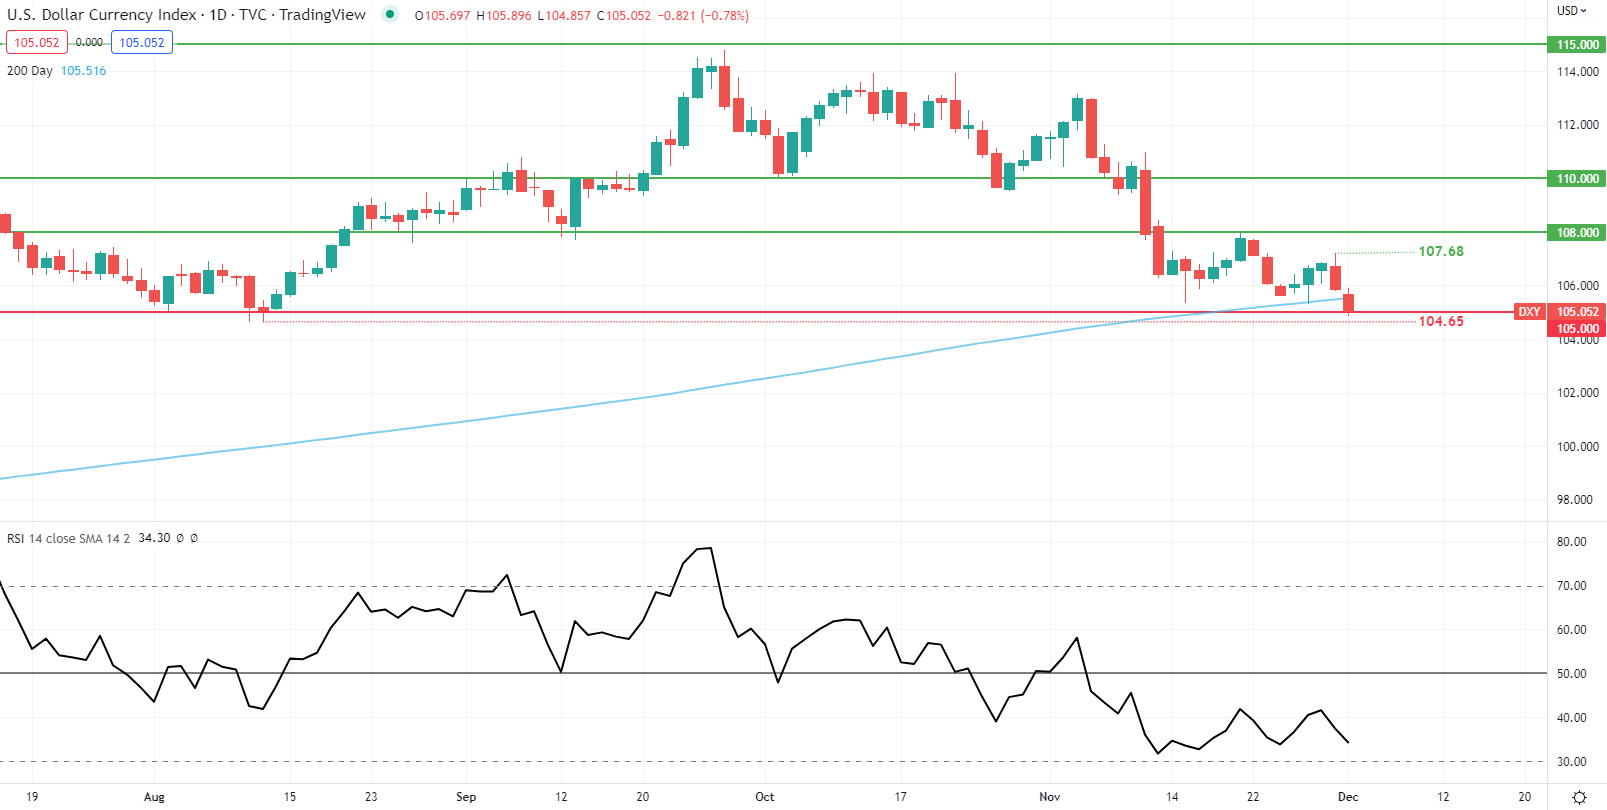
Chart prepared by Warren Venketas, IG
Predictably, the daily DXY price action reacted negatively to the news pushing up against the 105.00 psychological support handle for the first time since early August. In addition, the 200-day SMA (blue) has been breached which could spark a move lower should the daily candle close below this key area of confluence – the DXY has not traded below the 200-day SMA since June 2021.
That being said, the Relative Strength Index (RSI) suggests bullish divergence (green) where prices are moving lower while the RSI shows slowing bearish momentum. Traditionally, an upside reversal is seen but timing can be ambiguous but does give USD bulls some optionality.
Resistance levels:
Support levels:
Contact and followWarrenon Twitter:@WVenketas
Be the first to comment