

William_Potter/iStock via Getty Images
My bear market activity is pretty much over this time around. My transactions this year have increased the upside of my portfolio relative to what it would have been without them.
My plans for a next lower low, if it happens, are in place. Whether now or after such a low, the wait until it is time to sell much probably won’t be short.
This has made it a good time for contemplation.
Recent years have given me confidence that I can make gains across bear market cycles. My temperament is compatible with that. I’ve developed enough expertise in REITs and in energy to invest on the basis of knowledge.
My tactics have been classic value investing. Buy low and sell high. Specifically, buy undervalued stocks and sell them when they are close to fair value. The best opportunities for this approach tend to come during contractions or bear markets.
Recently two questions have drawn my attention. The first relates to my personal future as an investor.
I’m nearly 68, my father died at 71, and my health is not good. I’m not at death’s door, but many people in my circumstances experience severe adverse health events.
In this context, how many bear markets do I have left while able to invest actively? I need to think about the fact that any bear market could be my last as an active investor.
The second question relates to dividends. Some of my current stocks are paying large dividends at the moment. To what extent do I want to hold those stocks and retain that dividend income even as yields drop with recovery of prices?
Thinking About Dividend Positions
At this point my portfolio is composed of three parts. First, 45% is in positions paying dividends less than 6% and owned for their upside in price. Second, 45% is in eight positions paying an average of 7% now. All but one of these also have significant likely upside in price. Third, 10% is in investments held outside my accounts with my broker, mostly in private equity.
Here we will ignore that 10%, producing a conservative result. We also ignore my Cognitive Decline Portfolio, discussed here and not included in any portfolio fractions given in the present article. I try not to think about it.
One recent conundrum relates to the stocks that now have high yields, all but one of which are listed just below. (That one is a position not disclosed here because neither the marketplace owner nor I have written about them publicly.) The list below shows the other seven, with links to articles of mine (including one available exclusively to members of High Yield Landlord).
These firms all carry investment-grade ratings on their debt. They all have solidly profitable business models. In my informed opinion, all are positioned to sustain their dividends, and to grow them to various extents.
These firms also all easily cover their dividend payouts. In my circumstances, it would make little sense to take chances on dicey economic situations that were more likely to produce enduring dividend cuts or permanent loss of economic value.
I could just hold these positions, quit thinking about upside for them, and let the earnings grow. The dividends from them now cover 43% of what my net expenses would be, if my non-investment income were limited to my pension-like cash flows.
This possibility motivated me to do the models below. The question is whether the choice on this issue creates large differences, especially under adverse circumstances.
Context for Models Below
My several articles based on Monte Carlo simulation codes I wrote emphasized that worst cases are not a sensible basis for planning for most people. Most people would be better served by following a path that is likely to succeed, in the knowledge that they will have to adjust if they happen to be very unlucky.
That said, the worst cases do make useful stress tests. This informs the following.
It is highly likely, in my view, that we will see a full recovery from the current bear market before what comes next. I also agree with Calafia Beach Pundit that the current inflationary spike is about over, for monetary reasons.
So few people grasp that increased demand in one area cannot produce an overall change in prices, without a supportive increase in the supply of money (or in its velocity, but changes there are slow). The coming collapse in the inflation rate has been baked into the monetary cake for months.
Because I expect a recovery, and based on my understanding of my portfolio, all my modeling below is based on the assumption that the next two years each produce 25% gains.
If this does not happen, too bad. I will adjust.
Several other assumptions are used. Each makes a conservative choice that also simplifies the calculations.
- All supplementary income vanishes after 2022.
- The private equity and other non-stock investments I have (about 10%) lose all principal and come to nothing.
- As soon as the upside from the recovery has occurred, something changes in my life and my “upside” funds go into an S&P 500 index fund.
- At that time one of two things could happen with the high-dividend positions.
The high-dividend positions could be sold, with the proceeds placed also in the index fund. Alternatively, they could go into an account where they are held indefinitely and continue to generate income.
All models assume that the initial value of the portfolio is $2M, which is not the value of my actual portfolio. The portfolio seeking upside, the “upside portfolio,” is usually set at $1M. The other $1M generates an initial $70k of dividends.
When the high-dividend positions are kept, the model assumes that the dividends grow at a 4% rate from their present value. The upside positions provide the funds to support expenses above the dividend payments of the high-dividend group.
They upside positions are also assumed to pay the S&P 500 average of 2% in dividends. For some models, this is taken to be the entire portfolio.
The expenses (above pension-like income) are set to an initial value of 8.5% of the current portfolio, consistent with my current expenditures. Note that, after the recovery from the bear market, they will be a much smaller fraction of the portfolio value.
I do detailed projections of my anticipated expenses over time. These find that the funds (beyond pension-like ones) needed to support present spending trends increase approximately at the assumed inflation rate. The following assumes this to be the case.
Outcomes in a Below Average Decade
In this spirit, consider first 12 years during which those first two years of recovery are followed by 10 years having a 7% CAGR of price. This is well below the long-term average, so the likely outcome would be better than that found from this model.
RP Drake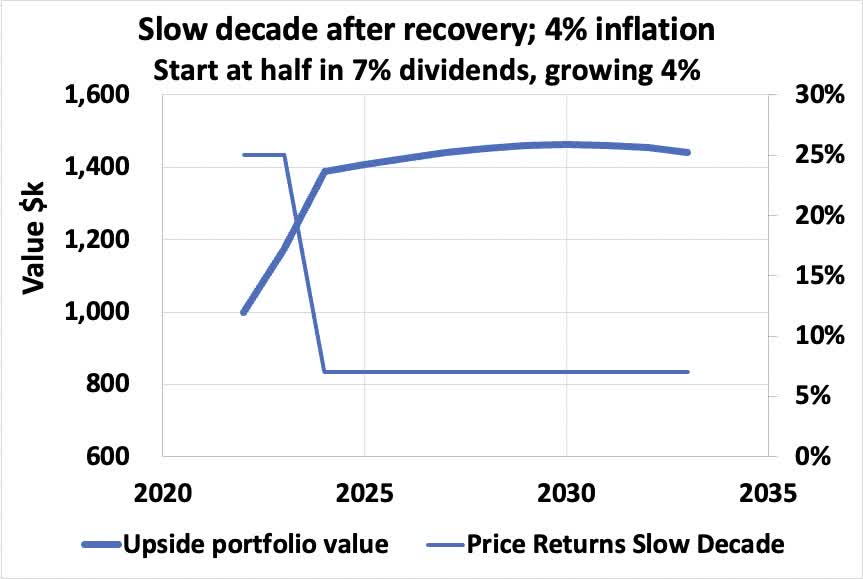
Here the thin line shows the price returns (right scale). The thick line shows the value of the upside portfolio (left scale). The dividend-paying portfolio remains untouched.
In this case, the upside portfolio holds its nominal value but loses real value to inflation. Slightly higher values of the returns produce rapidly growing portfolio values.
What I take from this is that my funds are highly likely to endure well enough. This sets the context for interpreting results from more adverse cases.
Flat Decades and the 1970s
The S&P 500 is well known to have flat decades, when net price returns are very small. The 2000s was one such. Another was the 1970s.
Simple Stock Investing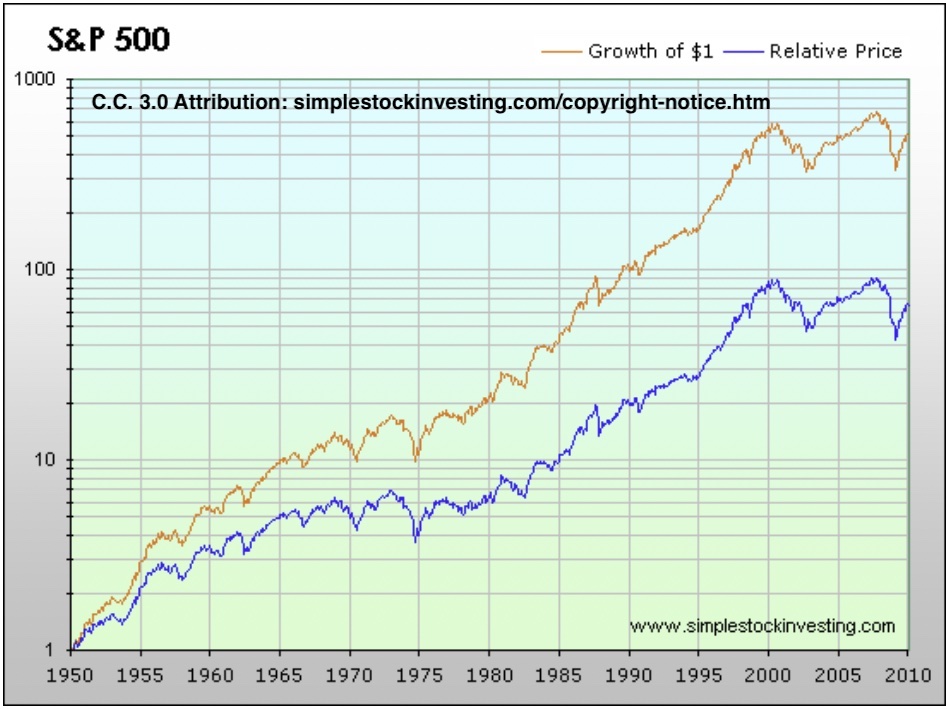
These decades are separated by periods of rapid price growth. In combination, both types of periods have produced the oft-quoted nominal price returns of 10.5%.
But the 1970s were much worse than the 2000s because inflation was much larger. The combination of high inflation (averaging 7% per year, and spiking later in the decade), no net price returns, and two bear markets was brutal. The real value of the S&P 500 Index dropped by half over that decade.
Simple Stock Investing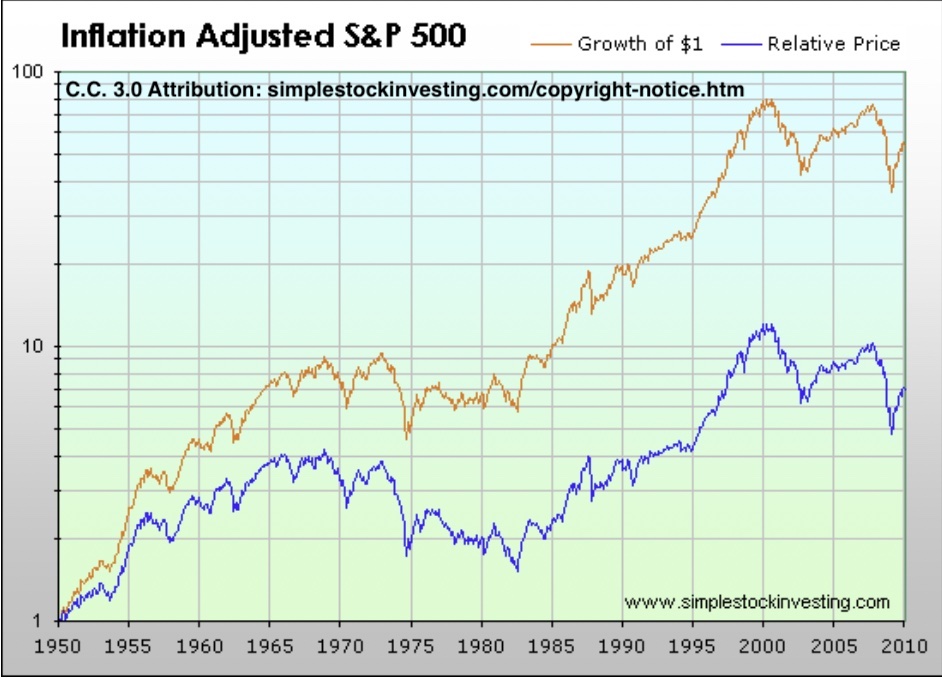
That decade was especially brutal for retirees. For those dumb enough to hold the classic 60/40 portfolio across that mess, it all added up to make 1966 the worst year in the past century to retire, with nearby years not much better.
Curiously, despite the bad reputation of the 1970s, GDP rose more than 30% across that decade. Some of that increase went to increased dividends. Yield doubled and so did the dividends, since price was flat.
Simple Stock Investing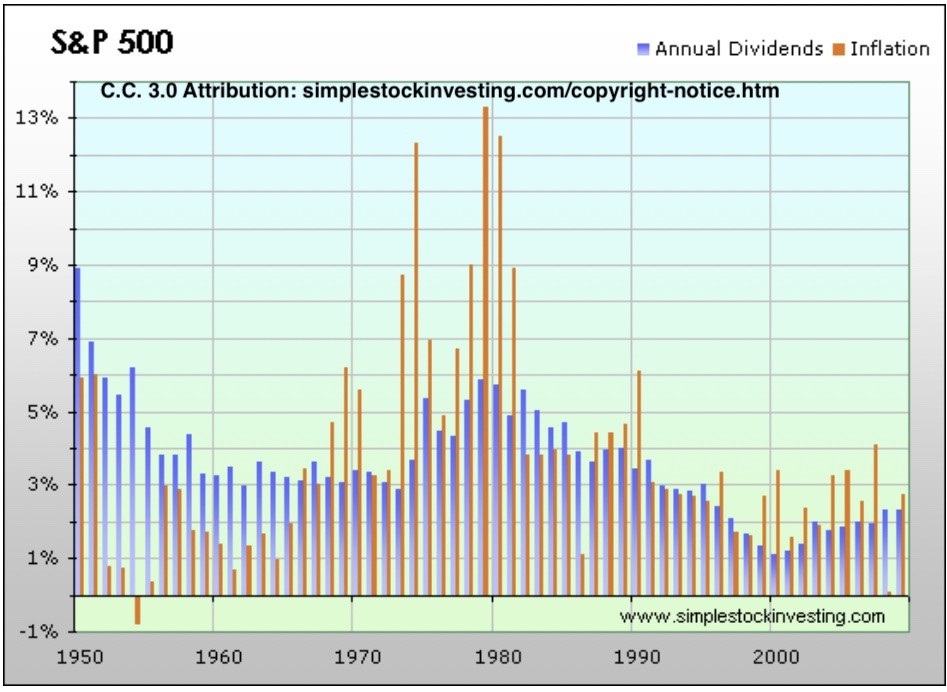
I have also read that commodities and real estate did well across that decade. This makes sense, though I did not go looking for data to show here.
Four of my high-dividend payers are in energy and three are REITs. It is not unlikely that dividend growth from them would continue across some next bad decade whose history rhymed with the 1970s.
That certainly could happen in the 2020s. Overall, though, the scenario of high inflation and moderate interest rates advocated by Lyn Alden Schwartzer, rhyming with the 1940s, seems more likely to me.
The results shown next compare output from a model using the actual returns for the S&P 500 across the 1970s with output from a model for which the S&P 500 was purely flat. For this purpose, the entire portfolio was assumed to pay a 2% dividend.
RP Drake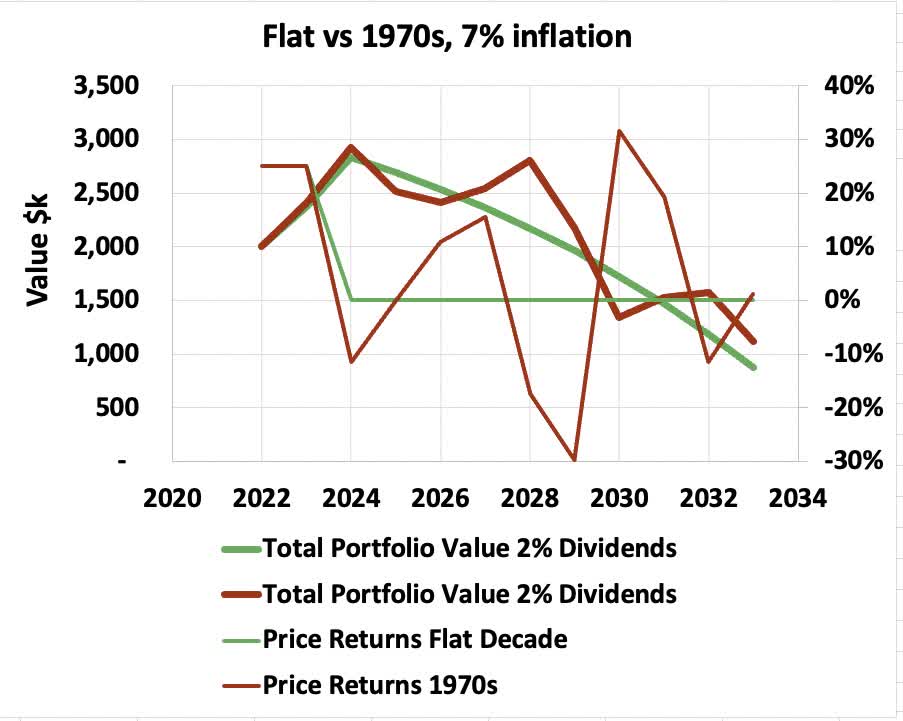
The thin lines show the annual price returns. The thick lines show the portfolio value. We see that the portfolio loses about half its nominal initial value, and two-thirds of the post-recovery value.
Those are nominal returns; real returns are a factor of two worse. On the one hand, the portfolio is not fully depleted before I hit age 80 (2034). On the other hand, there is very little value left.
Anyone finding themselves on a path like this needs to make changes. To sustain the nominal value of the portfolio one needs to reduce expenses by 3% per year. To keep its value constant after inflation, the reduction would need to be nearly 10% (but this is not a goal as such).
Results with Dividend Payers
The above sets the stage for what seems a really interesting question to me. Does one do better or worse by leaving half the portfolio in stocks like my current high-dividend payers?
The models for this used a flat decade for the S&P 500, with no growth. They set the inflation rate at 2%, 4%, or 7%. This first result shows the value of the upside portfolio.
RP Drake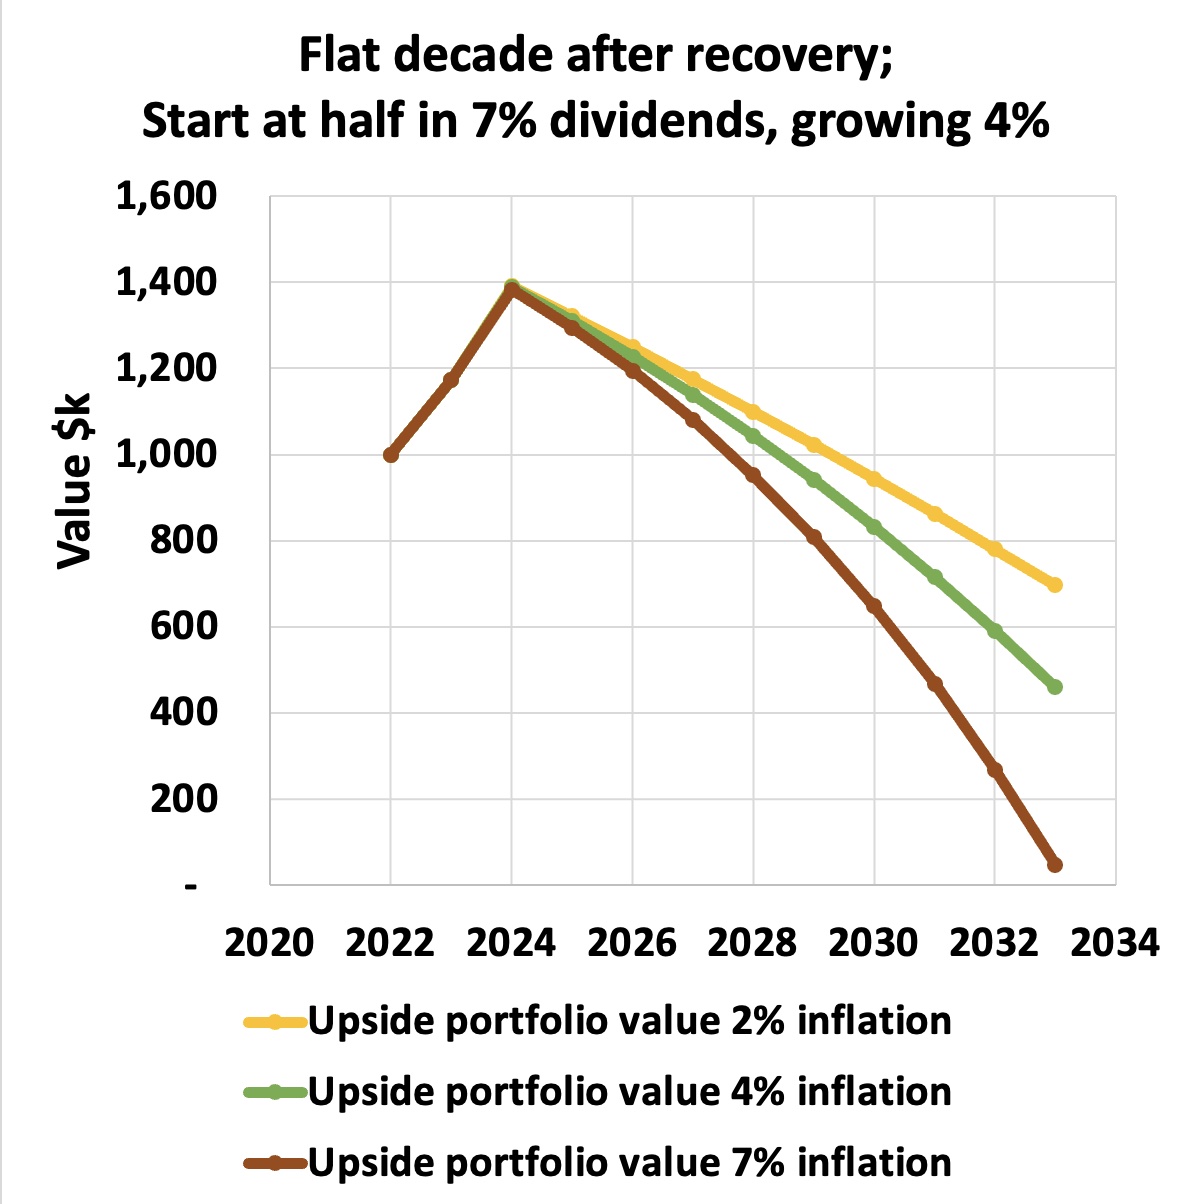
We see that the 2% inflation rate exhausts half the nominal value of the upside portfolio across the flat decade. In contrast, the 7% inflation rate exhausts nearly all of it.
But in both cases, the value of the dividend-paying stocks remains untouched. And considering the industries they are in, that value well might go up significantly.
If one adds the peak value of the dividend-paying stocks from the model to the result just shown after 2024, one gets something that can be directly compared to the plot in the previous section.
RP Drake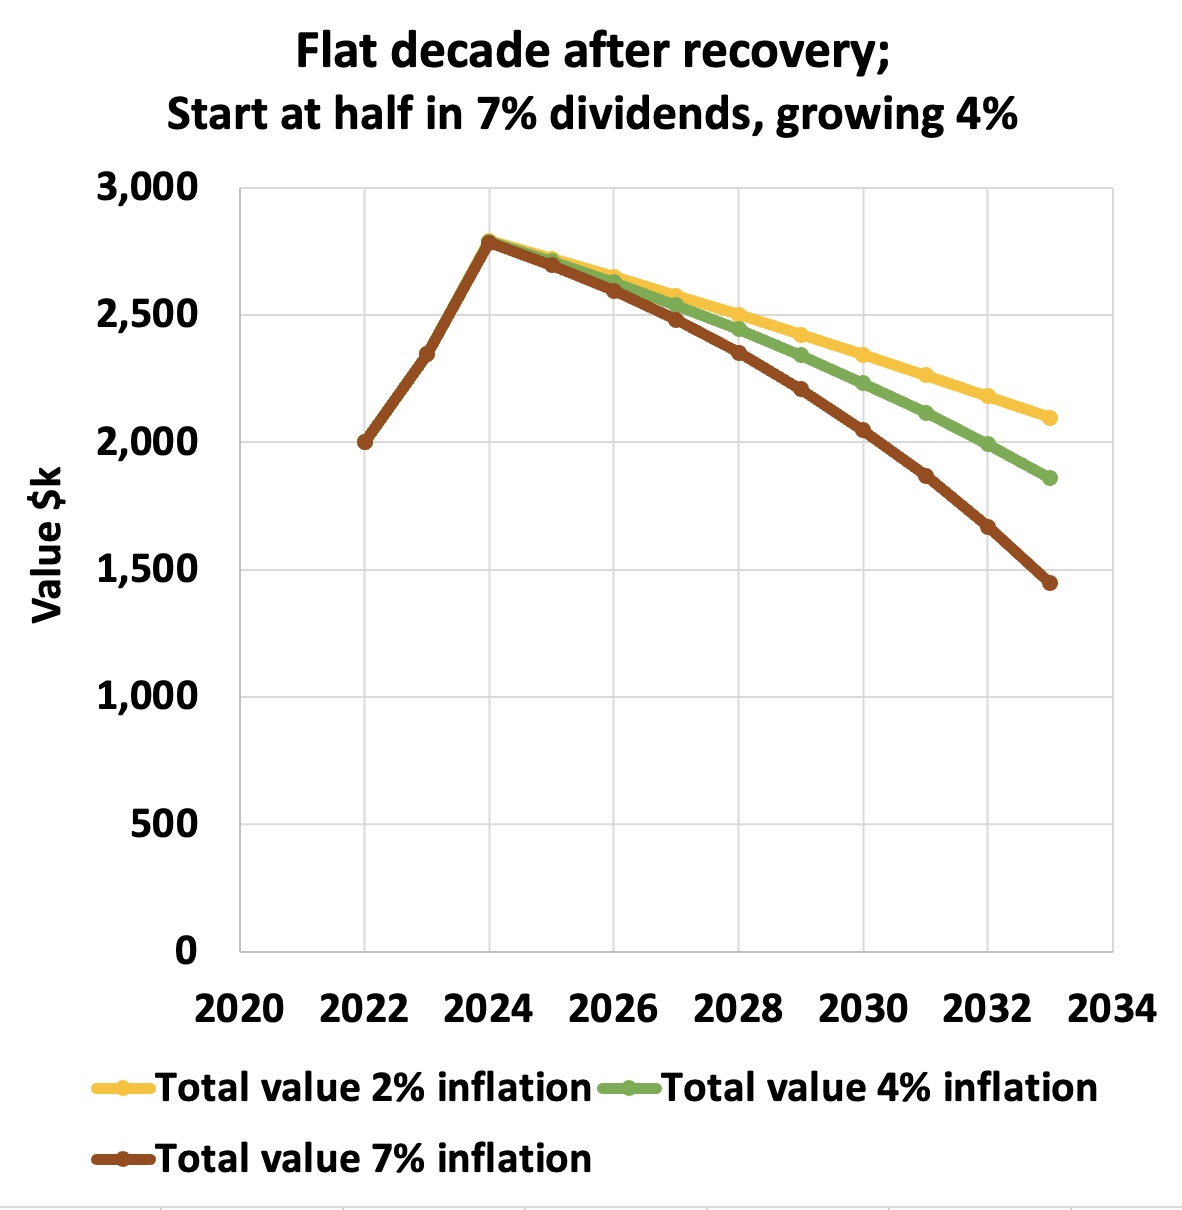
For the high-inflation case, the outcome of the model with the dividend payers is a few tens of percent better than the result in the previous section. What seems more significant to me is that it is not worse.
Of course, this result depends on those eight companies continuing to prosper and not making permanent cuts of their dividends. The loss of income from temporary cuts is not so important.
Implications
The biggest picture point is worth recapturing. In all but the most negative scenarios based on US history, my finances will be fine whether or not I remain able to intensively invest.
The difficult cases above are all highly unlikely. One thing worth knowing, though, is that in the worst of them I would face a need to adjust my spending. Another thing worth knowing is that the choice between retaining the high-dividend positions or selling them does not make a dramatic difference.
To my mind there are also qualitative reasons to carry stocks like my current high-dividend payers. These reasons are not captured in this type of calculation, or even in more sophisticated statistical ones.
Most of them are in sectors that ought to do well in a decade like the 1970s (or like the 1940s). Their large dividends also make it easier to reduce or delay selling stock during years when the market is down.
But the case is not strong for necessarily sustaining my dividend positions at their present level. Larger gains can be had if one successfully buys low and sells high.
Those high-dividend payers are also sensible places to leave money until compelling opportunities arise. At the moment doing this is my inclination. And if they crash when the market does, holding them through to the other side is no issue.
The dividends from several firms I hold may turn out to keep up with inflation. If so, the worst cases would not be as bad as is shown above.
But there is also risk in holding large positions in the stocks that are paying high dividends. Perhaps I will turn out to have misjudged various economic and political possibilities that would destroy the ability of some of these firms to pay them.
Even worse, perhaps their very existence will be threatened. Either would clearly be bad for me.
At the end of the day, you do what you do and take your chances.
I hope these musings and models prove useful to readers, as has often been true before. Best wishes for success in your own investing.
Be the first to comment