

Solskin
Back in January, I expected Medical REITs to slightly underperform the REIT average. Instead, they have slightly outperformed, returning (-30.49)% YTD, compared to (-32.70)% for the Equity REIT index, according to Hoya Capital Income Builder.
Hoya Capital Income Builder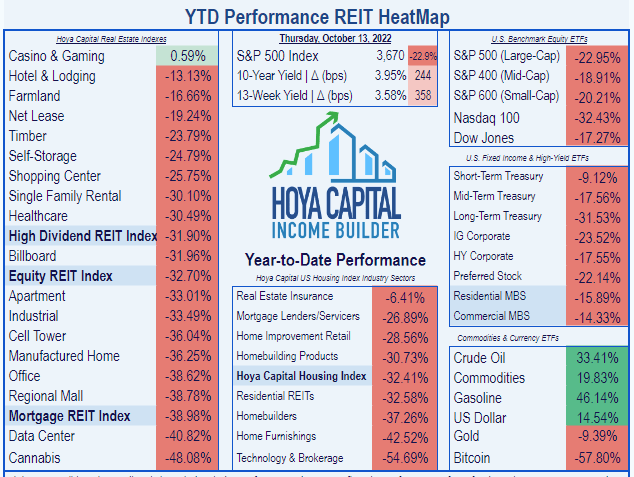
Thanks to the broad sell-off in the REIT sector, there are a lot of tasty Yields available. For example, while the average Medical REIT now yields 5.41%, Community Healthcare Trust (NYSE:CHCT) yields slightly above that, at 5.59%.
Meet the company
Community Healthcare Trust
CHCT owns over 150 medical facilities, spread across 34 U.S. states.
Company website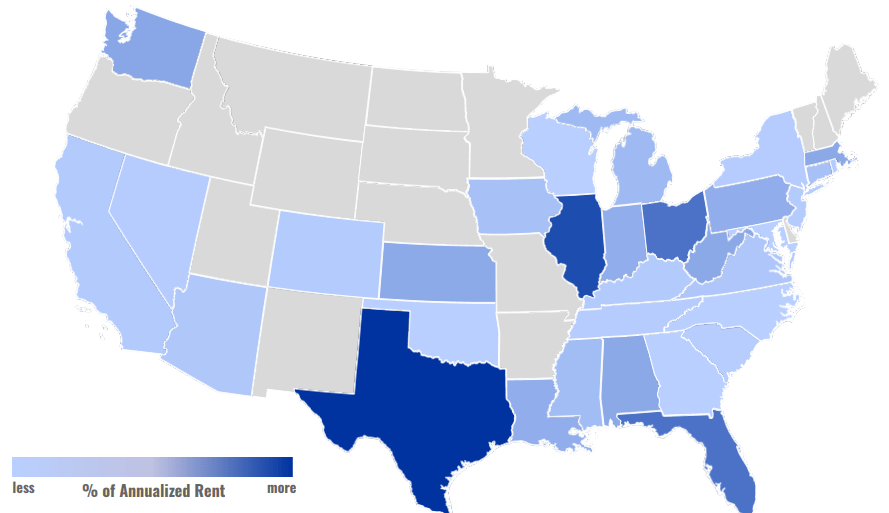
About 30% of CHCT’s revenue comes from MOBs (medical office buildings), with 17% from AIBs (acute inpatient behavior facilities), and another 17% from IRFs (inpatient rehab facilities).
Company investor presentation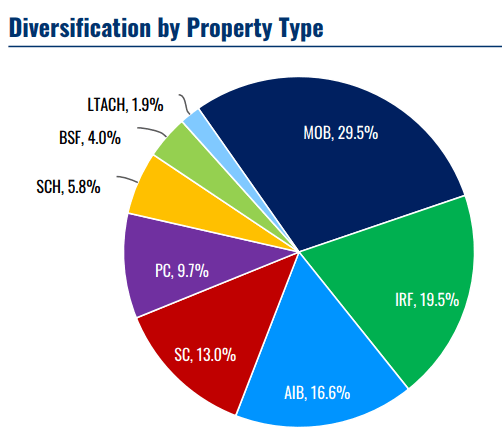
The core of CHCT’s business model is its ability to leverage the personal relationships between the management team and a wide array of medical providers, built up over many years in the medical real estate business, to discover off-market or lightly-marketed acquisition opportunities. Thus, they avoid competitive bidding and secure properties at favorable prices, resulting in cap rates well above average.
I have written in more detail about this company’s operations in articles last May, and last December.
CHCT’s biggest problem over the past year has been its struggles to find new tenants for its medical facilities when leases expire. The secondary markets where CHCT operates typically don’t have a lot of medical providers competing for space, so new tenants can be hard to find. The company strives for an overall portfolio occupancy in the low 90’s, but late last year, that number fell into the high 80’s. In Q1 2022, occupancy ticked up to 89.9%.
All the executive officers of CHCT have elected to receive 100% of their compensation in stock sales, with 8-year cliff vesting. This does a nice job of aligning management incentives with shareholder interests, and the company is completely transparent as to the amounts received (see below). Over 75% of each executive’s pay over the past three years has been derived from performance-based incentives, with two minor exceptions.
Company Q2 Supplemental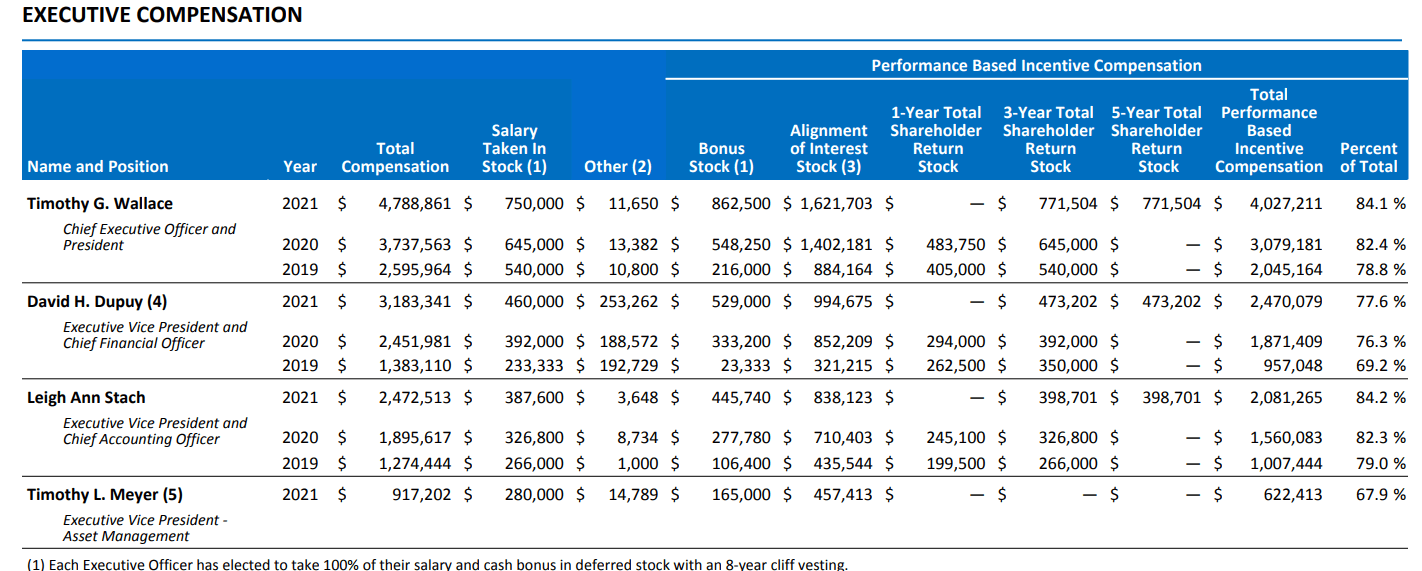
Quarterly results
According to the company’s Q2 2022 supplemental:
- revenues for Q2 2022 were $24.0 million, up 2.4% QoQ and up 6.0% YoY.
- expenses ran $15.7 million, up 2.6% QoQ and up 10.3% YoY, due in part to a substantial increase in stock-based compensation.
- Stock based compensation registered 9.1% of revenue, up from 9.0% in Q1 and 7.1% a year ago, in Q2 2021.
- Net income was $5.6 million, up 1.1% QoQ and down (-2.2)% YoY.
- Net Operating Income was $20.0 million, up 3.1% QoQ and up 5.8% YoY.
- EBITDAre came in at $16.4 million, up 2.2% QoQ and up 2.7% YoY
- Adjusted EBITDAre was $18.6 million, up 2.3% QoQ and up 5.7% YoY
- Funds From Operations totaled $13.7 million, up 1.5% QoQ and up 3.2% YoY.
- Adjusted FFO came to $15.0 million, up 1.1% QoQ and up 7.6% YoY.
- NOI per share registered $0.21, flat from Q1 and down (-4.5)% YoY.
- FFO per share reached $0.57, up 1.8% QoQ and also YoY.
- AFFO per share was $0.62 per share, up a penny QoQ and up 6.9% YoY.
Company Supplemental Info Q2 2022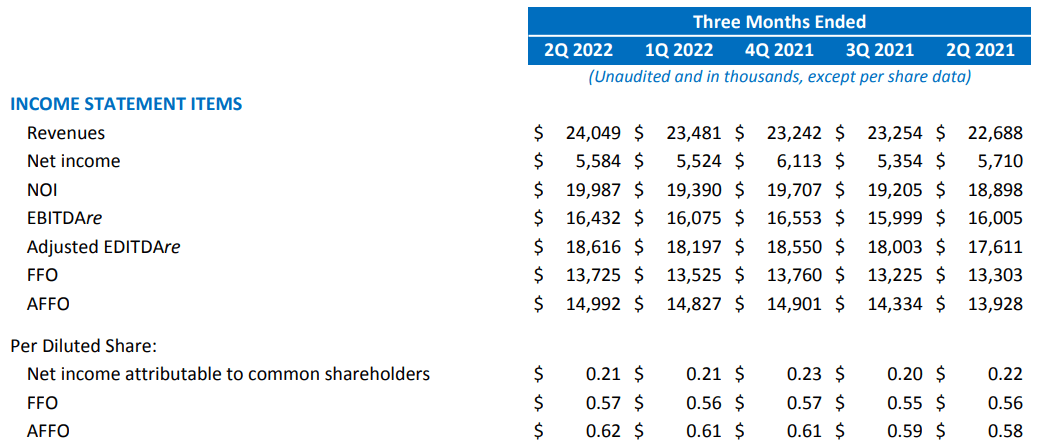
- CHCT bought back some shares, resulting in 24.2 million shares outstanding as of Q2 2022, compared to 24.3 million in Q1.
- For the past 12 months, share count rose just 1.4%, from 23.9 million.
- Importantly, the total portfolio’s occupancy rose to 90.3% as of June 30
These numbers were all in the right direction (with the exception of NOI), and basically stable, but not spectacular. A return to low-90s occupancy is an important boost to internal growth, at a time when external growth has slowed.
CHCT acquired a 38,000 square-foot rehab hospital in Cincinnati for a purchase price of $23.5 million in May, bringing its total acquisitions for the year to just $32.3 million, a sharp slowdown from previous years. The company appears to be having significant difficulty in finding and closing on acquisitions that fit their criteria.
Company investor presentation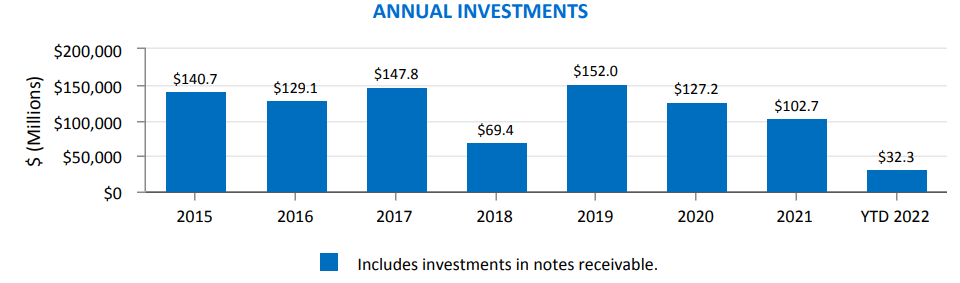
As for the pipeline going forward, CEO Tim Wallace had this to say on the Q2 earnings call:
The company signed a couple of additional purchase and sale agreements this quarter, and now has signed agreements for six properties to be acquired after completion in occupancy for an aggregate expected investment of $141 million. The expected return on these investments should range up to 10.25%. We expect to close on one of these properties in the second quarter of 2022, and the other five through 2022 and into 2023.
Lease expirations will be near 10% of revenue in 2023, 2025, and 2026, so the company’s ability to renew leases or find replacements for tenants will be put to the test. The weighted average remaining lease term is 7.9 years, according to Wallace.
Company Q2 Supplemental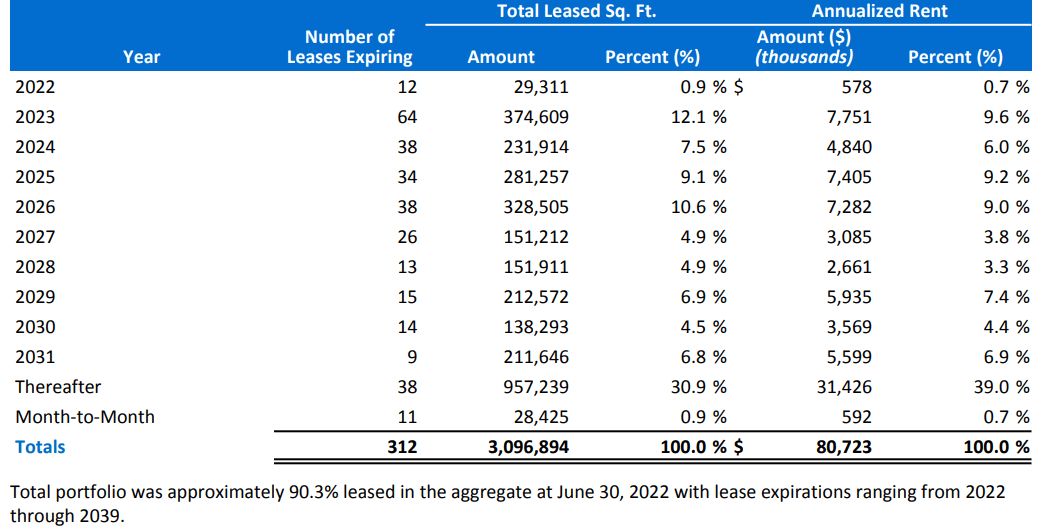
Growth metrics
Here are the 3-year growth figures for FFO (funds from operations), TCFO (total cash from operations), and market cap.
| Metric | 2019 | 2020 | 2021 | 2022* | 3-year CAGR |
| FFO (millions) | $32.1 | $45.0 | $52.9 | $54.4 | — |
| FFO Growth % | — | 40.2 | 17.6 | 2.8 | 19.37 |
| FFO per share | $1.67 | $2.04 | $2.35 | $2.29 | — |
| FFO per share growth % | — | 22.2 | 15.2 | (-2.6) | 11.18 |
| TCFO (millions) | $32.3 | $48.4 | $56.3 | $59.0 | — |
| TCFO Growth % | — | 49.8 | 16.3 | 4.8 | 22.41 |
*Projected, based on H1 2022 results
Source: TD Ameritrade, CompaniesMarketCap.com, and author calculations
CHCT’s double-digit growth rates look good, but on closer inspection, the rate of growth has fallen sharply over the past 3 years, and even gone negative this year in FFO per share. Given the company’s business model, the only thing that would restore growth to double digits going forward would be an accelerated pace of acquisitions.
The chart below shows the company’s FFO and AFFO inching forward from $0.54 and $0.57 per share respectively in Q1 2021 to $0.57 and $0.62 per share in Q2 2022.
Company Q2 Supplemental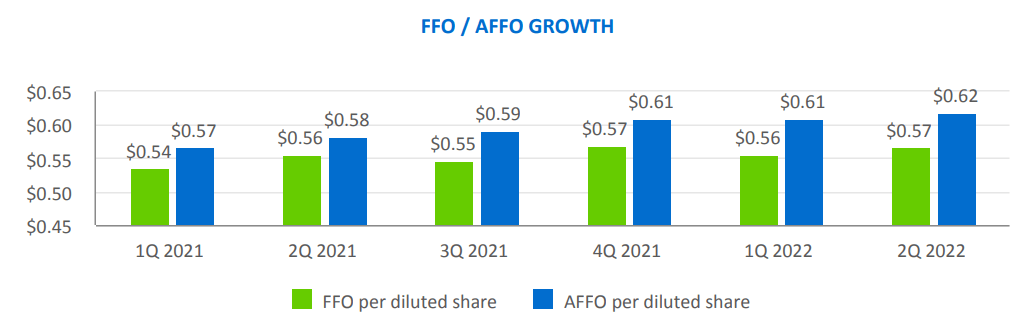
Meanwhile, here is how the stock price has done over the past 3 twelve-month periods, compared to the REIT average as represented by the Vanguard Real Estate ETF (VNQ).
| Metric | 2019 | 2020 | 2021 | 2022 | 3-yr CAGR |
| CHCT share price Oct. 14 | $45.16 | $48.65 | $48.13 | $31.60 | — |
| CHCT share price Gain % | — | 7.7 | (-1.1) | (-34.3) | (-11.29) |
| VNQ share price Oct. 14 | $93.07 | $80.98 | $106.46 | $76.14 | — |
| VNQ share price Gain % | — | (-13.0) | 31.5 | (-28.5) | (-6.52) |
Source: MarketWatch.com and author calculations
CHCT did not suffer a big sell-off during the COVID scare, and in fact gained in share price in 2020, but it also did not benefit from the banner year REITs enjoyed in 2021. Overall, investors who have held CHCT shares for the past three years have seen an average annual decline of (-11.29)% in their shares, compared to the more modest (-6.52)% loss experienced by VNQ investors.
Balance sheet metrics
Here are the key balance sheet metrics. This is where CHCT excels. Its liquidity ratio is steely at 2.51. Its debt ratio of 18% is the best in the Medical REIT sector, and among the best in REITdom, and its Debt/EBITDA of 4.0 suggests they will have an easy time covering their bills, even with the slowdown in earnings.
| Company | Liquidity Ratio | Debt Ratio | Debt/EBITDA | Bond Rating |
| CHCT | 2.51 | 18% | 4.0 | — |
Source: Hoya Capital Income Builder, TD Ameritrade, and author calculations
The company faces no debt maturities at all in 2023, 2025, or 2027, with $55 million due in 2024, $113 million in 2026, and $125 million in 2028.
Company Q2 supplemental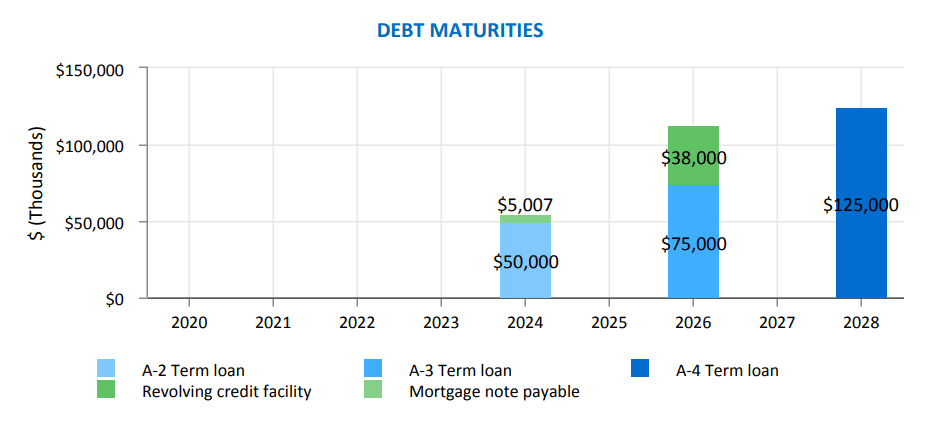
The company’s total indebtedness is only $292 million. They hold three term loans totaling $248.8 million, at a very favorable weighted average interest rate of 2.01%, and they owe about $38 million on their revolving credit facility at just 2.90%. The rest of the debt is a $5 million mortgage at 4.98%.
Dividend metrics
Community Healthcare Trust is well above average when it comes to dividends. The company has an unbroken streak of 28 consecutive quarters in which they have raised the dividend (usually by just a quarter of a penny). They did not cut the dividend, even during the COVID sell-off, when so many Medical REITs found that necessary.
Medical REITs by and large yield significantly more than the average REIT. Though CHCT’s dividend Yield is only slightly above the Medical REIT average at 5.60%, its superior dividend growth track record makes its Dividend Score of 5.86 stand out even further from the Medical REIT crowd.
| Company | Div. Yield | 3-yr Div. Growth | Div. Score | Payout | Div. Safety |
| CHCT | 5.60% | 2.3% | 5.86 | 80% | B- |
Source: Hoya Capital Income Builder, TD Ameritrade, Seeking Alpha Premium
Dividend Score projects the Yield three years from now, on shares bought today, assuming the Dividend Growth rate remains unchanged.
Despite its 80% payout ratio, this low-debt company earns a very strong Dividend Safety grade of B- from Seeking Alpha Premium.
Valuation metrics
From a value investor’s perspective, CHCT has become a bit of a bargain, with a strong Dividend Score of 5.86 and a Price/FFO of 13.4, which is slightly below the Medical REIT sector average, and significantly below the overall REIT average.
| Company | Div. Score | Price/FFO ’22 | Premium to NAV |
| CHCT | 5.86 | 13.4 | (-9.7)% |
Source: Hoya Capital Income Builder, TD Ameritrade, and author calculations
From a growth investor’s perspective, however, the low 13.4 P/FFO is a warning sign. The rapid growth this company achieved from 2018 to 2021 has come to a virtual standstill, so the price is arguably low for a reason. Hoya Capital has shown conclusively that cheap REITs tend to stay cheap.
What could go wrong?
If occupancy dips back under 90%, that could be a major challenge for CHCT going forward.
Management has no set target for annual volume of acquisitions. It’s just a matter of how many good deals they find. Thus, rising interest rates could squeeze cap rates on acquisitions to such an extent that CHCT could have difficulty finding properties that meet their criteria.
A flood of new private equity investors into the medical acquisitions space over the past 12 months – investors that are less knowledgeable and less diligent – may force CHCT to modify its business model, perhaps increasing the size of the deals, and cutting cap rates.
Investor’s bottom line
CHCT is not the exciting, high-growth small-cap REIT it used to be. Slowing acquisitions and gradually stabilizing occupancy have taken the bloom off that rose. In the meantime, it has become a decent value play, with higher than average Yield and lower than average Price/FFO. If you are holding shares, I see little reason to sell. I view this company as a Hold.
Seeking Alpha Premium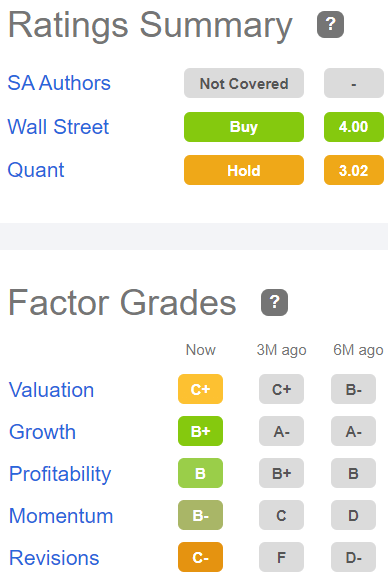
Of the seven Wall Street analysts that cover CHCT, 4 rate the company a Buy or Strong Buy, and 3 say Hold. The average price target is $40.86, implying 29% upside.
The Street, Ford Equity Research, and TipRanks all rate CHCT a Hold. Revisions-sensitive short-term trader service Zacks rates it a Sell. As always, it is your opinion that matters most.
Be the first to comment