

omersukrugoksu/iStock via Getty Images
Earnings of Community Bank System, Inc. (NYSE:CBU) will most probably dip this year on the back of higher provisioning for expected loan losses. On the other hand, moderate loan growth on the back of healthy pipelines and investments in human resources will likely support the bottom line. Overall, I’m expecting Community Bank System to report earnings of $3.35 per share for 2022, down 3.7% year-over-year. For 2023, I’m expecting the company to report earnings of around $3.69 per share. The current market price is much higher than the year-ahead target price. Therefore, I’m adopting a sell rating on Community Bank System.
Healthy Pipelines, Investments to Drive Moderate Loan Growth
Community Bank’s loan portfolio received a decent boost from the acquisition of Elmira Savings Bank during the second quarter of 2022. The loan book grew by 9.7% in the second quarter, as opposed to a more normal 0.7% in the first quarter of 2022. Loan growth for the third quarter will likely be somewhat better than the first quarter because the commercial loan pipeline is at an all-time high, as mentioned in the latest conference call. Moreover, the management is positive that loan growth will continue thanks to investments in the talent of the commercial and mortgage businesses.
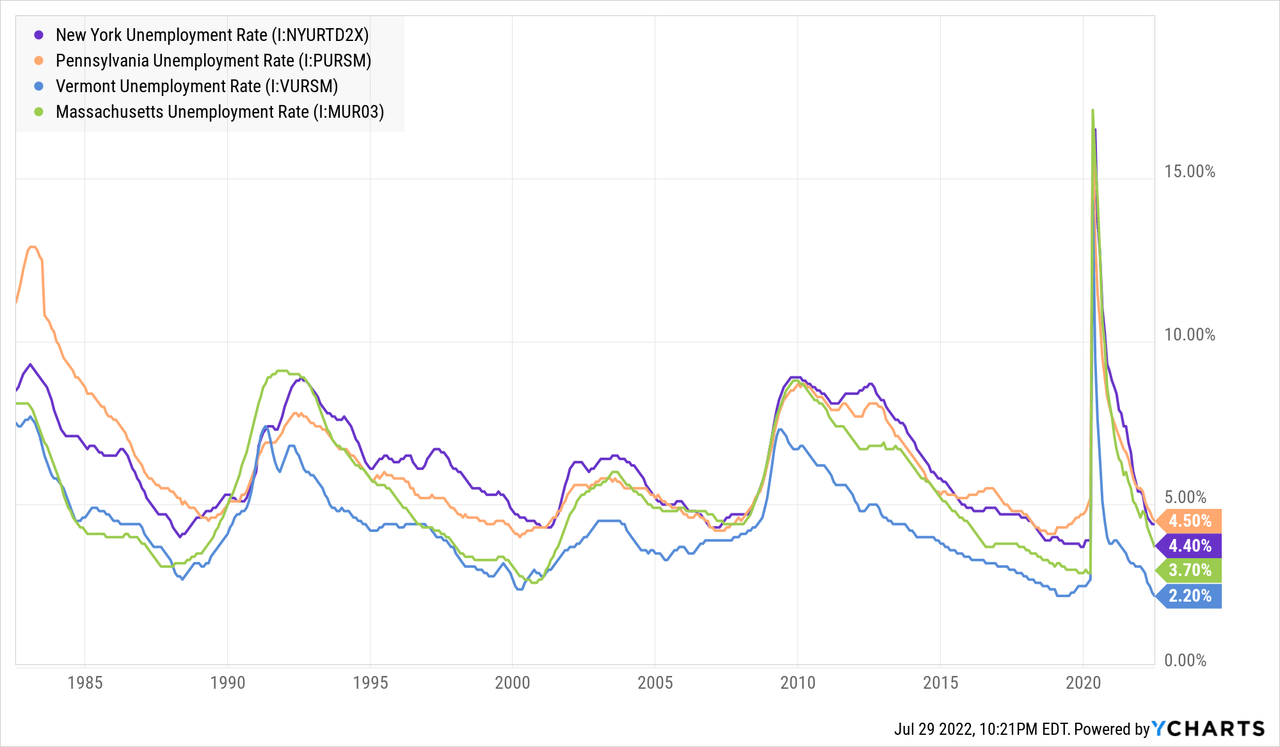
Strong job markets will likely also play a role in supporting loan growth. Community Bank System operates in several northeastern states, namely New York, Pennsylvania, Vermont, and Massachusetts. Three of these states (NY, PA, MA) have worse unemployment rates than the national average, but all four have phenomenal job markets when considered from a historical perspective.
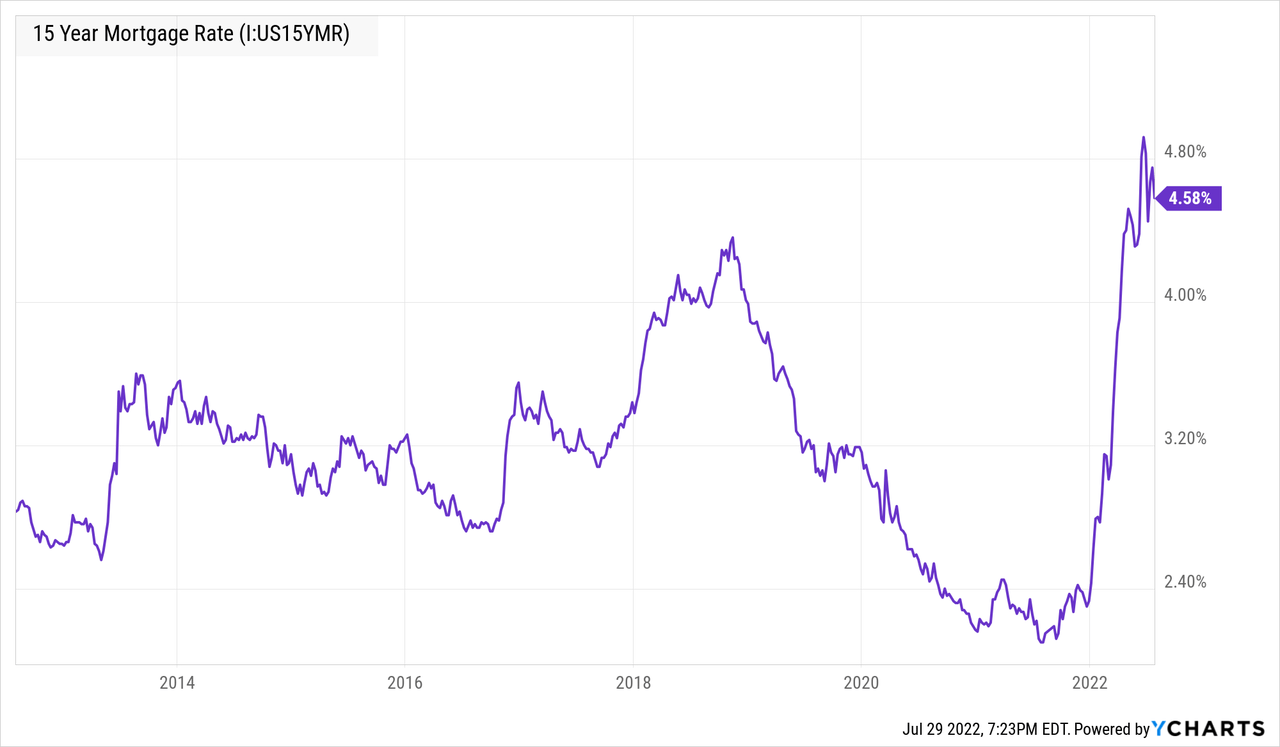
Although mortgage rates have dipped recently, they are still very high from a historical perspective. High interest rates are likely to hurt residential mortgage loan growth as people will try to put off their home purchases until better times. Consumer mortgages make up a hefty 36% of total loans. However, even in past bust markets, Community Bank System has managed to grow its mortgage business by 3% to 4%, as mentioned in the conference call. Therefore, high interest rates won’t eradicate loan growth, just slow it down.
Overall, I’m expecting the loan portfolio to grow by 1.5% in the second half of 2022, leading to full-year loan growth of 12.1%. I’m expecting the loan book to grow at a somewhat higher rate next year compared to the second half of this year, closer to the historical average.
Meanwhile, deposits will likely grow in line with loans through the end of 2023. On the other hand, the tangible book value per share will likely suffer in the third quarter because the hike in interest rates will lower the value of the investment securities held on the books. Community Bank System had a large securities portfolio at the end of June 2022, which made up 36% of total assets. The tangible book value per share has already plunged to $14.69 per share at the end of June 2022 from $23.77 per share at the end of March 2022, as mentioned in the earnings release. The following table shows my balance sheet estimates.
| FY18 | FY19 | FY20 | FY21 | FY22E | FY23E | |
| Financial Position | ||||||
| Net Loans | 6,232 | 6,841 | 7,355 | 7,324 | 8,211 | 8,544 |
| Growth of Net Loans | 0.4% | 9.8% | 7.5% | (0.4)% | 12.1% | 4.1% |
| Other Earning Assets | 2,982 | 3,088 | 3,597 | 4,979 | 5,756 | 5,990 |
| Deposits | 8,322 | 8,995 | 11,225 | 12,911 | 13,559 | 14,109 |
| Borrowings and Sub-Debt | 414 | 345 | 371 | 330 | 317 | 330 |
| Common equity | 1,714 | 1,855 | 2,104 | 2,101 | 1,689 | 1,793 |
| Book Value Per Share ($) | 33.1 | 35.5 | 39.4 | 38.6 | 31.1 | 33.0 |
| Tangible BVPS ($) | 18.9 | 20.7 | 23.6 | 22.7 | 14.2 | 16.1 |
|
Source: SEC Filings, Author’s Estimates (In USD million unless otherwise specified) |
Asset and Liability Mixes to Limit Margin Expansion
The following factors will limit the net interest income’s sensitivity to rate hikes.
- Large balance of consumer mortgage loans. By nature, most residential mortgage loans carry fixed rates. Therefore, most of them will not re-price this year. Consumer mortgage loans made up around 35.7% of total loans at the end of June 2022.
- Large balance of non-maturity interest-bearing deposits. These deposits will re-price soon after every rate hike. Around 62% of the deposit book was made up of non-maturing interest-bearing deposits at the end of June 2022.
On the other hand, the anticipated loan additions in the year ahead will lift the average portfolio yield, and consequently the margin. This is because the management mentioned in the conference call that it was already originating loans in the second quarter at a rate that was higher than the portfolio’s average rate.
The results of the management’s interest rate sensitivity analysis given in the first quarter’s 10-Q filing showed that a 200-basis points hike in interest rates could increase the net interest income by $5.35 million over 12 months. To put this number in perspective, $5.35 million is only 1.4% of net interest income for 2021.
Considering these factors, I’m expecting the margin to grow by eight basis points in the second half of 2022 and then remain stable in 2023.
Above-Average Provisioning Likely for the Second Half of the Year
The allowances for expected loan losses made up 150% of nonperforming loans at the end of June 2022, as mentioned in the earnings release. This allowance-to-nonperforming loan ratio is too low for comfort given the recessionary outlook and heightened interest rates. As a result, I’m expecting the provisioning to be slightly above normal in the second half of 2022 before returning to a normal level in 2023. I’m expecting the net provision expense to make up 0.21% of total loans in 2022, and 0.14% of total loans in 2023. In comparison, the net provision expense averaged 0.16% of total loans from 2017 to 2019.
Expecting Earnings to Dip by 4% this Year
Earnings will likely drop this year as higher provisioning will undermine topline growth. However, the earnings will most probably surge next year thanks to moderate loan growth. Overall, I’m expecting the company to report earnings of $3.35 per share for 2022, and $3.69 per share for 2023. The following table shows my income statement estimates.
| FY18 | FY19 | FY20 | FY21 | FY22E | FY23E | |
| Income Statement | ||||||
| Net interest income | 345 | 359 | 368 | 374 | 415 | 450 |
| Provision for loan losses | 11 | 8 | 14 | (9) | 17 | 12 |
| Non-interest income | 224 | 231 | 228 | 246 | 259 | 253 |
| Non-interest expense | 345 | 372 | 377 | 388 | 427 | 440 |
| Net income – Common Sh. | 168 | 169 | 164 | 189 | 182 | 200 |
| EPS – Diluted ($) | 3.24 | 3.23 | 3.08 | 3.48 | 3.35 | 3.69 |
|
Source: SEC Filings, Author’s Estimates (In USD million unless otherwise specified) |
Actual earnings may differ materially from estimates because of the risks and uncertainties related to inflation, and consequently the timing and magnitude of interest rate hikes. Further, a stronger or longer-than-anticipated recession can increase the provisioning for expected loan losses beyond my projection. The new Omicron subvariant also bears monitoring.
CBU Appears Overvalued
Community Bank has increased its dividend in the third quarter of every year since 2011 (the annual increase trend goes back 30 years, but the hike was not scheduled for the third quarter before 2011). If the company increases its dividend by $0.01 per share to $0.45 per share in the third quarter of 2023, then the implied payout ratio next year will be 48%, which is in line with the five-year average. Therefore, the company can easily continue its dividend tradition next year. Based on the current market price and the implied dividend, Community Bank is offering a forward dividend yield of 2.6%.
I’m using the historical price-to-tangible book (“P/TB”) and price-to-earnings (“P/E”) multiples to value Community Bank System. The stock has traded at an average P/TB ratio of 3.01x in the past, as shown below.
| FY18 | FY19 | FY20 | FY21 | Average | ||
| T. Book Value per Share ($) | 18.9 | 20.7 | 23.6 | 22.7 | ||
| Average Market Price ($) | 59.3 | 64.0 | 60.6 | 73.8 | ||
| Historical P/TB | 3.13x | 3.09x | 2.57x | 3.25x | 3.01x | |
| Source: Company Financials, Yahoo Finance, Author’s Estimates | ||||||
Multiplying the average P/TB multiple with the forecast tangible book value per share of $14.2 gives a target price of $42.7 for the end of 2022. This price target implies a 36.6% downside from the July 29 closing price. The following table shows the sensitivity of the target price to the P/TB ratio.
| P/TB Multiple | 2.81x | 2.91x | 3.01x | 3.11x | 3.21x |
| TBVPS – Dec 2022 ($) | 14.2 | 14.2 | 14.2 | 14.2 | 14.2 |
| Target Price ($) | 39.9 | 41.3 | 42.7 | 44.1 | 45.5 |
| Market Price ($) | 67.3 | 67.3 | 67.3 | 67.3 | 67.3 |
| Upside/(Downside) | (40.8)% | (38.7)% | (36.6)% | (34.5)% | (32.4)% |
| Source: Author’s Estimates |
The stock has traded at an average P/E ratio of around 19.7x in the past, as shown below.
| FY18 | FY19 | FY20 | FY21 | Average | ||
| Earnings per Share ($) | 3.2 | 3.2 | 3.1 | 3.5 | ||
| Average Market Price ($) | 59.3 | 64.0 | 60.6 | 73.8 | ||
| Historical P/E | 18.3x | 19.8x | 19.7x | 21.2x | 19.7x | |
| Source: Company Financials, Yahoo Finance, Author’s Estimates | ||||||
Multiplying the average P/E multiple with the forecast earnings per share of $3.35 gives a target price of $66.1 for the end of 2022. This price target implies a 1.8% downside from the July 29 closing price. The following table shows the sensitivity of the target price to the P/E ratio.
| P/E Multiple | 17.7x | 18.7x | 19.7x | 20.7x | 21.7x |
| EPS – 2022 ($) | 3.35 | 3.35 | 3.35 | 3.35 | 3.35 |
| Target Price ($) | 59.4 | 62.8 | 66.1 | 69.5 | 72.8 |
| Market Price ($) | 67.3 | 67.3 | 67.3 | 67.3 | 67.3 |
| Upside/(Downside) | (11.7)% | (6.8)% | (1.8)% | 3.2% | 8.2% |
| Source: Author’s Estimates |
Equally weighting the target prices from the two valuation methods gives a combined target price of $54.4, which implies a 19.2% downside from the current market price. Adding the forward dividend yield gives a total expected return of negative 16.6%. Hence, I’m adopting a sell rating on Community Bank System.
Be the first to comment