

RudyBalasko
I am assigning CNX Resources Corporation (NYSE:CNX) a positive risk/reward rating based on its core acreage position in the heart of the Marcellus and Utica shale plays, its discounted valuation, substantial free cash flow generation, its shareholder-friendly capital allocation, and its proximity to long-term technical support.
Risk/Reward Rating: Positive
The Appalachian basin houses two of the largest gas resources in the world, the Marcellus and Utica shale plays. They are geographically similar in terms of surface footprint, with the Utica being deeper than the Marcellus. While there remains great uncertainty about the ultimate recoverable gas resource, official estimates have been proven conservative throughout the history of the play. The trend of consistent and material upside surprises in gas production, and thus the ultimate resource potential, should continue.
As we will see, official estimates remain conservative today. A recent report authored by Ray Boswell, “Evaluation of Technically-Recoverable Resources in the Marcellus and Utica Shale Gas Plays of the Appalachian Basin,” was published by the National Energy Technology Laboratory on June 23, 2021. The report captures the current state of estimates for what some have called “the Saudi Arabia of natural gas.”
The Saudi Arabia Of Natural Gas
The cornerstone of the CNX Resources investment case is the size and quality of its resource base, which is composed entirely of its Marcellus and Utica acreage in Pennsylvania, West Virginia, and Ohio. As a result, reviewing the resource base is a top priority.
The following two slides from the Boswell report set the stage by displaying recent Energy Information Administration estimates for both the Marcellus and Utica shale resources. Please note that the total EIA resource estimate is arrived at by adding the absolute value of the final orange bar and green bar on the right-hand side of the two images below.
Source: “Evaluation of Technically-Recoverable Resources in the Marcellus and Utica Shale Gas Plays of the Appalachian Basin,” by Ray Boswell, National Energy Technology Laboratory, June 23, 2021 Source: “Evaluation of Technically-Recoverable Resources in the Marcellus and Utica Shale Gas Plays of the Appalachian Basin,” by Ray Boswell, National Energy Technology Laboratory, June 23, 2021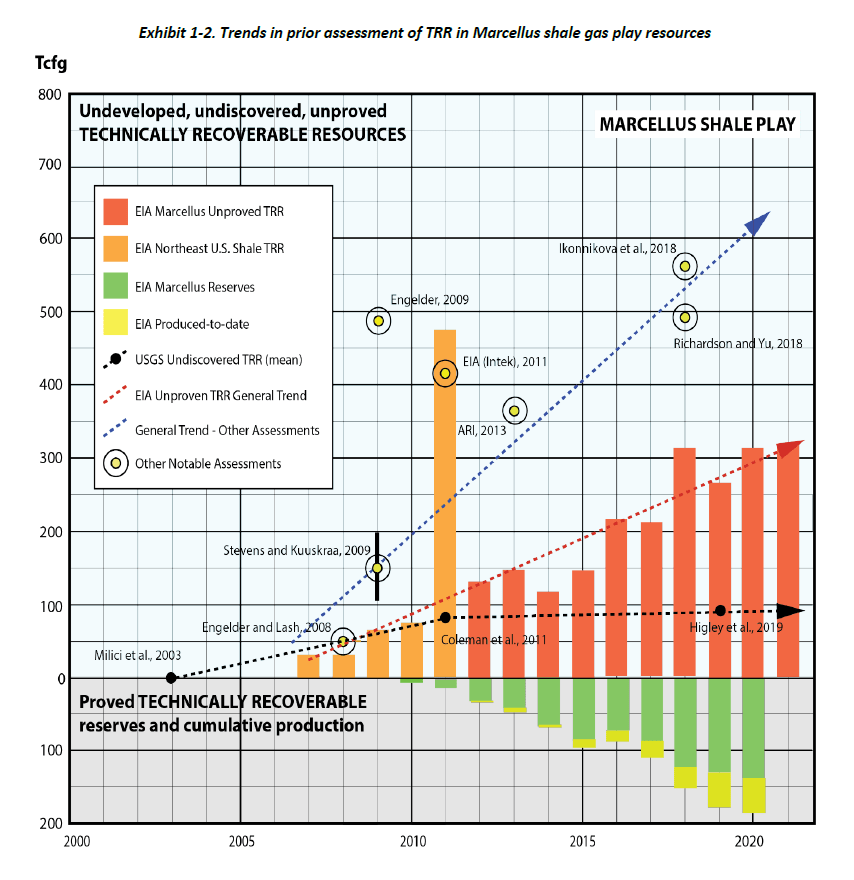
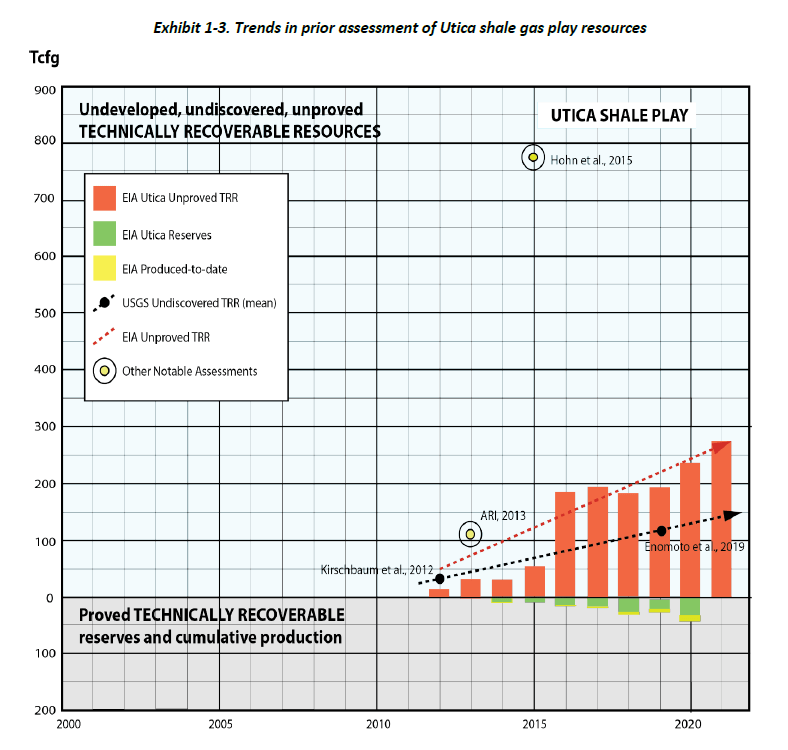
The most recent EIA estimate for the Marcellus shale resource is in the area of 450 tcfg (trillion cubic feet of gas). The Utica estimate is near 300 tcfg, which brings the total to 750 tcfg. As a reminder, these figures were estimated by adding the orange and green bars furthest to the right on the images above. For reference, the largest gas field in the world is estimated to contain 1,236 tcfg, which is the South Pars field under Iran and to a lesser extent Qatar.
The second largest field is the Urengoy field in Russia, which is estimated to contain 222 tcfg. If the Marcellus and Utica are treated as one field, they would rank number two in the world using official EIA estimates. Importantly, the EIA estimates are conservative by nature and are likely to materially underestimate the recoverable resource. The following image from the report summarizes Boswell’s findings and his estimates of the ultimate recoverable resource.
Source: “Evaluation of Technically-Recoverable Resources in the Marcellus and Utica Shale Gas Plays of the Appalachian Basin,” by Ray Boswell, National Energy Technology Laboratory, June 23, 2021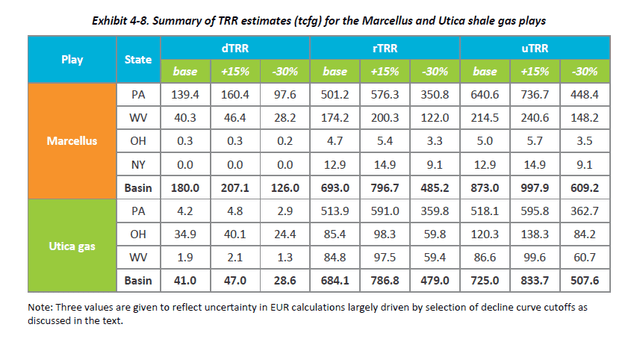
The two summary rows are bolded with the key data being found in the final three columns on the right-hand side under uTRR. The base case estimate is for a total recoverable resource of 1,598 tcfg with a margin of error between 1,117 tcfg (-30% to the base estimate) and 1,832 tcfg (+15% to the base estimate).
The Marcellus and Utica are clearly in the upper echelon of global resource potential. When compared to resource estimates for the largest gas field, near 1,236 tcfg, the Marcellus and Utica shale plays may indeed represent the Saudi Arabia of natural gas.
Shale Sweet Spots
The dominant feature of shale resource plays is that they have sweet spots which are much more productive than the majority of locations along the resource deposit. This becomes evident in the following images from the Boswell report. The first image is a map of the Marcellus shale surface footprint, and the recoverable resource estimates throughout the play. The second image displays the same information for the Utica shale.
Source: “Evaluation of Technically-Recoverable Resources in the Marcellus and Utica Shale Gas Plays of the Appalachian Basin,” by Ray Boswell, National Energy Technology Laboratory, June 23, 2021 Source: “Evaluation of Technically-Recoverable Resources in the Marcellus and Utica Shale Gas Plays of the Appalachian Basin,” by Ray Boswell, National Energy Technology Laboratory, June 23, 2021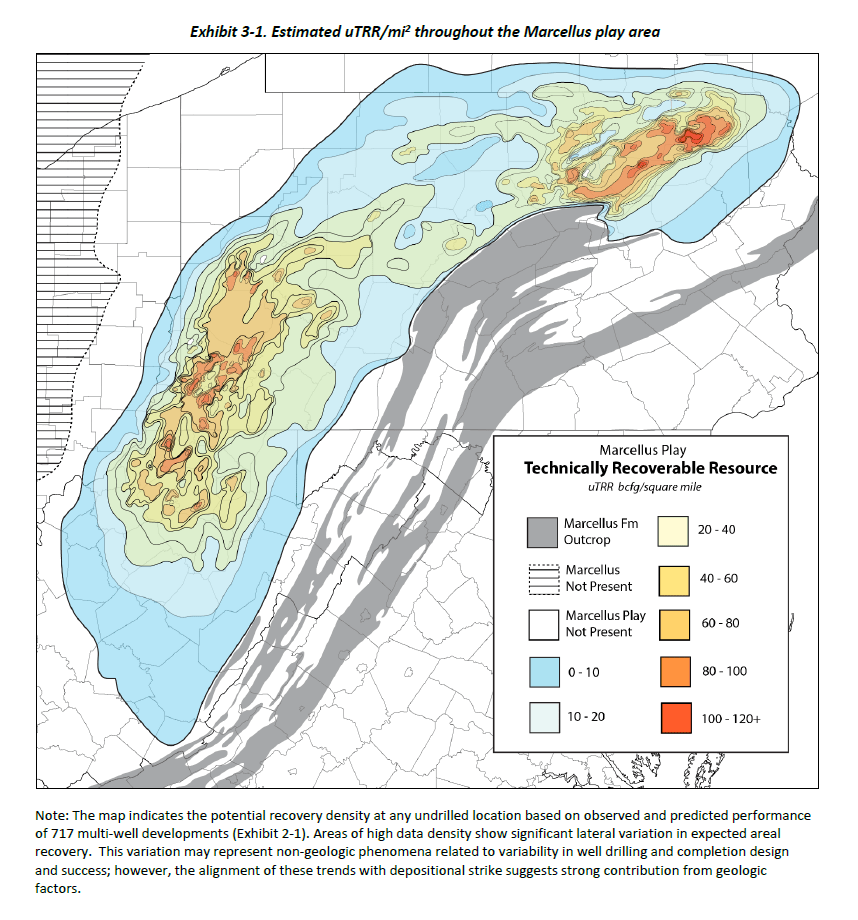
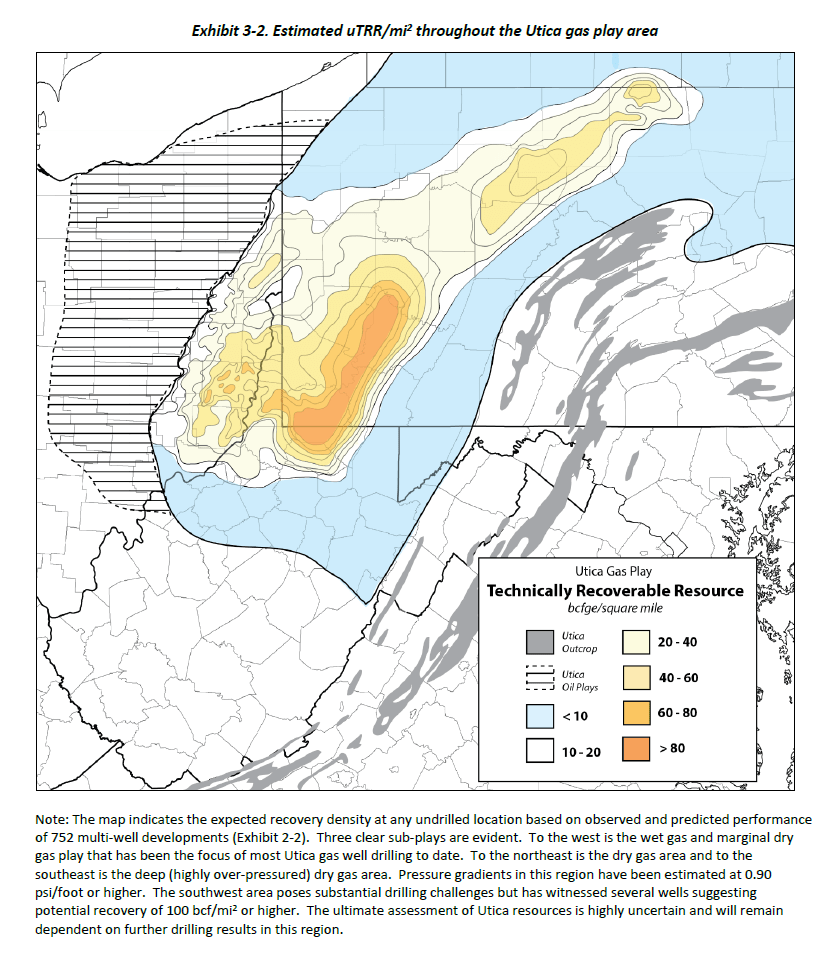
In the above images, notice that the more productive regions, or sweet spots, are shaded in the yellow to red end of the spectrum, with red representing the most prolific regions. Please take a mental snapshot of the yellow to red shaded areas.
These locations represent the highest value resource base within arguably the highest quality and largest recoverable gas resource in the world. The following image from CNX Resources’ Q1 2020 Earnings Results Presentation displays the surface footprint of the company’s acreage position, which is highlighted in yellow.
Source: CNX Resources Q1 2020 Earnings Results Presentation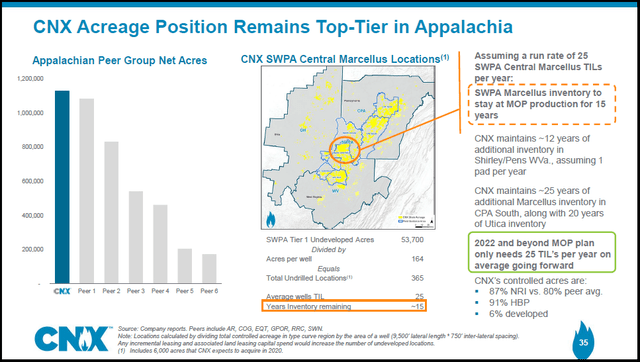
A casual glance confirms that CNX’s resource base is within the sweet spots of the Marcellus and Utica shale plays. As a result, CNX’s asset base is truly world class. In addition to the world-class asset base, CNX has production visibility as far as the eye can see as shown on the right-hand side of the image above.
The orange highlighted information summarizes CNX’s core sweet spot in Southwestern PA. This premium acreage alone offers the company 15 years of production inventory at the current run rate of 25 new wells per year, or TILs in the above image. This level of activity is projected to maintain the company’s current level of gas production. When the remainder of the acreage is added, CNX has production visibility from top-tier assets beyond the life expectancy of most people on earth.
With natural gas production visibility well into the future and with top-tier assets, the investment case for CNX Resources will be decided by company and industry fundamentals.
Fundamentals
I have professionally followed the shale revolution in its entirety, beginning in 2002. The past 20 years have been dominated by overinvestment, debt accumulation, capital misallocation, and losses for energy sector investors. While the industry had been slowly transitioning to a more sustainable development trajectory, it was COVID that punctuated the transition and forced the industry’s hand.
In fact, COVID may be viewed as the best thing that could have happened to the US natural gas industry, economically speaking. The collapse of global oil demand forced US producers in oil-rich shale regions, such as the Permian Basin, to shut down production and stop drilling. Critically, most of these shale-oil wells produce a tremendous amount of natural gas.
Most prolific shale-oil regions produce 50% oil and 50% natural gas from the wells, roughly speaking. The rapid growth of natural gas production from these oil-focused wells over the past decade had a crushing effect on natural gas prices. When negative oil prices struck during COVID, it is fair to say that the oil industry was on the brink. With poor performance for so long leading into COVID, investors demanded compensation for the risks being taken by the energy producers.
Today, nearly all public oil and gas companies are focused squarely on investor returns rather than production growth. As a result, limited production growth for the foreseeable future remains the base-case scenario. Industry discipline is likely to be a secular trend given the poor track record of the sector and the unfolding energy transition. Due to this, industry conditions are likely to be more supportive of pricing going forward, which will enable companies to maximize shareholder returns over the longer term.
CNX Fundamentals
This industry trend toward discipline is on full display when reviewing the CNX investment case. Maximizing shareholder returns is in fact the company’s sole focus. CNX is adhering to the new industry realities while taking the long view. Taking the long view in stewarding such a world-class resource base opens the door to extraordinary long-term value creation for CNX shareholders.
For shareholders, no matter the enterprise, free cash flow is the goal. CNX’s free cash flow growth resulting from the positive industry developments and discipline discussed above has been incredible. The company’s forecast is for 31% free cash flow growth per year through 2026, which can be seen on the following slide from the Q2 2022 Update Presentation.
Source: CNX Resources Q2 2022 Update Presentation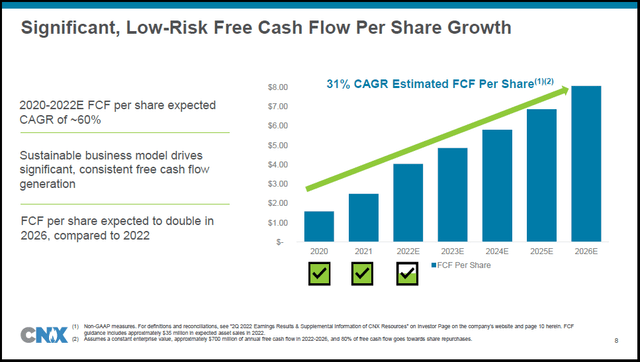
This type of annual free cash flow growth, 31%, is normally associated with a secular growth stock in its early stages. With CNX shares trading near $17, the above free cash flow levels offer what appears to be an incredible value proposition. For color surrounding the underlying fundamental trend, the following image from the October 2020 Investor Day Presentation provides an excellent reference point when viewing the above slide.
Source: CNX Resources October 2020 Investor Day Presentation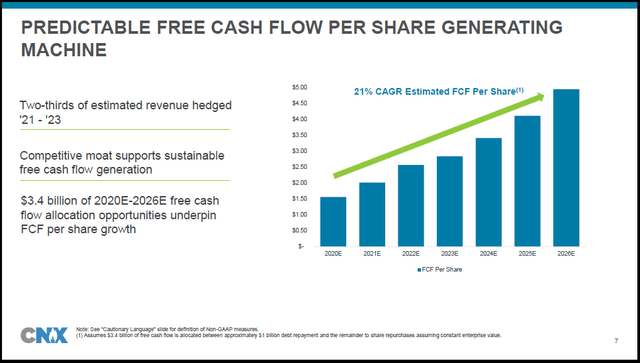
Fundamentals have experienced a step change higher between October 2020 and today. For example, in October 2020, CNX was forecasting free cash flow per share of $2.50 for 2022 and $5 per share for 2026. The same forecasts today are for $4 and $8, respectively. In terms of the forecasted growth rate of free cash flow per share, it has transitioned from 21% to 31% annually since October 2020. While the growth is not the result of volume expansion, and includes an aggressive long-term share repurchase program, it is growth all the same.
Balance Sheet And Capital Strategy
The aggressive share repurchase program is on display in the next images from the Q2 2022 Update Presentation. CNX has reduced its share count by 16% since October 2020, while reducing its net debt by over $300 million.
Source: CNX Resources Q2 2022 Update Presentation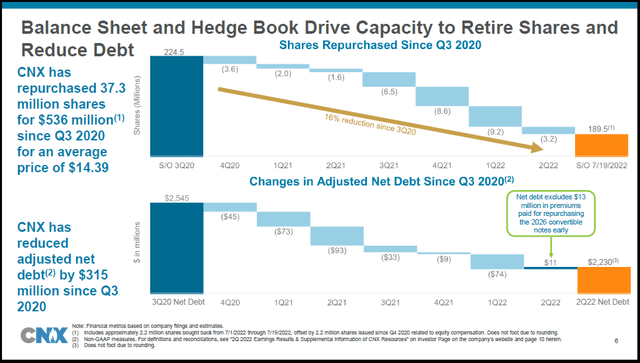
The company is on track to generate $1.6 billion of free cash flow for the three years through 2022. With free cash flow projected to reach $700 million in 2022, and a market capitalization of just over $3 billion, CNX could easily repurchase 22% of its outstanding shares using funds generated in 2022 alone.
Additionally, the company’s balance sheet looks to be rather strong, which should continue to support its opportunistic capital returns. As can be seen in the next image, CNX has balance sheet liquidity of $1.9 billion and no debt maturities until 2026.
Source: CNX Resources Q2 2022 Update Presentation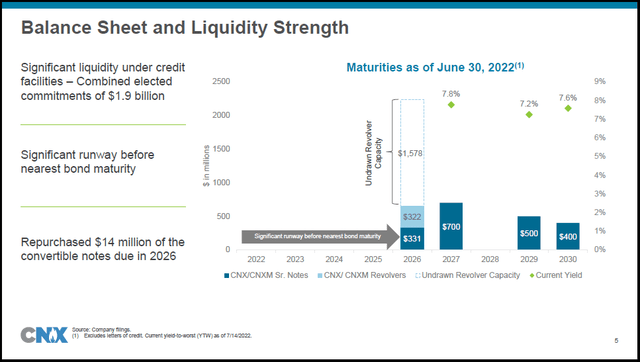
Valuation
With the above images in mind, CNX is likely to remain an aggressive purchaser of its own shares for the foreseeable future. In terms of the company’s focus on maximizing shareholder value, the aggressive share repurchase strategy looks like a top choice when considering the current valuation. The following table was compiled from Seeking Alpha and displays consensus earnings estimates for CNX through 2024.
Source: Seeking Alpha. Created by Brian Kapp, stoxdox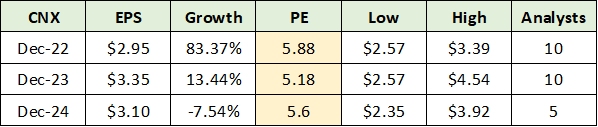
At 5x earnings (highlighted in yellow), CNX’s own shares offer a 20% earnings yield. When combined with the company’s forecasted 2026 free cash flow per share of $8, CNX would be hard-pressed to find a more shareholder accretive use of its capital than share repurchases.
Looking to 2026, one can easily envision a 10x multiple on free cash flow. While $8 per share may be attainable, half that amount would be sufficient for material share price appreciation from a $17 base. Of note, CNX is projecting roughly $4 per share of free cash flow in 2022.
Further valuation support is found in CNX’s PV10 value filed with the SEC. The calculation is an industry standard which is designed to estimate the present value of each company’s expected cash flows, discounted at a 10% rate. The following table from CNX’s 2021 10-K filed with the SEC displays the company’s PV10 values for the past 3 years.
Created by Brian Kapp, stoxdox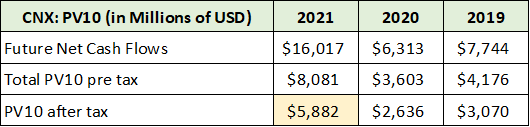
Interpretation of the PV10 calculation should be tempered; however, it is a very rough and conservative approximation of value. At $6 billion after tax (highlighted in yellow) and a market capitalization near $3 billion, CNX is trading at a material discount to this present value calculation. As the company could retire its debt rather than repurchase shares, comparing the PV10 to market capitalization rather than enterprise value is more informative from a pure equity perspective. CNX Resources should have incredible valuation support near current levels, fundamentally speaking.
Technicals
The rock-solid valuation support near current levels is reinforced by a strong long-term technical foundation. Beginning with the 20-year monthly chart below, CNX is a textbook case of energy investor losses during the shale revolution. Please note that CNX has been in a constant state of flux during this period as it was a coal company at the time of its IPO in 1999.
CNX Resources 20-year monthly chart (Created by Brian Kapp using a chart from Barchart.com)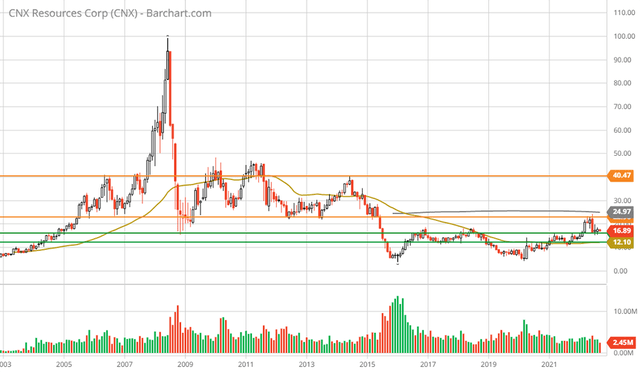
In all of the charts here, the orange lines represent resistance levels, and the green and blue lines depict key support zones. CNX is trading at levels first reached in 2001. Interestingly, the spike to $100 in 2008 is just above the $80 target if CNX were to achieve its $8 per share free cash flow goal and trade at a 10x multiple. The following 10-year monthly chart captures CNX’s price action as a natural gas-focused company.
CNX Resources 10-year monthly chart (Created by Brian Kapp using a chart from Barchart.com)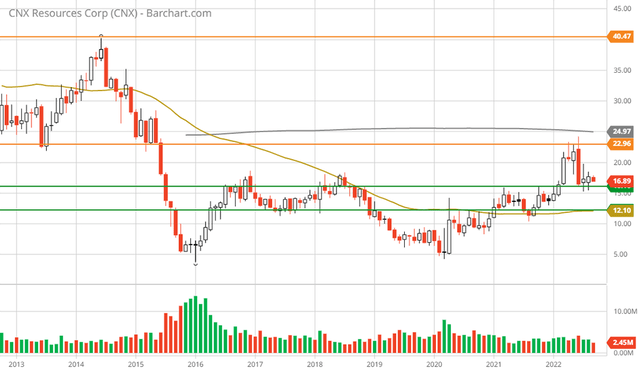
The shares are currently testing the upper support zone near $16 (the first green line), which served as major resistance during 2016, 2018, 2020, and 2021. The breakout above this key resistance zone did not occur until March 2022, following the onset of the Russian war. Given the intensity and duration of the resistance near $16 prior to the recent breakout, this area should represent an extraordinarily strong support zone.
Technically speaking, CNX is six months into a bullish breakout, after a brutal seven-year bottoming process. The following 3-year weekly chart provides a closer look at the budding bull market trend. Please note that the gold trendline on the following chart is the 50-week moving average, while the grey trendline is the 200-week moving average. Interestingly, both moving averages are currently in the vicinity of the two primary support levels (the green lines).
CNX Resources 3-year weekly chart (Created by Brian Kapp using a chart from Barchart.com)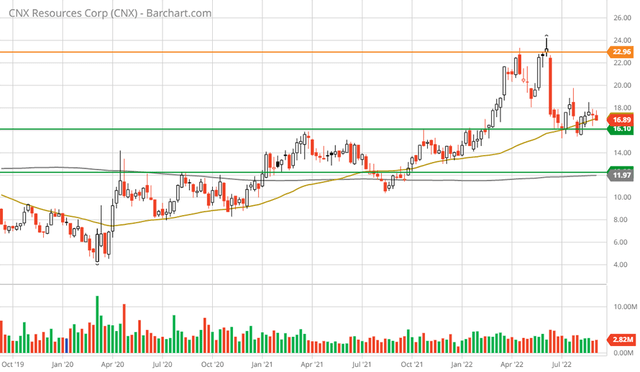
Notice that CNX is in a well-defined, if subdued, uptrend since the COVID bottom and is resting on top of a major support zone between $12 and $16 (the green lines). This area should offer rock-solid support barring a collapse of natural gas prices. While natural gas prices are likely to correct, industry conditions are supportive of generally higher prices than was the case during the long downcycle, which bottomed coincident with the COVID pandemic.
I have added an additional support level near $14.50 (the blue line) to the following 1-year daily chart. This level is roughly the midpoint of the major support zone and served as daily resistance throughout Q4 2021. As a result, it is now support. The midpoint looks to be the most likely downside potential as things stand.
CNX Resources 1-year daily chart (Created by Brian Kapp using a chart from Barchart.com)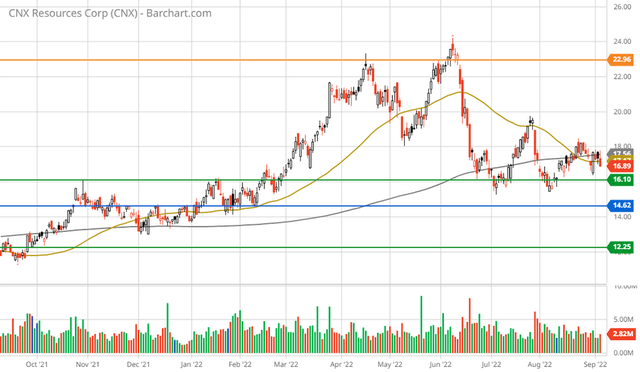
A test of the blue line represents -15% downside potential. If the lower green line were to be retested, the downside potential is 28%. Given the early stage of the new bull market for CNX shares, and the greatly improved industry backdrop, I view a nearer-term test of this lower level near $12 to be a low probability.
The first two upside targets are well defined by the orange resistance lines near $23 and $40, respectively. With free cash flow projected to be in the $4 per share range in 2022 and up to $8 by 2026, the $40 price target looks to be quite reasonable. This represents 135% upside potential. If the company achieves its $8 per share free cash flow target, at a 10x multiple, the $80 price level will come into play. The upside to this higher level is extraordinary at 370%.
Summary
With likely downside potential near -15%, and the upside potential looking to be between 135% and 370%, CNX Resources offers an exceptionally positive risk/reward asymmetry.
The company operates a large asset base within the core of what many observers have called the Saudi Arabia of natural gas. All evidence points toward the Marcellus and Utica shale as being a bedrock of value under CNX shares for a foreseeable lifetime.
With CNX’s world-class assets as the backdrop, the aggressive share repurchase program should create incredible growth in net asset value per share. Furthermore, the recently improved industry conditions are likely to be a longer-term trend. As a result, the door is now open to an extraordinary free cash flow story in addition to an exceptional net asset value growth opportunity. The risk/reward asymmetry is decidedly positive for CNX Resources.
Be the first to comment