

Trifonov_Evgeniy/iStock via Getty Images
Investment Thesis
Cloudflare, Inc. (NYSE:NET) was obviously in a growth-at-all-cost stage, given its continuous cash burn thus far. With high operating expenses and stock-based compensations (SBC), it is evident that NET has yet to achieve net income and FCF profitability, potentially leading to further reliance on Convertible Note Offerings moving forward, as it has historically done.
NET’s Impressive Growth Metrics
Seeking Alpha
Nonetheless, it is also evident that NET has had many successes in its expansion, given the accelerating YoY growth of 54% in its revenues and 29.2% in customers in Q1 2022. With an expanding global presence and multiple areas for growth, such as cloud computing, IoT, and 5G Networks, we expect the company to perform very well indeed – barring the impact of the potential recession.
NET Has Had Accelerating Growth Metrics – Impressive Thus Far
S&P Capital IQ
NET has been growing its revenues at an excellent CAGR of 50.58% in the past five years. In fact, the YoY revenue growth rate has been accelerating with a 53.7% increase in Q1 2022, compared to 51.3% in Q1 2021 and 47.8% in FQ1’20. By the LTM, NET reported revenues of $730.5M and gross margins of 77.8% representing an increase of 69.4% and in line with FY2020 levels, respectively. Nonetheless, it is evident that the company has yet to achieve profitability, with net incomes of -$261.7M and net income margins of -35.8% in the LTM, mainly attributed to its relatively elevated operating expenses.
S&P Capital IQ
From the chart above, we can see that NET has been expanding at the growth-at-all-costs rate. By the LTM, the company reported operating expenses of $722.6M, representing a massive increase of 61.9% from FY2020 levels. Nonetheless, we are not overly concerned, since the ratio to its growing revenues has moderated over time, to 98.9% by the LTM. Given the potential deceleration in revenue growth ahead, we expect to see NET slowing its expansion rate as well, given the management’s guidance for break-even profitability in 2022.
S&P Capital IQ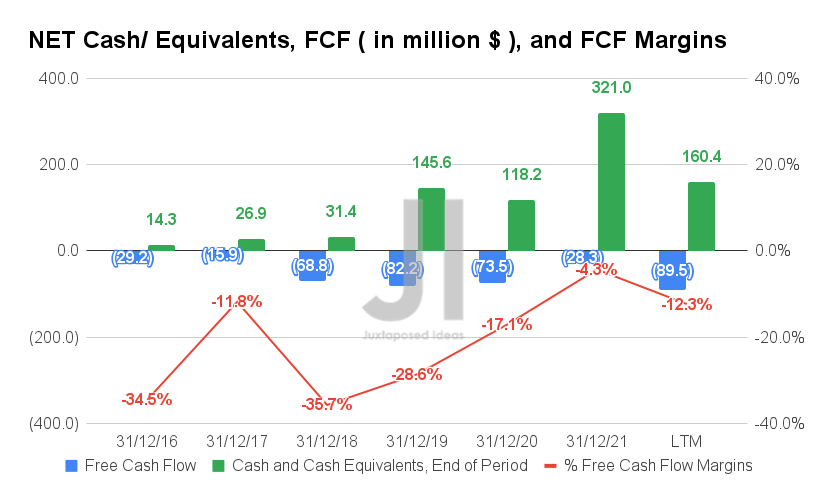
Therefore, given its deepening net losses, it is apparent that NET has yet to report Free Cash Flow (FCF) profitability, with an FCF of -$89.5M and an FCF margin of -12.3% in the LTM. It represents a decline of 21.7% though an improvement of 4.8 percentage points from FY2020 levels, respectively. However, given its slowly depleting cash and equivalents of $160.4M at the LTM, NET would probably need to raise capital again very soon, given its elevated operating expenses and capital expenditures thus far.
S&P Capital IQ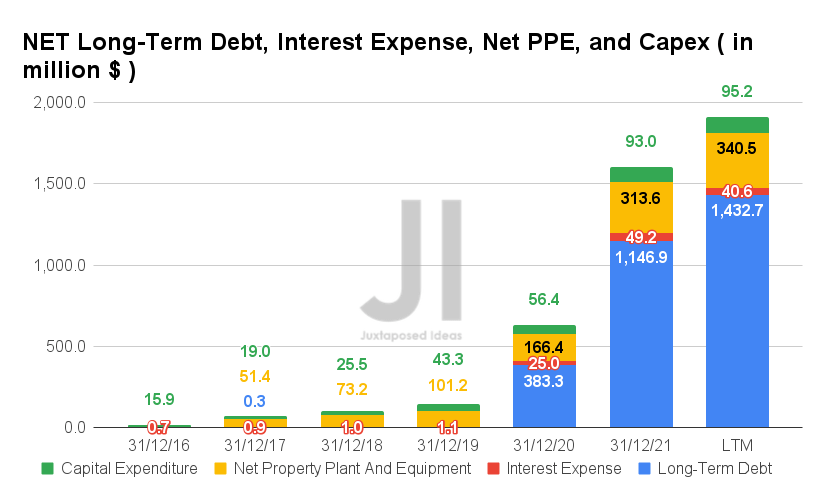
NET’s 2025 and 2026 Notes
S&P Capital IQ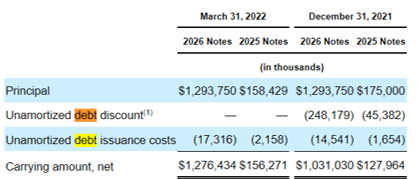
NET also took on some financial obligations in the past two years, with two notable Convertible Note Offering for 2026 and 2025 maturity. These total at a sum of $1.43B of long-term debts, with minimal interest expenses of $40.6M by the LTM. Nonetheless, investors must also consider the potential share dilution from these obligations, given the original conversion price of $37.43 for 2025 Notes and $191.34 for 2026 Notes. These would amount to a sum of share dilution of up to 4.17M and 6.67M, respectively, based on original agreements. Or, speculatively up to a total sum of 27M, based on current stock prices, depending on the future provisions. Thereby, potentially triggering a 3.3% or 8.3% share dilution then, based on the current share count – which remains relatively modest for now.
In addition, NET continues to expand its net PPE assets to $340.5M and capital expenditure to $95.2M by the LTM, representing an increase of 204.6% and 68.7% from FY2020 levels, respectively. Thereby, highlighting the management’s priority in growing its consumer base aggressively.
S&P Capital IQ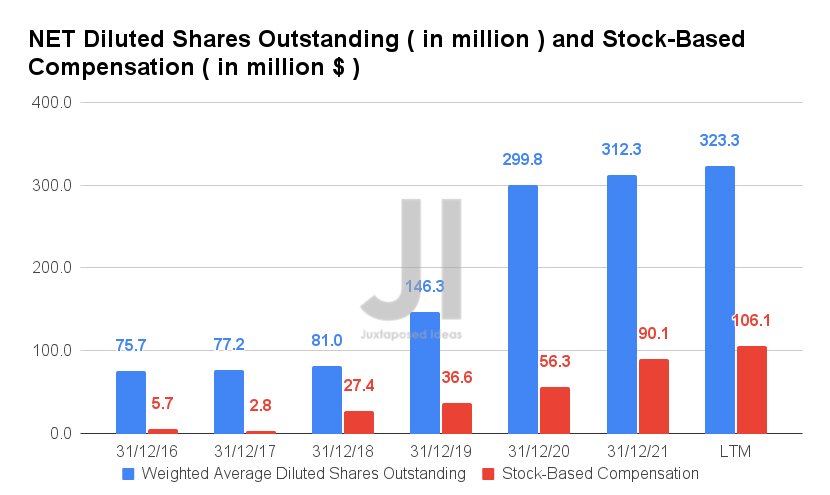
Nonetheless, given the lack of profitability thus far and minimal profitability moving forward, we expect NET to continue relying on debts and SBC in the meantime. By the LTM, the company reported diluted shares outstanding of 323.3M and SCB expenses of $106.1M, representing an increase of 7.8% and 88.4% from FY2020 levels, respectively. Assuming a similar rate, we expect to see an increased share count of 352.3M and SBC expenses of $369.1M by FY2024. We shall see, though these aggressive projections still look relatively controlled for a high-growth company such as NET.
S&P Capital IQ
For the next three years, NET is expected to report revenue growth at a CAGR of 39.79%, while also finally reporting a net income break even in FY2022. By FY2024, the company is expected to improve its net income margins to 3.96% as well. For FY2022, consensus estimates that NET will report excellent revenues of $959M and net incomes of $9M, representing YoY growth of 46.1% and 96.6%, respectively.
In the meantime, analysts will be closely watching NET’s performance, with consensus revenue estimates of $227.34M and EPS of -$0.01, representing YoY improvement of 49.14% and 66.75%, respectively. For now, based on its historical performance and market-wide observation, we expect the company to perform well in Q2 2022, though the key to its stock recovery will be its upcoming guidance for Q3 2022 and FY2022. That would be critical to NET’s stock performance then, though we are not holding much hope for now.
So, Is NET Stock A Buy, Sell, or Hold?
NET 3Y EV/Revenue and P/E Valuations
S&P Capital IQ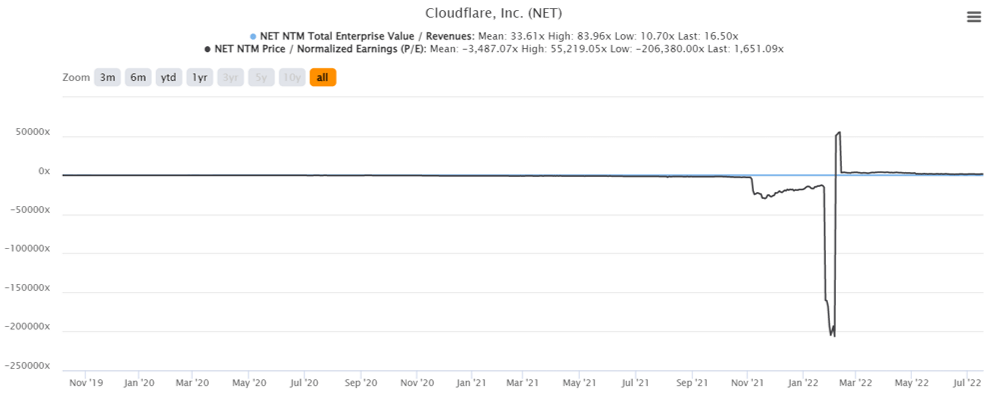
NET is currently trading at an EV/NTM Revenue of 16.5x and NTM P/E of 1651.09x, lower than its 3Y EV/Revenue mean of 33.61x though massively elevated from its 3Y P/E mean of -3487.07x, respectively. The stock is also trading at $53, down 76% from its 52 weeks high of $221.64, though at a 36% premium from its 52 weeks low of $38.96. It is evident that NET was also dragged down by Mr. Market in November 2021, together with the rest of the high-growth over-expensive tech stocks then.
NET 3Y Stock Price
Seeking Alpha
Despite consensus estimates attractive buy rating with a price target of $97.78, we are not convinced of the 84.49% upside. It remains to be seen if NET is able to sustain its previous Dollar-based Net Retention of 127% in Q1 2022, given the potential recession tightening corporate consumer spending in 2022 and 2023.
Microsoft (MSFT) had even trimmed its Q4 2022 guidance while also slowing down new hirings in preparation for a potential economic slowdown ahead, despite the stellar growth in its cloud revenues in Q3 2022. Therefore, NET’s upcoming earnings call on 04 August 2022 would definitely provide a much-needed preview for its FY2022 performance, given the projected slowing growth of the software market as a whole. Assuming a lowered forward guidance then, we expect to see a moderate retracement of its stock prices nearing their previous or new lows, which would provide a better entry point for any interested tech investors.
Therefore, we rate NET stock as a Hold for now.
Be the first to comment