

samxmeg/E+ via Getty Images
This week, the Fed hiked the short-term Fed Fund Rate by 75-basis points to the 1.50% to 1.75% level. The rate hike came on the back of last week’s CPI report that showed that inflation continued to escalate in May. The consumer price index rose 8.6% on a year-on-year basis, the highest level since December 1981. The core inflation gauge, excluding food and energy, increased by 6%. The PPI was 10.8% higher, leading the Fed to announce the most aggressive rate hike since 1994.
While the Fed’s tightening via increasing short-term rates and quantitative tightening can impact the economy’s demand side, the supply side is more of a challenge. The central bank has few tools to address the rising energy and food prices caused by US energy policy and the war in Europe.
Higher rates are weighing on the US stock market in 2022 as investors shift from stocks to bonds. Fixed-income assets are offering some of the most attractive yields in years, causing capital to flow to the bond market. Meanwhile, investors are also searching for alternative assets that provide capital appreciation potential. Chinese stocks have underperformed the US market over the past years. The iShares China Large-Cap ETF (NYSEARCA:FXI) is a highly liquid and optionable product. As of June 15, the APS was short the FXI as the trend remains bearish.
Higher lows in FXI, but the trend remains ugly
The FXI reached its most recent low on March 15, 2022, when the ETF fell to $26.13 per share. Since then, it has made higher short-term lows.
FXI- Chinese Large-Cap ETF (Barchart)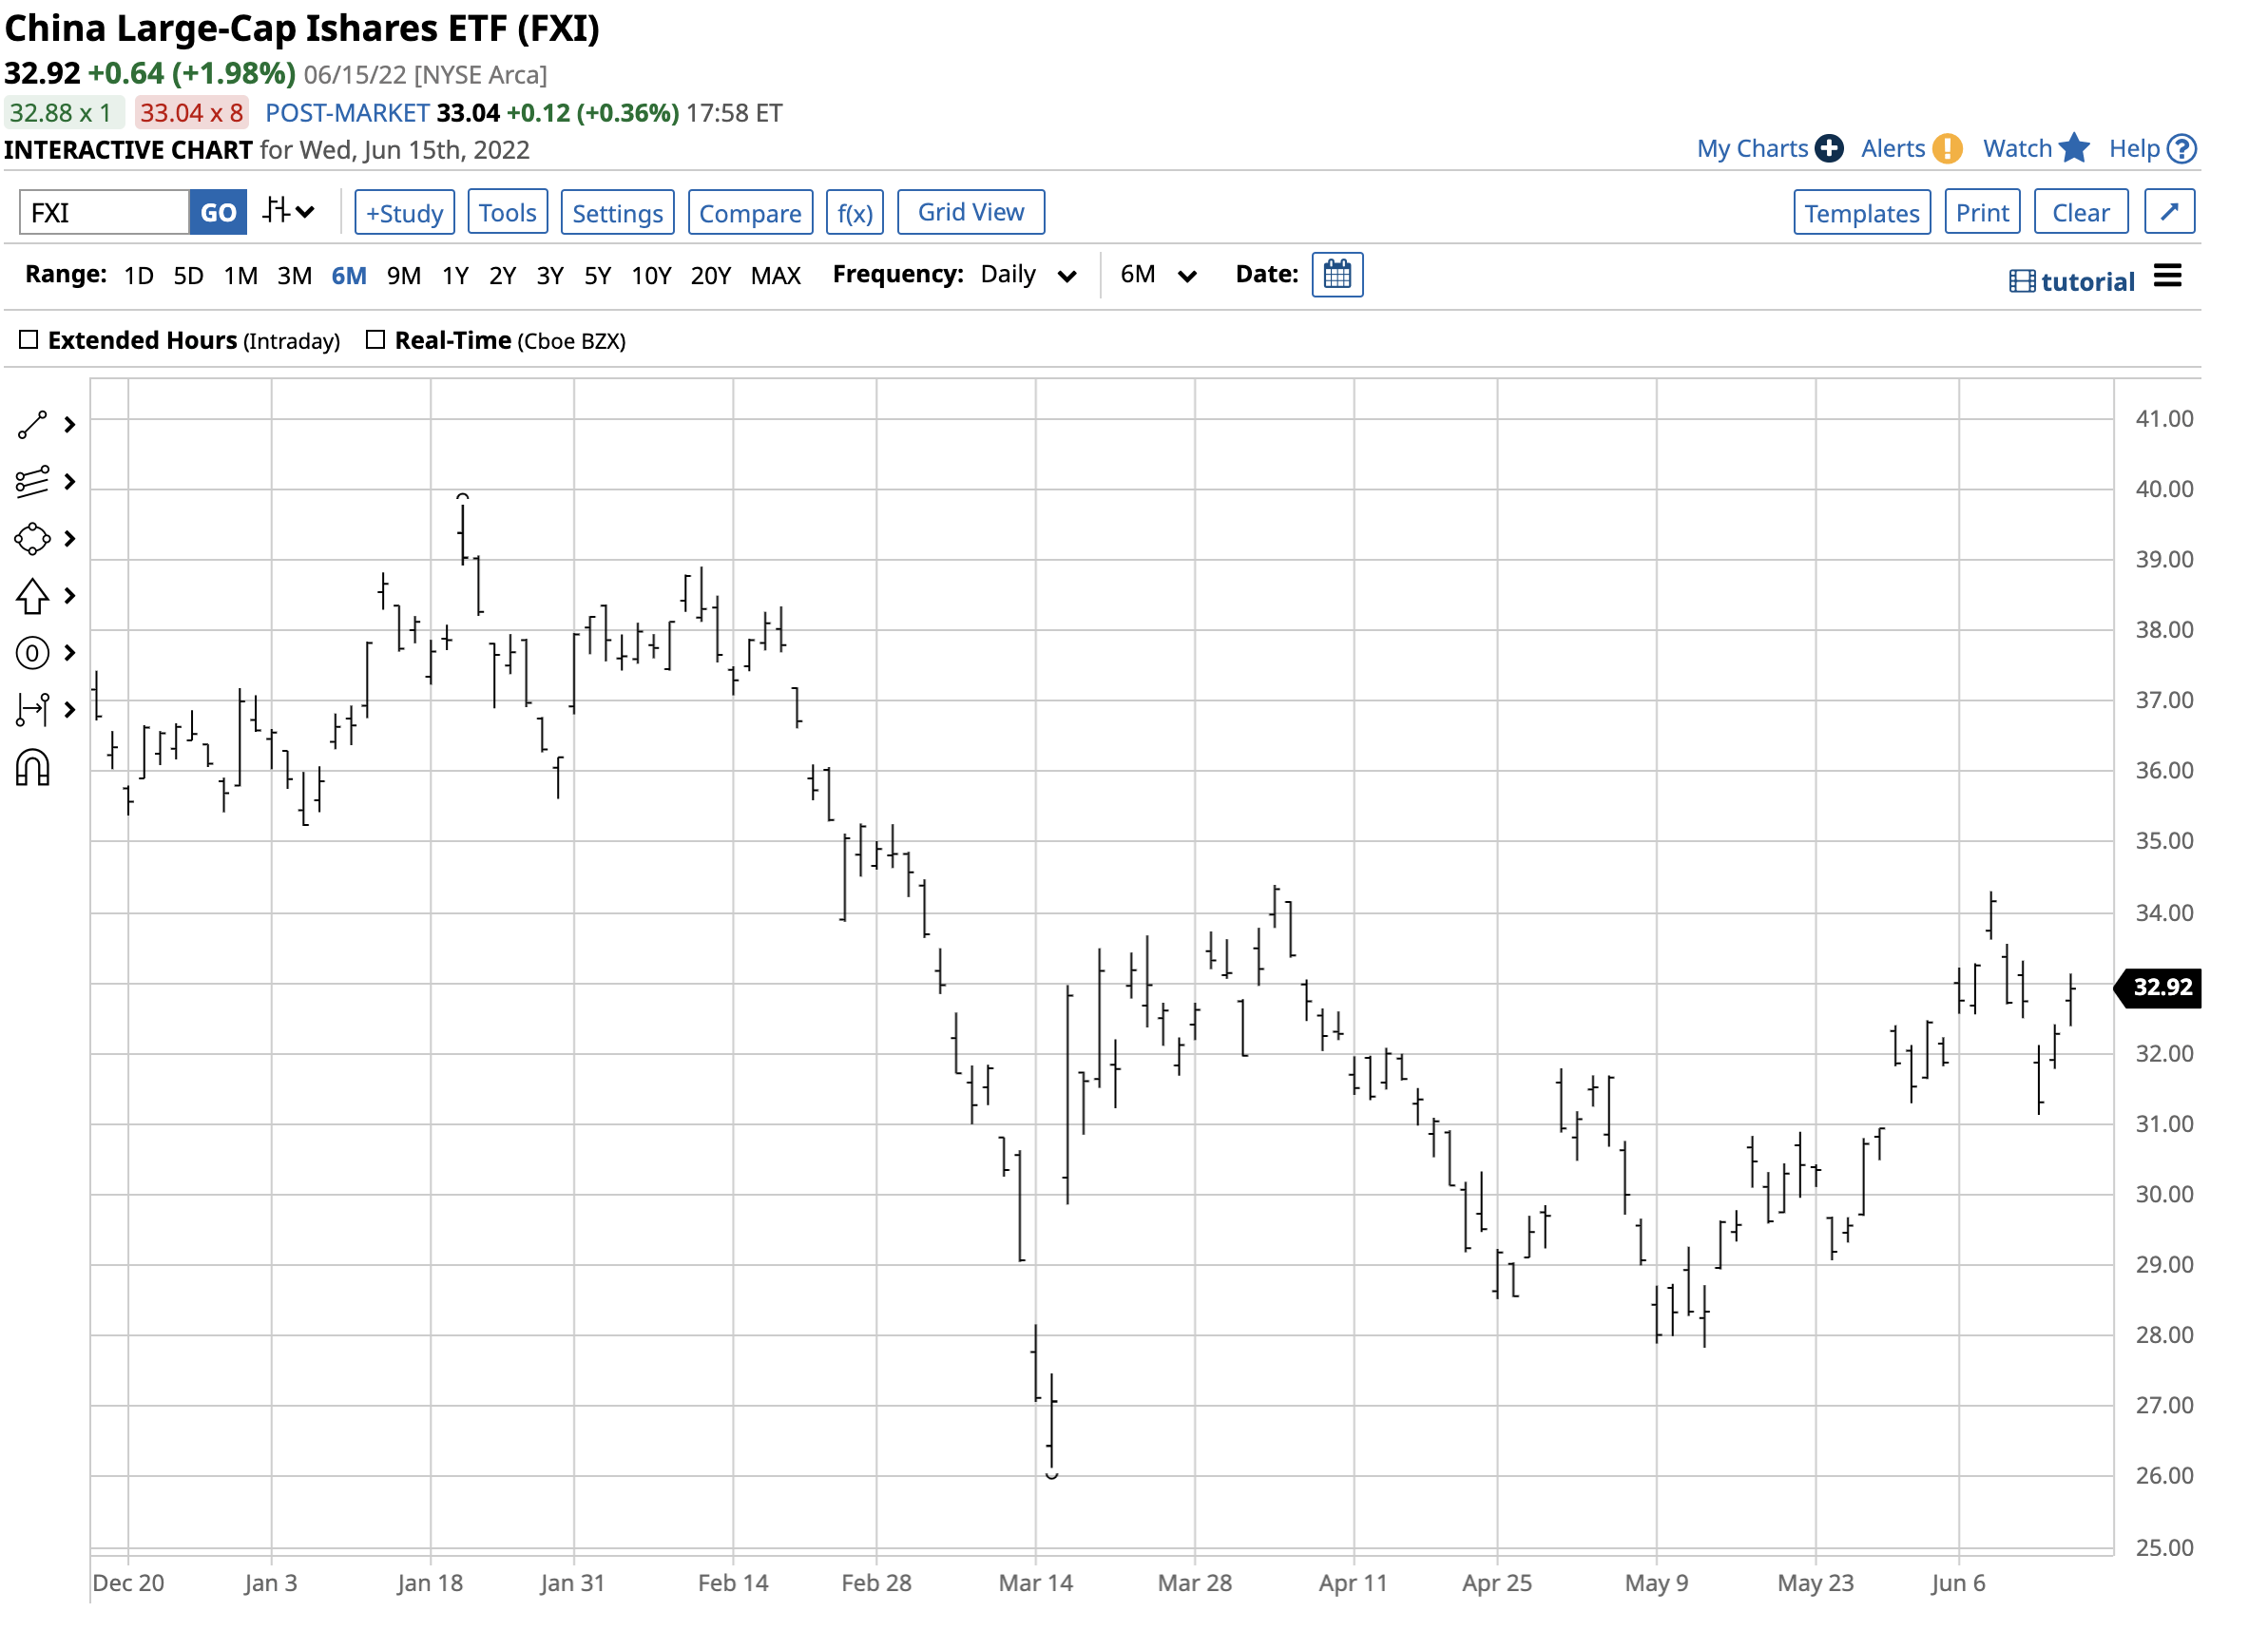
The chart highlights the recovery that took the FXI to $34.39 on April 4, but the ETF could only manage a rally to the $34.30 level on June 8, which was a lower high. The bounce did little to negate the long-term bearish trend in the leading Chinese large-cap stocks.
Long-term chart of the FXI ETF (Barchart)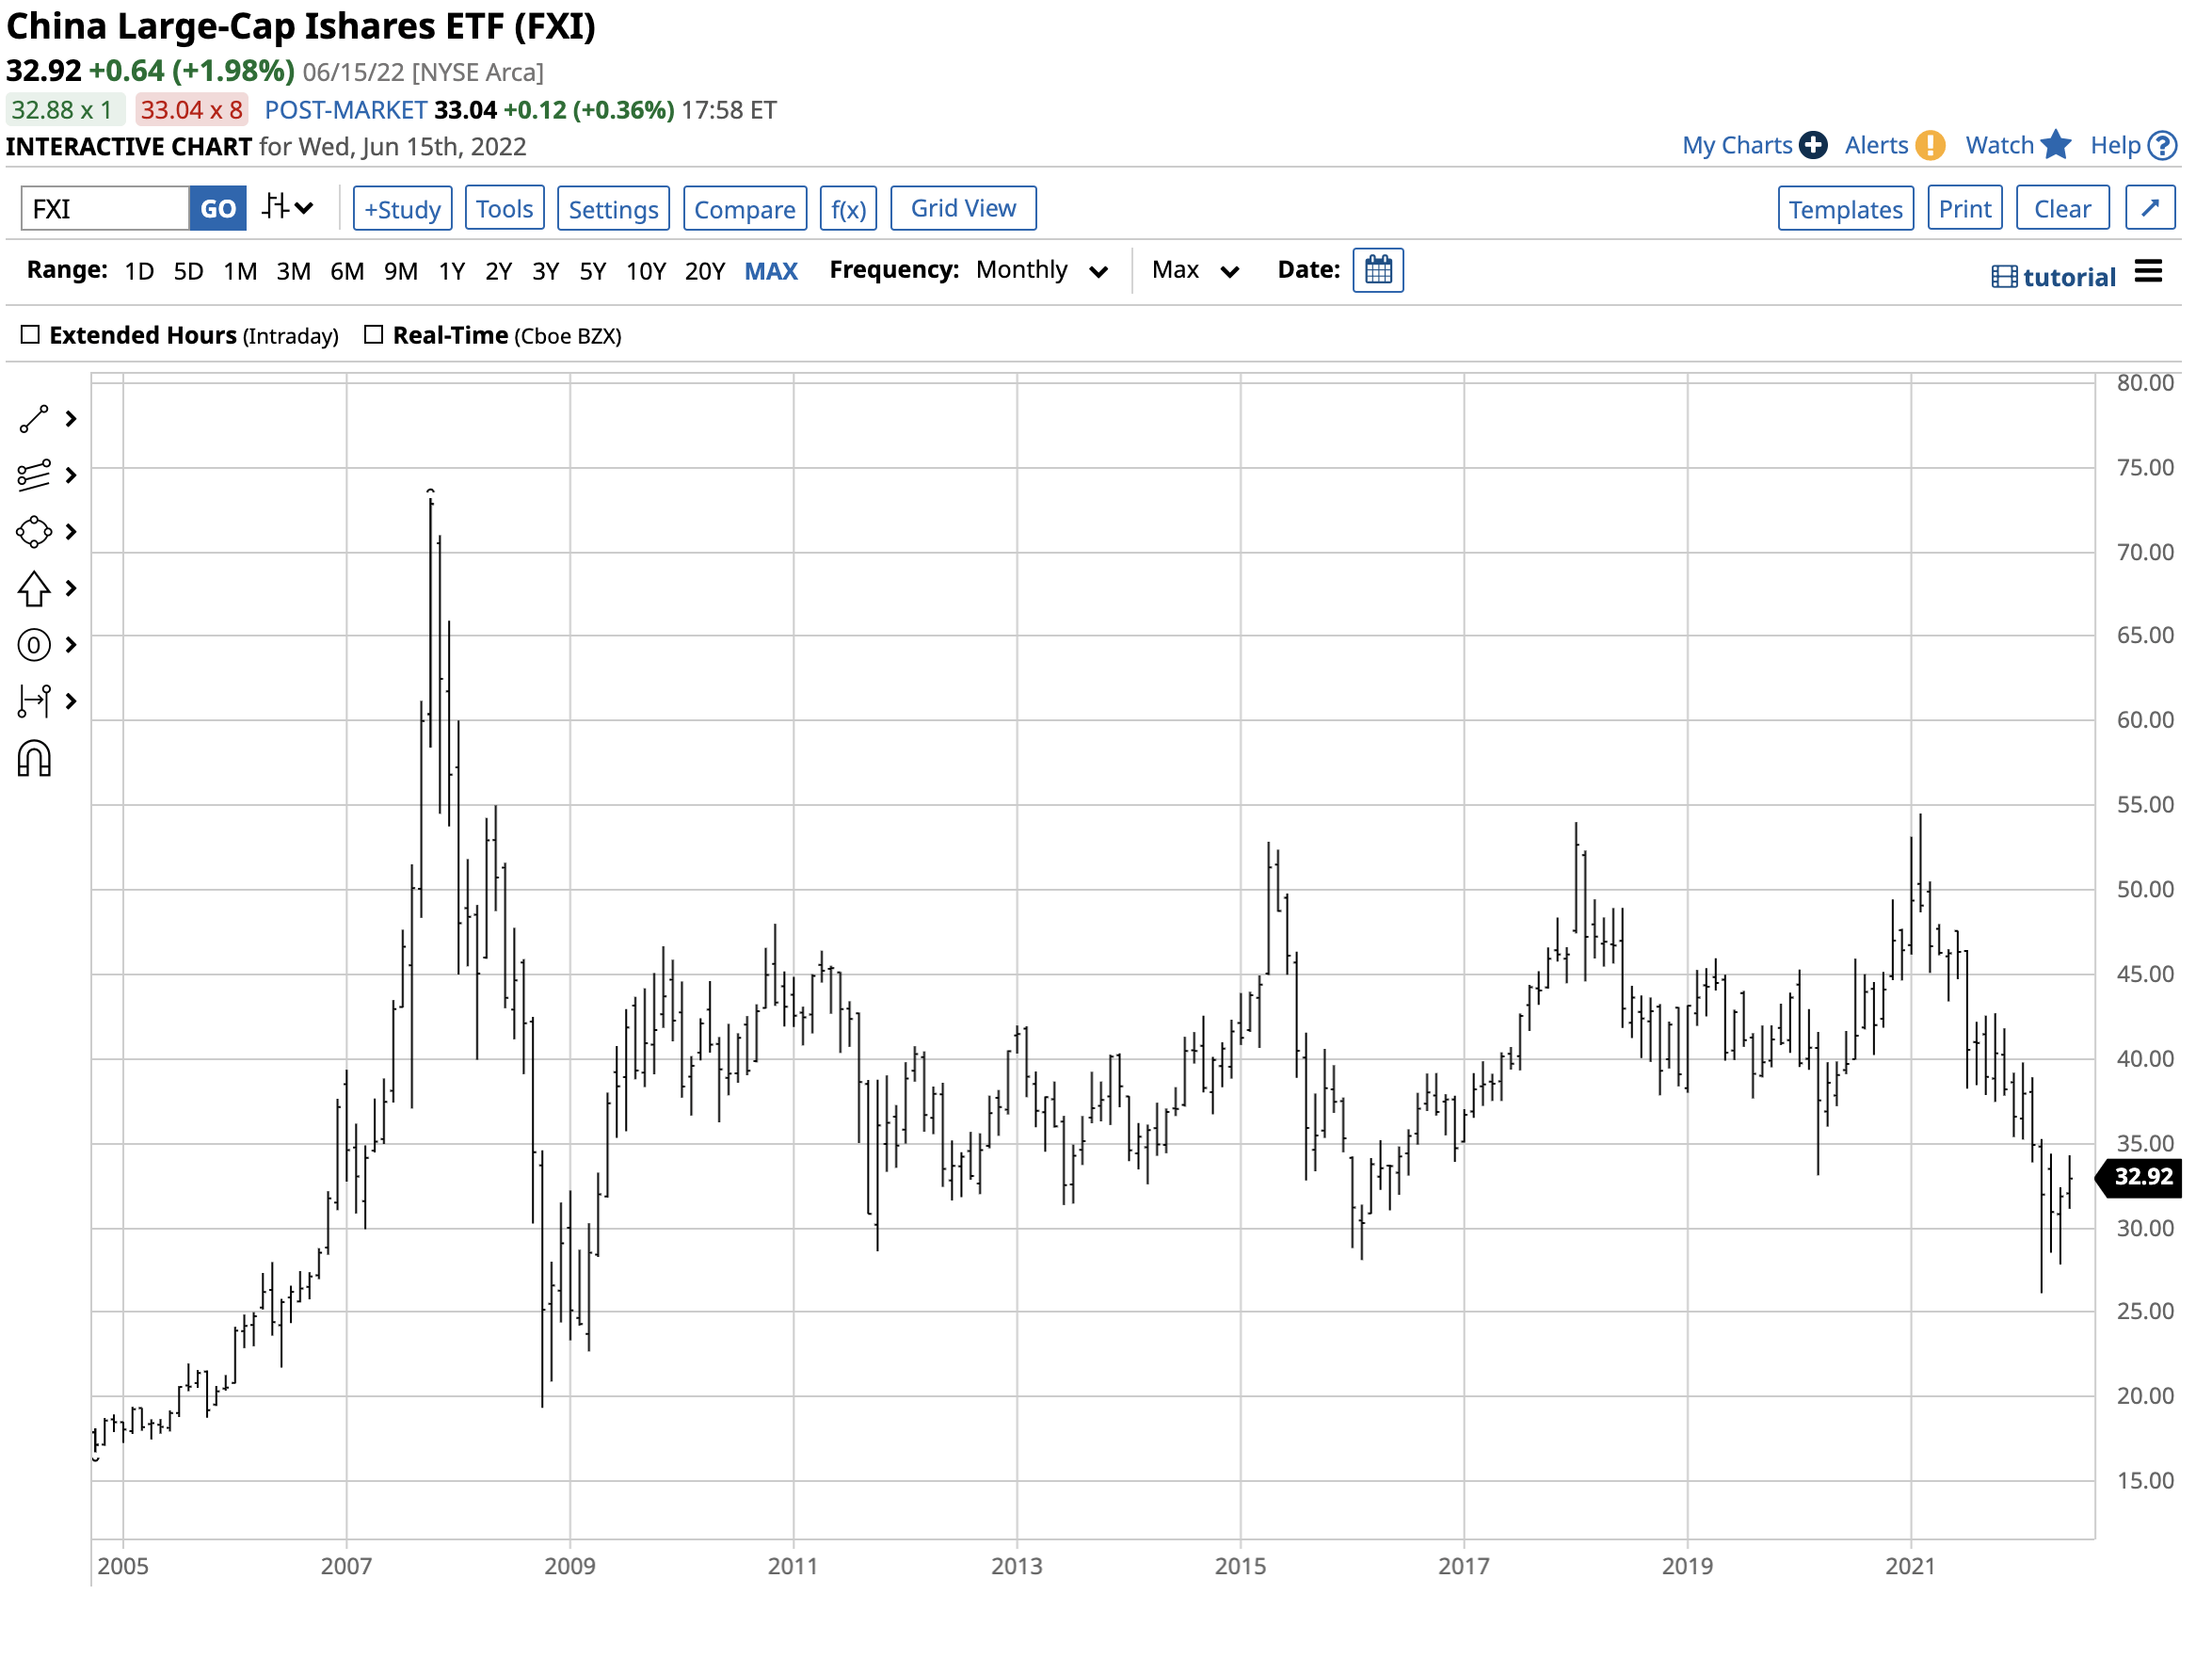
The chart shows that the March 2022 $26.31 low was the lowest level for the FXI since March 2009. At the $32.92 level on June 15, the FXI remains in a brutal bearish trend.
An eventual end to Chinese lockdowns – Tensions between Beijing and Washington are high
Chinese stocks fell in March after Russia invaded Ukraine as Beijing and Moscow agreed to a “no-limits” cooperation pact. Many investors abandoned any thoughts of Chinese equities in March, which pushed the FXI to a thirteen-year low.
After the recovery that took the FXI to the $34.39 per share level in early April, it ran out of steam, falling to a higher low. On June 6, the FXI peaked at nine cents below the early April high and turned lower.
The geopolitical bifurcation between nuclear powers is bearish for Chinese stocks. Tensions between Beijing and Washington DC are at the highest level in decades. China has warned Taiwan that independence would trigger a war.
Meanwhile, US warships move through the Taiwan Strait several times each year while en route between the East and South China Seas. Tensions have increased over the recent days as Chinese military officials have warned the US that the Taiwan Strait is not within international waters, raising a disagreement in the interpretation of international law.
Chinese stocks experienced a bounce as COVID-19 lockdowns declined, but the rally ran out of steam fast.
Investors are looking for alternatives, but China comes with high risks
Russia’s invasion of Ukraine, the Chinese-Russian “no-limits” alliance, and harsh warnings from Beijing to Washington over Taiwan are increasing tensions to what could become a boiling point over the coming months and years. Meanwhile, investors looking for alternatives to the US stock market, as rising interest rates and a strong US dollar weigh on equities, will likely continue to avoid Chinese stocks because of the rising geopolitical risks.
FXI lagged the US stock market in 2021; it is outperforming in 2022 but still down on the year
In 2021, the three leading US stock market indices posted impressive gains. The S&P 500 moved 26.89% higher, and the NASDAQ rallied 21.39%. The DJIA moved 18.73% to the upside last year. Meanwhile, the FXI ETF closed at $46.43 on December 31, 2020, and moved lower to $36.58, 21.2% lower on December 31, 2021.
Meanwhile, Chinese large-cap stocks are outperforming US stocks in 2022, but they are still lower. At the $32.92 level on June 15, the FXI is down 10% in 2022. FXI has a market cap of $5.505 billion, trades an average of over 37.7 million shares per day, and charges a 0.74% management fee.
The leading US stocks market indices have posted more significant losses, with the NASDAQ leading the way, down over 29%, the S&P 500 dropping over 20.4%, and the DJIA down more than 15.6%.
The FXI may have lost less than the leading US indices in 2022 as of June 15, but the trend in Chinese stocks is far from bullish.
The APS remains short the FXI ETF
As of June 15, 2022, the trend in the FXI ETF was lower. The APS was short FXI shares, as the trend is always your best friend in all markets. APS holds highly-liquid and optionable stocks and ETF products. FXI is a component as it meets the strategy’s requirements. At $32.92 per share, the Chinese large-cap ETF product has been trending to the downside, making lower highs and lower lows.
Following trends via an algorithmic system requires strict adherence to rules. We do not attempt to pick bottoms or tops in any markets and are typically short at bottoms and long at tops. Taking the most significant percentage out of trends requires removing emotional impulses from trading and investing. We ignore fundamentals, news, and all the daily noise. Our signals are never intraday, and they can only change at the end of a session. Our system does not get caught up in the daily frenetic trading activity. News and noise are at a frenzied level with the war in Ukraine, inflation raging, tensions over Taiwan and pundits opining on the central bank’s next move. We ignore the noise. The APS is always long or short its components.
The price of any asset is always the correct price because it is the level where buyers and sellers meet in a transparent environment, the marketplace. Crowd behavior that determines trends can be the optimal market approach across all asset classes. As of June 15, the crowd’s wisdom points to a bearish trend in FXI. The APS will issue a buy signal for the FXI when the trend changes. Chinese stocks may have outperformed US equities in 2022, but the trend in the FXI remains ugly.
Be the first to comment