

studiocasper/iStock via Getty Images
The Q2 2022 Global X China Sector Report can be viewed here. The report provides macro-level and sector-specific insights across the eleven major economic sectors in China’s equity market. In addition to a summary of developments in Q2, we also offer our outlook for the current quarter. For a broader look at Global X’s international funds, please see the latest International Report Q2 2022.
Q2 Summary: Shanghai Lockdown Shakes Chinese Economy
China faced significant setbacks in Q2 2022 as a surge in Omicron cases brought Shanghai, a city that accounted for 3.8% of China’s GDP in 2020, into approximately a two-month lockdown, resulting in year-on-year GDP growth of 0.4% in Q2 and 2.5% in H1 (first half of) 2022, off track for the original goal of around 5.5% growth in 2022.1,2 Although China dodged a recession, Omicron did complicate its other goal of economic stability above all in 2022.
Around the beginning of Q2, Shanghai entered a state of lockdown that lasted from the beginning of April to the beginning of June, creating logjams in global supply chains and depressing domestic consumer confidence. Although policymakers moved to limit the adverse impacts of the lockdown by allowing workers to operate in “closed-loop systems,” similar to what was implemented in the 2022 Beijing Winter Olympics, it was not enough to stop economic bleeding. As the lockdown continued, average dwell times for import containers at the port of Shanghai ballooned while trucks faced obstacles in taking materials and goods in and out of the city.
At the beginning of June, the lockdown was formally lifted, but certain restrictions remained in place, particularly on dining-in and travel.
The convergence of headwinds in 2022 is prompting Beijing to maintain an accommodative stance on the economy. While central banks around the world are moving in line with the US Federal Reserve and raising interest rates, in May, China made the decision to cut its five-year loan prime rate (LPR), used for mortgage pricing, by a more-than-expected 15 basis points.3 This was soon followed up by the release of a 33-point stimulus plan on May 31, that includes tax and fee reductions for MSMEs (Micro, Small, and Medium Enterprises), the issuance of special-purpose bonds for infrastructure projects and offering incentives to hire new graduates, among many other points.4 This dovish stance in monetary policy counters to the rising inflation narrative and hawkish policies set by central banks globally, but speaks to China’s desire to stimulate its economy.
At the same time, regulators began to see the merits in easing the tech crackdown that grabbed headlines in 2021. The tone began to change in Q2. In May, top Chinese Communist Party officials held a symposium with leaders of big tech companies and offered to restore confidence in the battered sector. In June, the People’s Bank of China (PBoC) accepted Ant Group’s (BABA) application to establish a financial holding company while regulators offered tentative approval for its listing, the probe into Didi (OTCPK:DIDIY) wrapped up and its apps were allowed back on Chinese app stores, and a report by the Chinese Academy of Social Sciences emphasized the role of internet platform companies as “top contributors” to the Common Prosperity initiative.
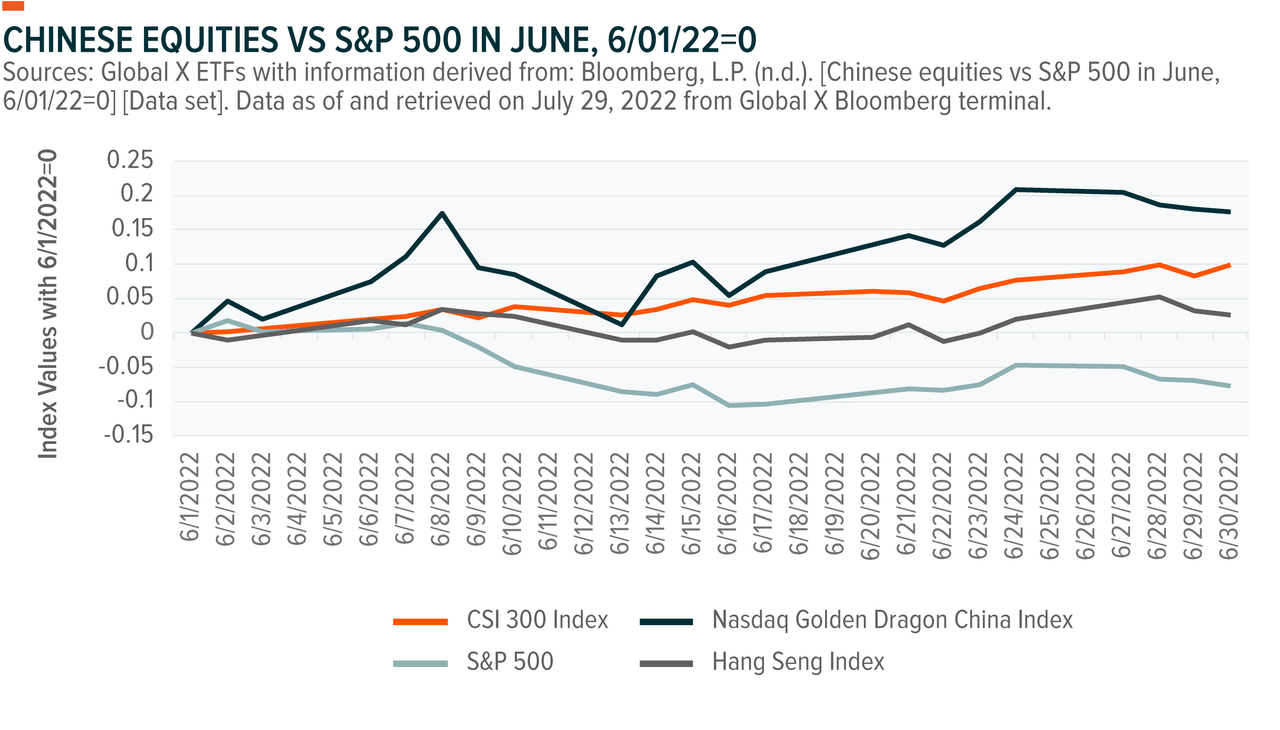
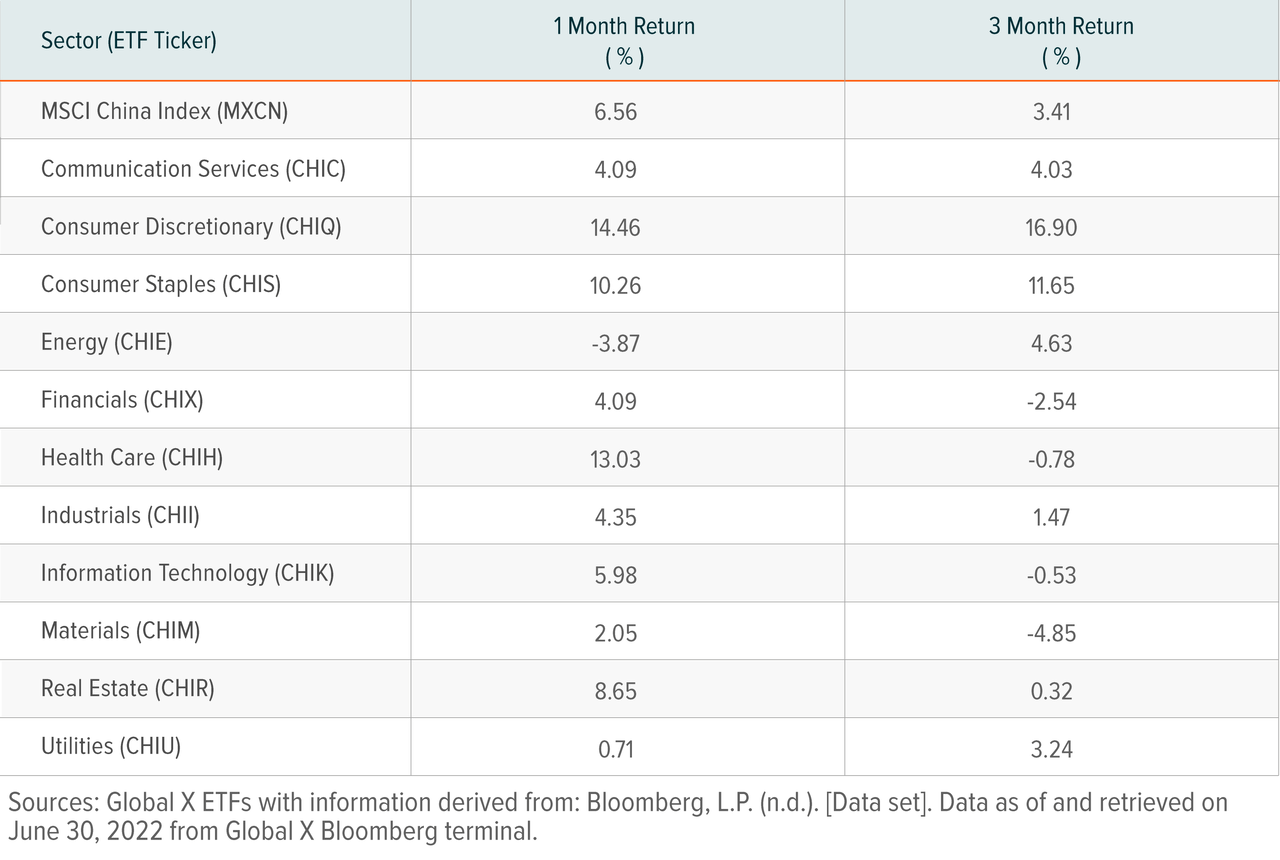
The combination of these factors led to a rally in Chinese equities in June while equities in other markets fell. In June 2022, the CSI 300 Index jumped up by 9.6%, the Nasdaq Golden Dragon China Index jumped up by 16%, and the Hang Seng Index made more moderate gains of 2.1%.5 Within Global X’s China Sector lineup, the Global X MSCI China Consumer Discretionary ETF (CHIQ) performed the best, posting gains of 16.90% in Q2. Over the same time period, the Global X MSCI China Consumer Staples ETF (CHIS) delivered the second best gains, rising by 11.65% in Q2.
Q3 Insights: Building Off June’s Momentum, While Watching COVID Wildcard
As we move into Q3, more investors are now looking at Chinese equities, a good portion of which we believe are now sitting at attractively cheap valuations. The MSCI China Index has a 12-month forward Price-to-Earnings (P/E) ratio of 11.28, while 12-month forward P/E ratios of the Global X MSCI China Financials ETF (CHIX) and Global X MSCI China Consumer Discretionary ETF (CHIQ) are at 4.52 and 23.48, respectively, as of Jul 28, 2022.6
More than a month out from the formal end of the Shanghai lockdown, China is moving towards recovery with the Purchasing Manager Index (PMI) returning to expansion territory while a moderate Consumer Price Index (CPI) of 2.5% in June gives policymakers room to maintain easing.7 Nonetheless, challenges exist. In particular, the risk of another lockdown in a major city is a wildcard that can undermine forecasts. China will likely post decent growth in Q3, albeit boosted to some extent by a low-base effect.
The zero-COVID policy will likely persist until after the end of 2022. Aside from political considerations such as the upcoming 20th Party Congress, relatively low vaccinations rates among the elderly make it difficult to switch away from the zero-COVID approach. Right now, the spread of the new BA2.75 Omicron subvariant is creating anxiety and prompting officials to implement mass-testing in major cities like Beijing and Shanghai. As of Jul 19, the weekly average case count in China was at 528, down from a peak of over 26,000 in mid-April.8 Whether this momentum will lead to another lockdown has yet to be seen, but that is certainly an outcome Beijing hopes to avoid.
Despite uncertainty in the short-term macro story, cheap valuations are drawing investor attention, particularly for the tech companies, which along with education companies bore the brunt of 2021’s regulatory moves. Alibaba (BABA), Pinduoduo (PDD), and JD.com (JD) are examples of tech companies that navigated through headwinds during the tech crackdown. With positive signals suggesting the relaxation of the tech crackdown, we believe prices will possibly climb as investors begin to believe that the worst is behind us.
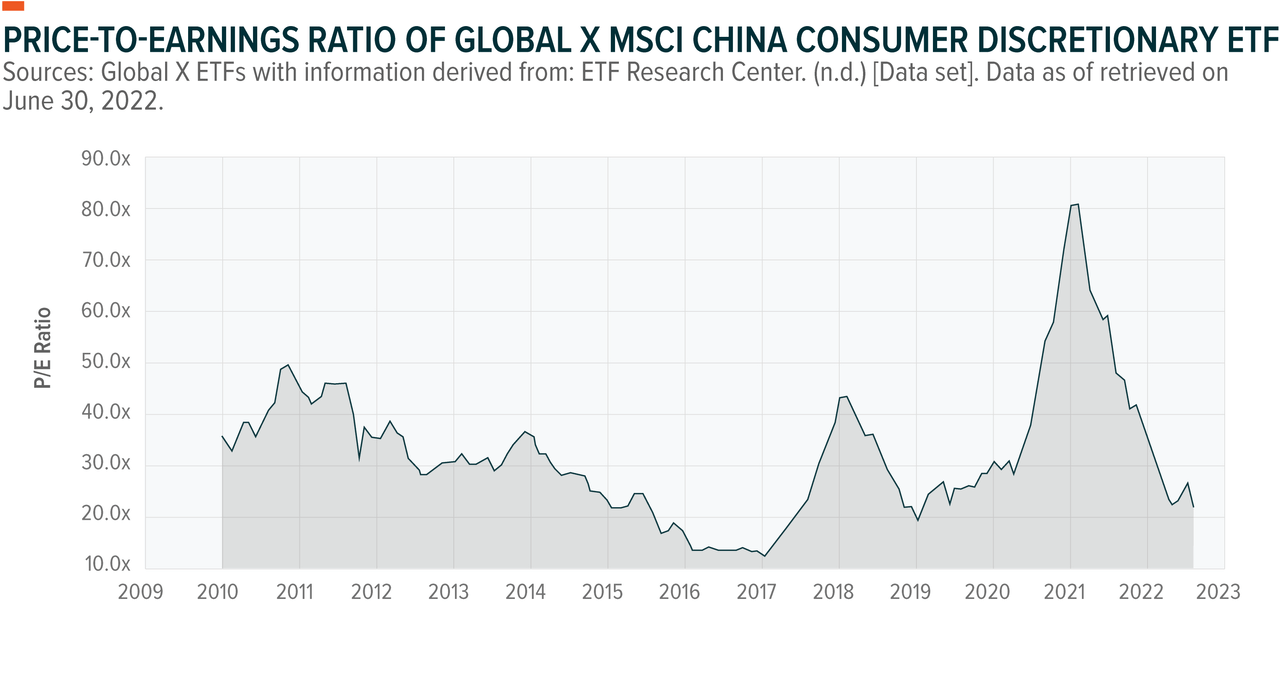
CHIQ’s P/E ratio suffered a precipitous collapse in 2021 during the regulatory crackdown.
A lot of these consumer internet companies with cheap valuations fall into Consumer Discretionary, which is part of the reason why CHIQ performed so well in Q2. The positive signs of easing on the tech crackdown will likely work in favor of these holdings. Meanwhile, some of the stimulus measures pushed by the government include extending incentives for Electric Vehicles and automobile purchases, which is also a category under Consumer Discretionary. Of course, these potential positive effects must be weighed against the fact that consumer anxiety lingers while certain restrictions remain on dining-in and travel.
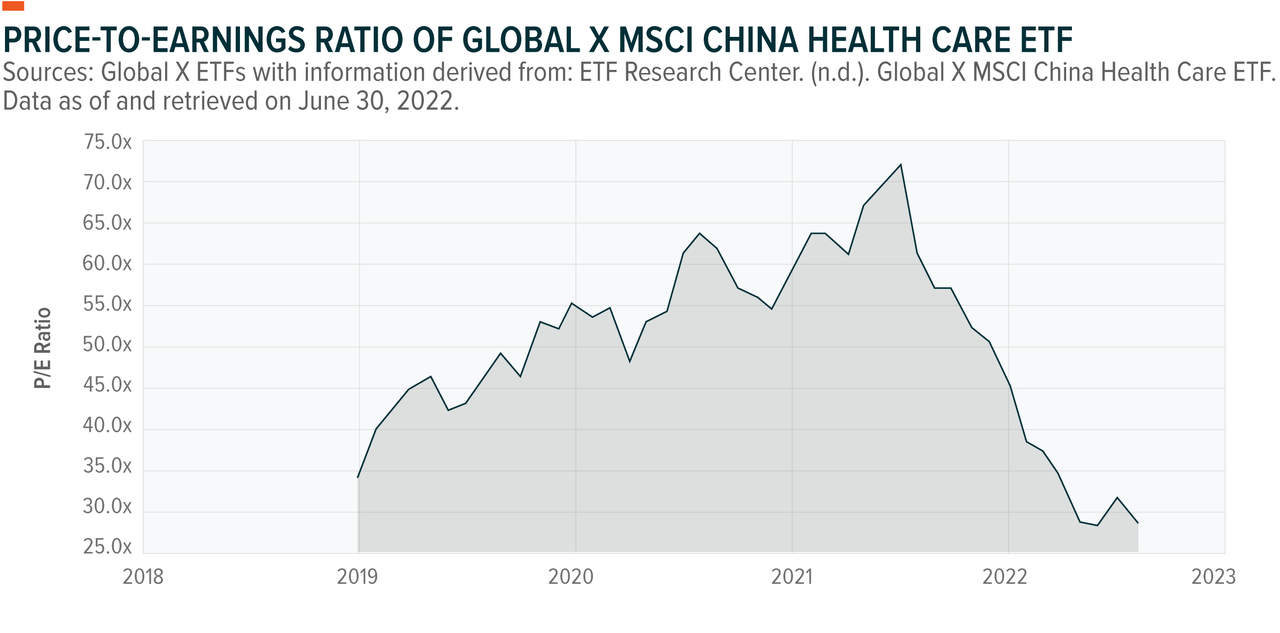
The Chinese Healthcare sector was also hit hard by regulations and saw its value tumble, however we see potential for recovery. In the short term, China will need to prepare to transition away from the zero-COVID policy likely at some point next year. Over a much longer time-frame, China’s aging population is a virtually irreversible trend that should boost demand for healthcare services. Venture capital investors are seeing room for growth in the Healthcare space, as evidenced by Sequoia China raising $9bn for funds that will invest in Healthcare and Information Technology startups.9
Energy stocks have performed well year-to-date with the Global X MSCI China Energy ETF (CHIE) delivering total returns of 26.23%, as of Jun 30, 2022.10 A look into the performance of holdings within CHIE reveals a divergence between coal and oil stocks, with the former delivering exceptionally high returns. Energy security is top of mind for Chinese policymakers this year and approvals for coal power are abnormally high as a result. As China prioritizes economic stability even further in the aftermath of the Shanghai lockdown, and as the effects of Western sanctions on Russian Energy settle in, demand for coal may increase further.
Performance shown is past performance, based on the NAVs of the underlying sector ETFs and does not guarantee future results. The investment return and principal value of an investment will fluctuate so that an investor’s shares, when sold or redeemed, may be worth more or less than their original cost and current performance may be lower or higher than the performance quoted.
Dispersion Between China Sectors
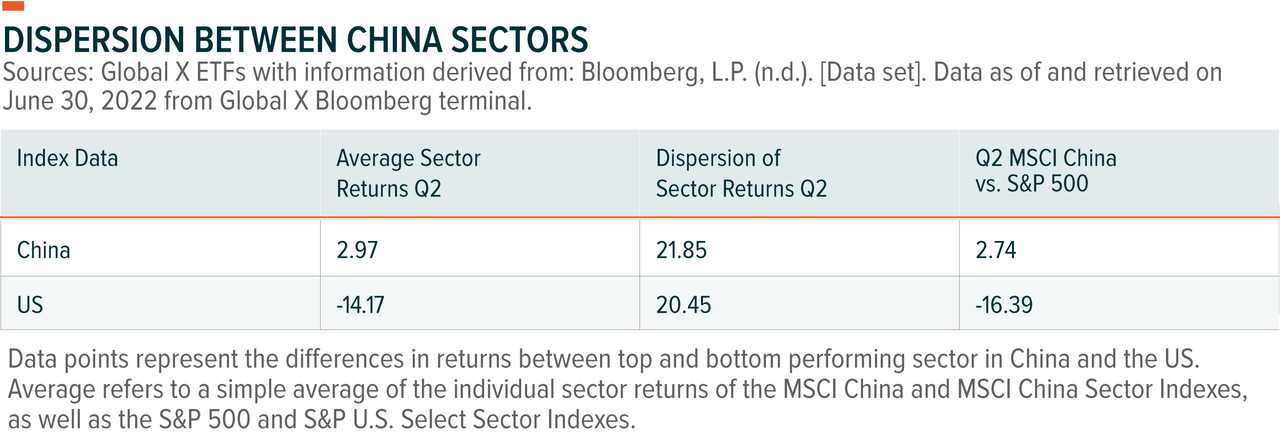
Sector dispersion is the difference between the best and worst performing sectors in each country. In Q2, China and the US had similar levels of sector dispersion at around 20%. The clearest difference is the average sector returns. Whereas the US had strongly negative average returns of -14.17%, China remained positive with 1.67% gains.
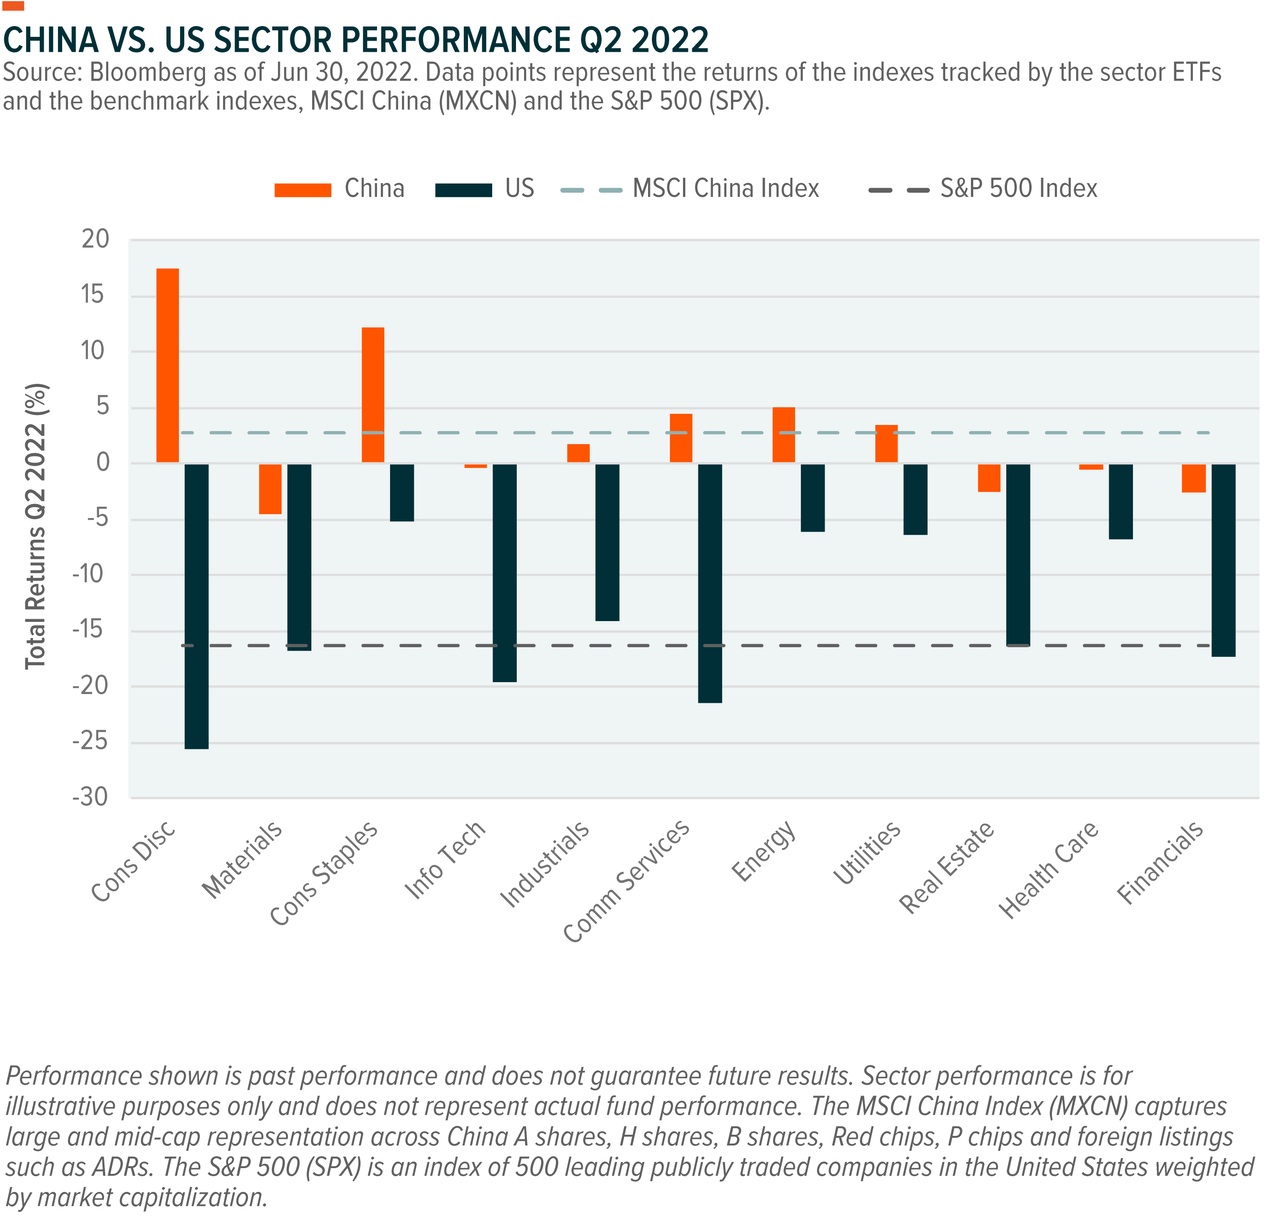
How China Sector Performance Measured Up Against U.S. Counterparts
In the chart below, we show performance of indexes that track China’s 11 GICS sectors, as well as their U.S. sector index counterparts.
Related ETFs
FOOTNOTES
1. Textor, C. (2022, April 27). Shanghai’s share in China’s total GDP 2005-2020. Statista. China: Shanghai’s share in China’s total GDP | Statista
2. Yao, K. (2022, July 14). China GDP data to show sharp slowdown in Q2, tepid recovery in June. Reuters. China GDP data to show sharp slowdown in Q2, tepid recovery in June
3. Bloomberg News. (2022, May 19). China banks cut key rate by record to boost ailing economy. Bloomberg.
4. Huld, A. (2022, June 2). China releases 33 new stimulus measures to boost economy. China Briefing. China Stimulus Policy – 33 New Support Measures for Boosting Growth
5. Shen, Y. (2022, June 30). Chinese stocks in US top S&P with best month in three years. Bloomberg.
6. Bloomberg, L.P. (n.d.). [PORT function] [Data set]. Data as of and retrieved on June 30, 2022 from Global X Bloomberg terminal.
7. Liangping, G., Zhang, E., & Woo, R. (2022, July 9). China’s June factory inflation cools counter to global trends. Reuters. China’s June factory inflation cools counter to global trends
8. Ritchie, H, Mathieu, E., Rodés-Guirao, L., Appel, C., Giattino, C., Ortiz-Ospina, E., Hasell, J., Macdonald, B., Beltekian, D., & Roser, M. (2022, June 30). China: Coronavirus pandemic country profile. China: Coronavirus Pandemic Country Profile
9. Chen, L. Y., & Bloomberg. (2022, July 5). Sequoia China has raised $9 billion to invest in tech and health care as investors flock back to the country. Fortune. Sequoia China has raised $9 billion to invest in tech and health care as investors flock back to the country
10. Bloomberg, L.P. (n.d.). [PORT function] [Data set]. Data as of and retrieved on June 30, 2022 from Global X Bloomberg terminal.
GLOSSARY
CSI 300 Index: The CSI 300 Index is a free-float weighted index that consists of 300 A-share stocks listed on the Shanghai or Shenzhen stock exchanges.
Nasdaq Golden Dragon China Index: The NASDAQ Golden Dragon China Index is a modified market capitalization weighted index comprised of companies whose common stock is publicly traded in the United States and the majority of whose business is conducted within the People’s Republic of China.
Hang Seng Index: The Hang Seng Index (“HSI”) is a freefloat-adjusted index that includes the largest and most liquid stocks listed on the Main Board of the Stock Exchange of Hong Kong.
This material represents an assessment of the market environment at a specific point in time and is not intended to be a forecast of future events, or a guarantee of future results. This information should not be relied upon by the reader as research or investment advice regarding the funds or any stock in particular. Discussion of funds other than the Global X ETFs is intended for informational purposes only and is not intended as an offer to sell or solicitation of an offer to buy any funds.
Investing involves risk, including the possible loss of principal. International investments may involve risk of capital loss from unfavorable fluctuation in currency values, from differences in generally accepted accounting principles, or from economic or political instability in other nations. Emerging markets involve heightened risks related to the same factors as well as increased volatility and lower trading volume. Securities focusing on a single country and narrowly focused investments may be subject to higher volatility. The Global X China Sector Funds are non-diversified.
Shares of ETFs are bought and sold at market price (not NAV) and are not individually redeemed from the Fund. Brokerage commissions will reduce returns. Forward looking characteristics are not a forecast of the funds’ future performance. Beginning October 15, 2020, market price returns are based on the official closing price of an ETF share or, if the official closing price isn’t available, the midpoint between the national best bid and national best offer (“NBBO”) as of the time the ETF calculates current NAV per share. Prior to October 15, 2020, market price returns were based on the midpoint between the Bid and Ask price. NAVs are calculated using prices as of 4:00 PM Eastern Time. The returns shown do not represent the returns you would receive if you traded shares at other times. Indices are unmanaged and do not include the effect of fees, expenses or sales charges. One cannot invest directly in an index.
Forward looking characteristics are not a forecast of the funds’ future performance.
Carefully consider the funds’ investment objectives, risks, and charges and expenses. This and other information can be found in the funds’ full or summary prospectuses, which may be obtained at globalxetfs.com. Please read the prospectus carefully before investing.
Global X Management Company LLC serves as an advisor to Global X Funds. The Funds are distributed by SEI Investments Distribution Co. (SIDCO), which is not affiliated with Global X Management Company LLC. Global X Funds are not sponsored, endorsed, issued, sold or promoted by MSCI nor does MSCI make any representations regarding the advisability of investing in the Global X Funds. Neither SIDCO nor Global X is affiliated with MSCI.
Editor’s Note: The summary bullets for this article were chosen by Seeking Alpha editors.
Be the first to comment