

JHVEPhoto/iStock Editorial via Getty Images
Big Oil may have reached a top in early June. Here’s why. Over my 35 years of trading and investing, I cannot recall a similar ultra-bullish sentiment stance by mom-and-pop investors, Wall Street analysts, and business CEOs/insiders. Everyone was universally bullish moving into June. Who can blame them? We’ve just experienced the strongest run for oil/gas related equities since the early 1970s. After the COVID-19 economic shutdowns piled selling and pessimism on top of Saudi Arabia’s push to oversupply the market in early 2020, superb bargains were everywhere you searched. I wrote countless bullish oil/gas articles during both 2020 and 2021 explaining the potential for additional upside.
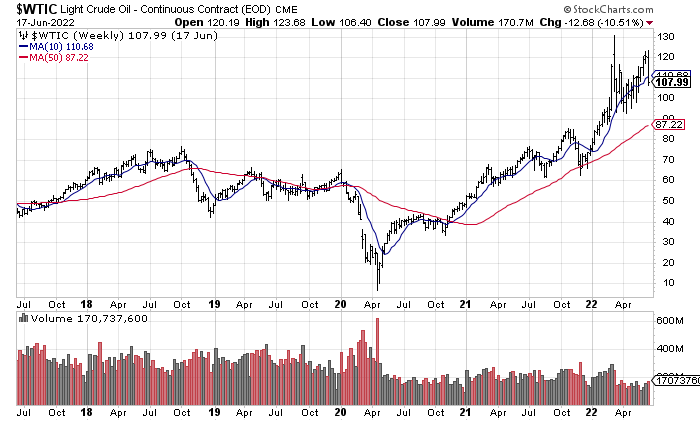
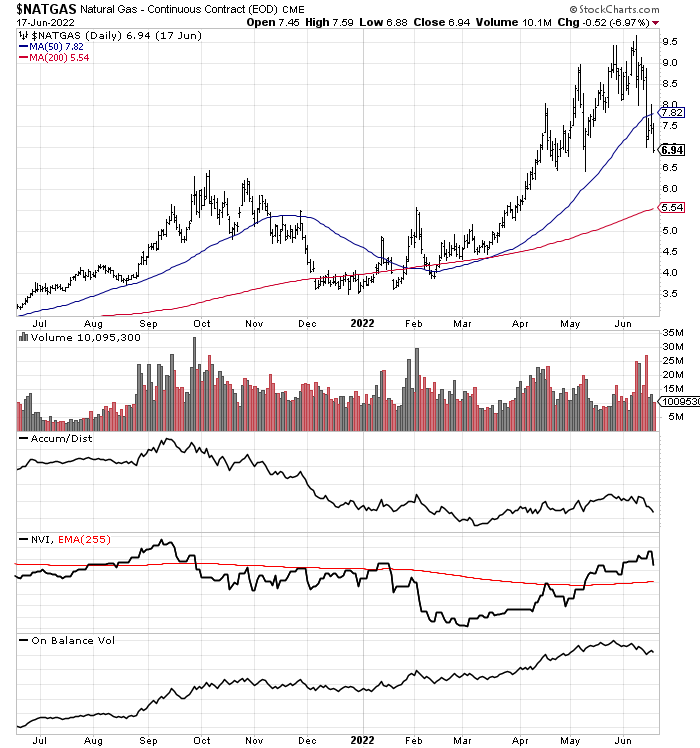
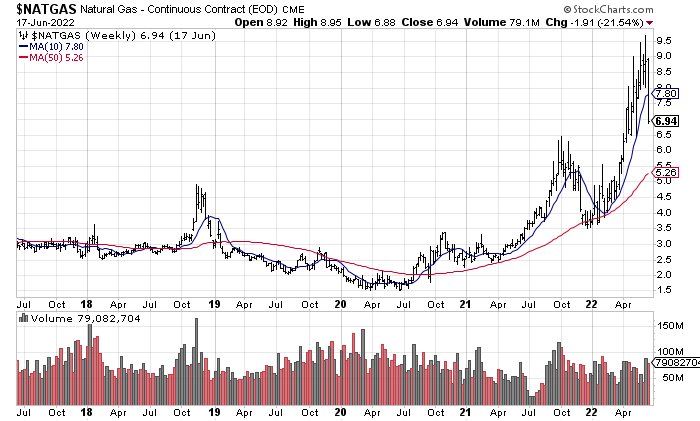
Then, Russia invaded Ukraine in February 2022, and the oil market (especially in western nations supporting Ukraine) has now reached a shortage situation. Basically, over two years flat, we have experienced a normalized 5 to 7-year oil upswing from one of the most oversold extremes in petroleum energy history.
My argument is we now stand at Peak Optimism, and likely a major oil/gas top in May-June 2022. It’s the exact opposite supply/demand market balance and psychological sentiment setup of April 2020. Follow me on this… energy markets could quickly rebalance later in the summer. As new supplies trickle in to capture high profit margins, and a slowing global economy with reduced energy demand is reality in the second half of the year, prices for petroleum will roll over and start declining.
I know fossil fuel bulls don’t want to hear this, but oil/gas investments will almost surely lag the S&P 500 index in price action or even tank soon. I am modeling the honest probability of a surplus of crude oil on the market in 2023, with prices per barrel possibly under US$70. It’s not rocket science.
1-Year Chart, StockCharts.com 5-Year Chart, StockCharts.com 1-Year Chart, StockCharts.com 5-Year Chart, StockCharts.com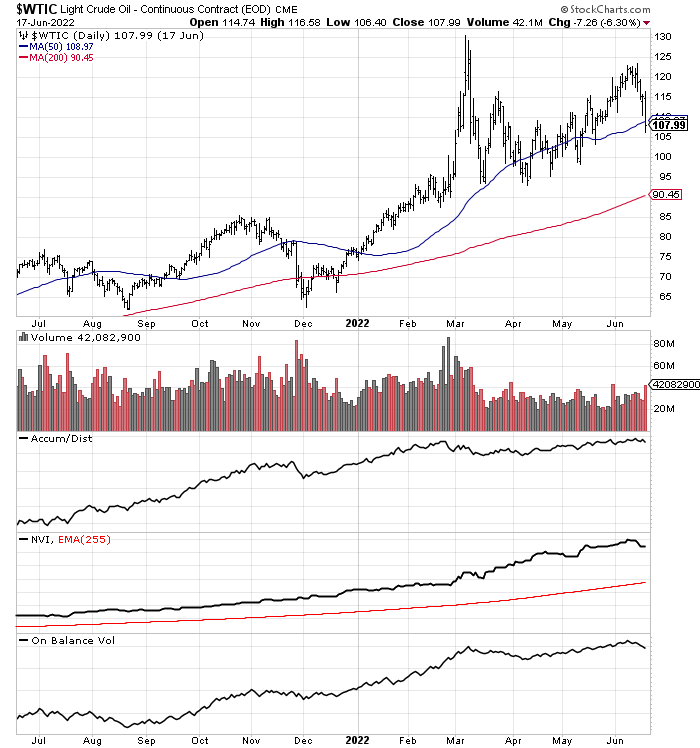
I have been hinting at a sector-wide top for months in my articles, especially this effort in March suggesting selling or shorting E&P-focused Occidental Petroleum (OXY), as Warren Buffett’s Berkshire Hathaway (BRK.A) (BRK.B) has a less than stellar record of purchasing/selling commodity-related businesses the last few decades. And, despite further gains in crude oil and natural gas values in America, OXY is sitting at the same price as my $57 sell article. In other words, all the excitement over Buffett’s continued purchases and record pricing in many refined consumer energy goods have been offset by a declining stock market generally, with a growing realization that demand destruction is a clear and present danger for dirty energy investments. [I wrote a pair trade idea of going long the solar energy industry vs. short Big Oil in March here.]
Another fear investors must reckon with is the U.S. government is seriously considering enacting a special “windfall” tax on Big Oil to recoup extraordinary profits on record gasoline prices for consumers. The idea is oil companies (investors) should not be able to profiteer off Putin’s war on Ukraine. If enacted, such a tax would vastly reduce the value of oil investments for owners. Current Congressional proposals under consideration range from an additional 21% to 50% tax on Big Oil income.
Chevron
Another major energy investment for Buffett is Chevron Corporation (NYSE:CVX), the west-coast Standard Oil incarnation. His total holdings in CVX at the end of March are now worth about $24 billion. While Chevron makes greater sense than Occidental Petroleum to me, with an integrated retail business model and steady/high trailing dividend yield of 3.7%, today’s backdrop of peak investor optimism will make extraordinary gains quite difficult from $148 a share quote. Quite worrisome for bulls, CVX’s price is already down -15% from its all-time high, with just two weeks of light selling under its belt on a sharp dip in crude oil prices.
Chevron’s valuation is not exactly a bargain. Below is a 28-year graph of basic enterprise value (equity + debt capitalizations – cash) vs. trailing 12-month earnings before interest, taxes, depreciation and amortization (EBITDA) and sales. What investors/analysts fail to recognize, if oil/gas prices fall appreciably, forward calculations could be closer to extreme “overvaluations” above 10x EBITDA and 2x revenues!
YCharts
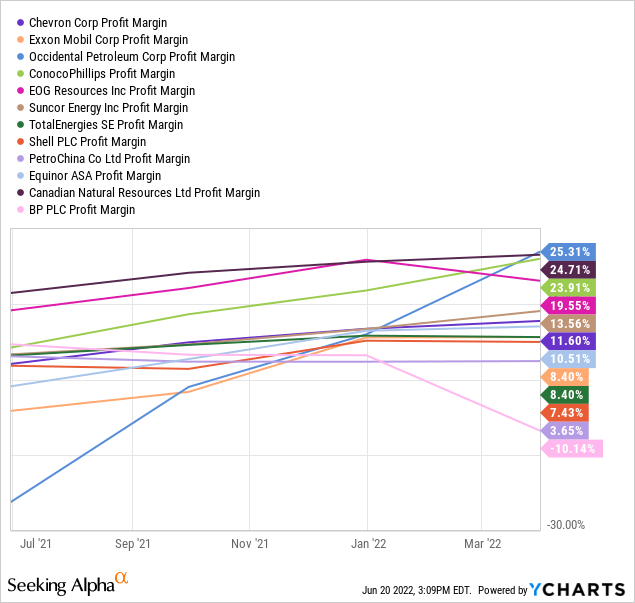
Chevron is also one of the richest-priced Big Oil securities available for new investment around $150 a share. Below is a graph comparing CVX to closest competitors and peers including Exxon Mobil (XOM), Occidental Petroleum, ConocoPhillips (COP), EOG Resources (EOG), Suncor Energy (SU), TotalEnergies (TTE), Shell PLC (SHEL), PetroChina (PTR), Equinor (EQNR), Canadian Natural Resources (CNQ), and BP PLC (BP). On “forward” projected numbers, which may very well represent peak operating results, Chevron is valued on the expensive end of the spectrum.
YCharts YCharts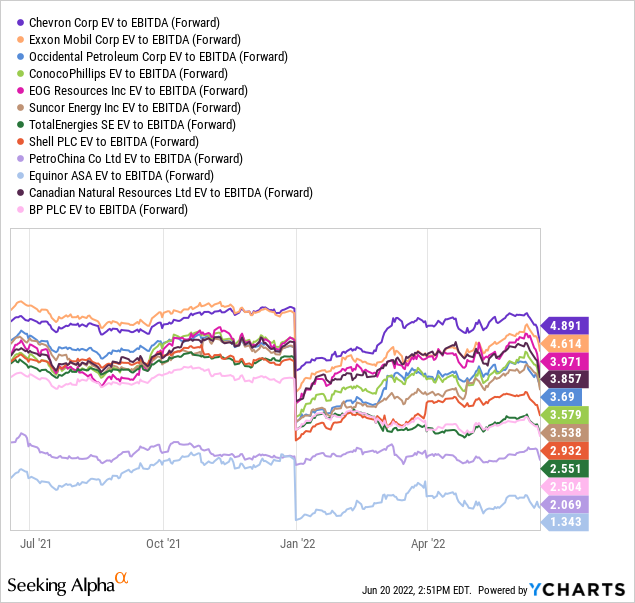
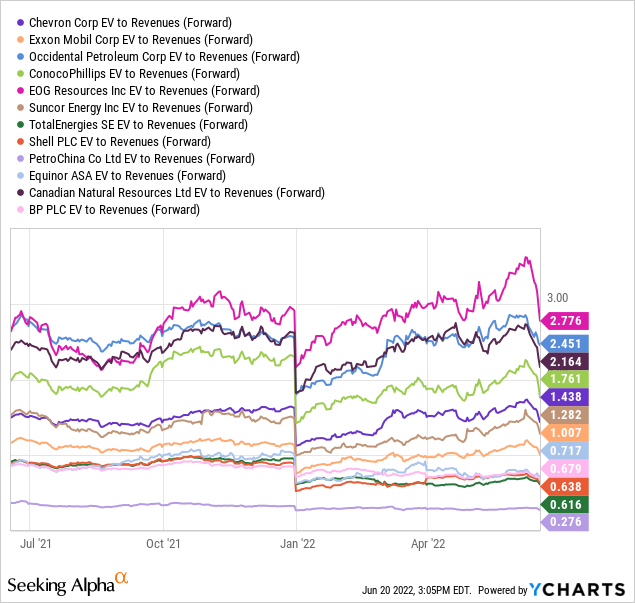
Believe it or not, Chevron’s current cash distribution yield is relatively average for the Big Oil sector. In addition, profit margins are today trending on the low end vs. peers, a result of massive downstream retail outlet revenue generation. CVX owns/leases 11,500 retail gas stations globally (8,200 in the U.S.), with 40% of oil/gas production originating domestically, and 5 refineries operating in America, 3 in Asia.
YCharts YCharts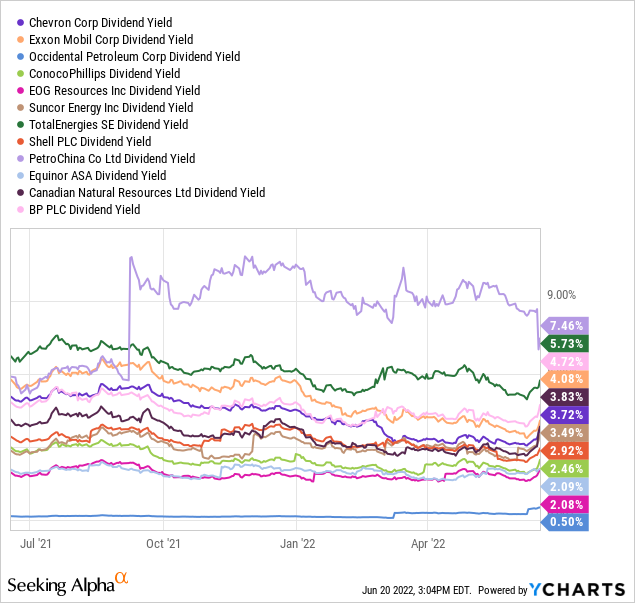
Free cash flow yield is bouncing near the bottom of the group for new investor capital, not exactly a situation to bet the farm on.
YCharts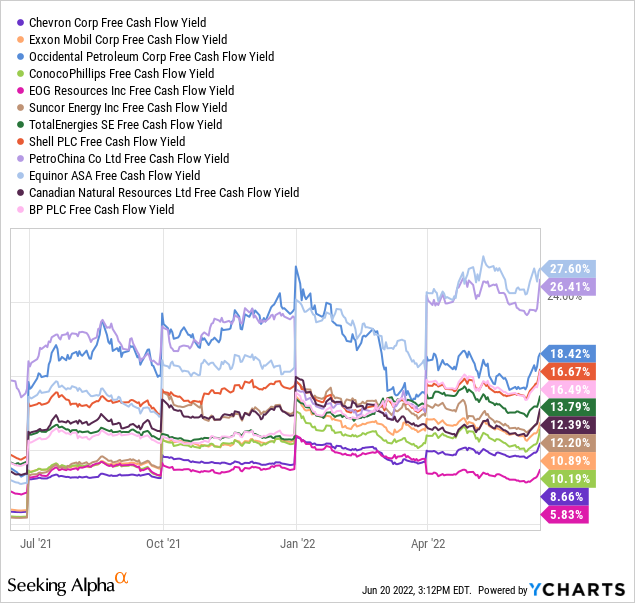
The saving grace, and perhaps the main reason CVX’s valuation is so high, revolves around a low liability balance sheet. In terms of total liabilities vs. reported assets, the company may have the easiest to cover debts and IOUs, assuming the energy market is peaking and begins a downcycle into 2023.
YCharts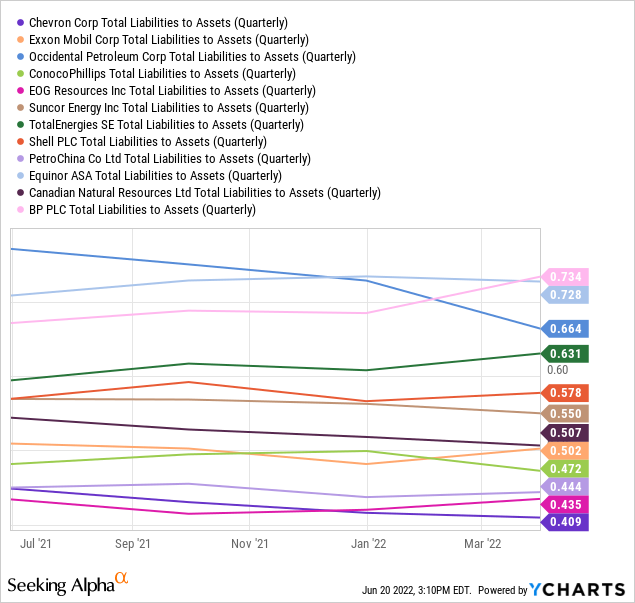
Momentum Peak – March 2022
On the 18-month chart of daily trading changes below, positive momentum and buying pressure clearly topped out in March. I have marked with a green arrow and several circles this breadth exhaustion, highlighted by some of my favorite momentum indicators. Price was able to zigzag higher for another few months, but the substantial drop last week really muddies the picture, and looks like a major reversal lower. If price cannot jump back over (and stay above) its important 50-day moving average during the summer, shareholders and bulls on the stock’s future should start getting nervous.
18-Month Chart, Daily Values with Author Reference Points – StockCharts.com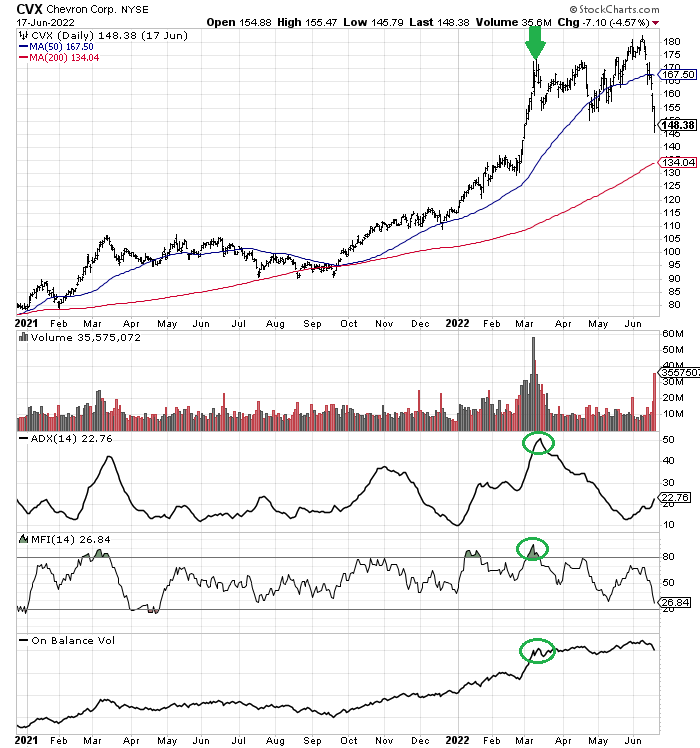
Final Thoughts
When all the financial information is reviewed and analyzed, Chevron is something of an average pick in the oil/gas sector. Buffett is attracted to CVX because of its large/diversified operations, amazing 36-year history of raising the dividend payout, and conservative balance sheet. Does this guarantee equity market outperformance the rest of 2022 and 2023? Absolutely not. In fact, I am quite worried an oversized price decline in crude oil and natural gas during a recession in America could torpedo the stock price back under $100.
A Yahoo! Finance story last week written by Myles Udland provides a level-headed summary of the stretched sentiment condition that has developed, with higher-than-normal risk in Big Oil names today:
The price of crude oil is up more than 60% this year. And a majority of the 266 investors surveyed by Bank of America Global Research think “black gold” is going to remain the year’s biggest winner.
In its latest Fund Manager Survey [early June], BofA found that 67% of respondents believe oil will produce the best returns this year. That’s up from 56% of investors who thought the same last month.
Michael Hartnett, global strategist at BofA who leads the survey, writes that this leaves “no doubt” about what the pain trade will be in the second half of this year — and that is lower oil prices.
Of course, any new turmoil in the Middle East that affects global oil supplies, or an extended Russian invasion into NATO-backed countries could keep the crude oil price above $100 another year. However, just as likely, a major worldwide downturn in demand from a recession, with incremental increases in oil pumped out of the ground could send oil/gas prices back to 2021 levels by year’s end.
If a windfall tax on Big Oil is passed, Chevron’s lower-margin integrated operations could plummet into a net 5-7% profit range vs. exploration & production only enterprises in an adjusted 10-20% area. This wildcard government action would be very bearish for the stock’s valuation, in my opinion.
To me the potential risks owning CVX are not worth today’s weakening reward setup, especially with everyone expecting further energy price gains, fully invested in the sector. I rate Chevron a Hold for stubborn investors, an Avoid for new capital allocations, and a Sell for speculators with less than a 2-year investment horizon. My 12-month price target of $110-$120 uses $80/barrel crude oil and $4 MMBtu natural gas as long-term assumptions. Not the end of the world for Buffett or Big Oil investors, but still outlining a negative total return on investment from $148.
There will come a day I turn bullish on the petroleum industry again, but it could take a year or two and dramatically lower oil/gas quotes. Sorry to be the bearer of bad news for overenthusiastic traders and shareholders.
Thanks for reading. Please consider this article a first step in your due diligence process. Consulting with a registered and experienced investment advisor is recommended before making any trade.
Be the first to comment