

Justin Sullivan
Introduction
Chevron Corporation (NYSE:CVX) released its third quarter of 2022 on October 28, 2022.
Note: I have followed CVX quarterly since 2017. This new article is a quarterly update of my article published on June 9, 2022.
1 – 1Q22 Results snapshot
CVX reported adjusted first-quarter earnings per share of $5.56, beating analysts’ expectations due to robust commodity prices and product margins.
It compares to a profit of $2.96 per share in the year-ago period. The company generated record revenues of $66.64 billion in 3Q22 compared to $44.71 billion in 3Q21, an increase of 49% year over year.
Chevron’s upstream segment registered a profit of $9.307 billion in the third quarter of 2022, compared to $5.135 billion earned in the year-ago period.
The U.S. oil equivalent output was up 4.3% year-over-year to 1,176K Boepd, and the company’s international operations (representing 61% of the total) dropped by 2.9% to 1,851K Boepd (more details later).
Note: I am a long-term CVX shareholder, one of my selected senior oil companies, offering a 3.14% dividend yield.
CEO Michael Wirth talked about renewables in the conference call:
We continue to see a challenging and dynamic macroeconomic and geopolitical environment. Current events highlight the importance of balancing economic prosperity, energy security and environmental protection. In line with these 3 imperatives, Chevron remains focused on our objective to safely deliver higher returns and lower carbon.
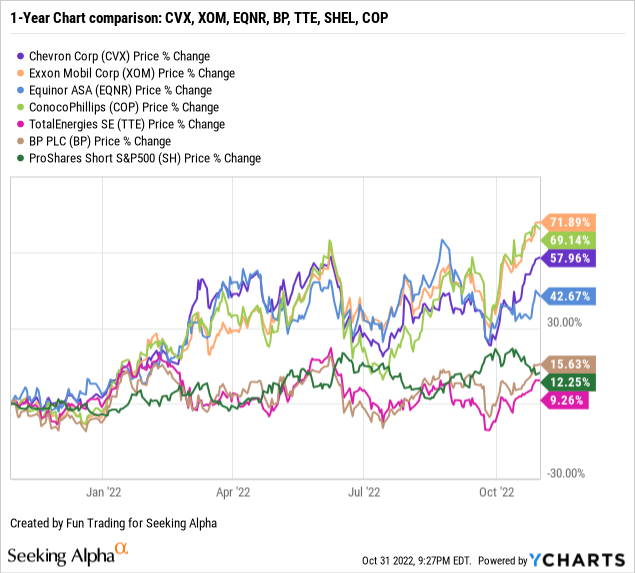
2 – Stock performance
The stock performance has improved significantly on a one-year basis. The stock is up 58%, lagging slightly behind Exxon Mobil (XOM) and ConocoPhillips (COP), up around 70%. The U.S. majors are outperforming their European peers significantly, as shown in the chart below:
3 – Investment Thesis
The investment thesis remains the same quarter after quarter. CVX has been one of my most significant holdings in this category with Exxon Mobil, Shell plc (SHEL), and TotalEnergies SE (TTE).
Oil supermajors are the best long-term choice to profit from the oil industry. They pay a secure dividend of around 3% to 4% and generate a massive free cash flow that will allow them to cut their debt to a healthy level and invest in growth CapEx.
However, CVX increased to new highs recently and seemed nearly overbought based on the RSI. In fact, the entire oil industry appears to show signs of overheating after a stellar earnings season.
So, I do not recommend adding to your position now. Instead, it is perhaps time to take some partial profits, as I suggested with Exxon Mobil a few days ago. Around 25% seems reasonable. It will allow you to buy back on any significant retracement. As this Reuters article suggests, those stellar profits may trigger some adverse reactions.
U.S. oil executives have been loath to crow about this year’s earnings gains – surpassing the once-sizzling tech sector – preferring to emphasize investment commitments. But soaring profits are feeding criticism in the United States and Europe as inflation climbs.
Remember that being long doesn’t necessarily mean you should not trade a part of your position. In fact, trading short-term such a company is crucial and will reward you much more than the dividend you receive and tend to shield you from any abrupt change in trend due to an unexpected event of a kind that tends to recur regularly in the oil sector.
Remember, a paper profit can disappear quickly, and it is vital to allocate precious time to evaluate the risks and adopt a balanced strategy. One solution is to trade the short-term using about 30% LIFO of your long position. It is what I recommend in my marketplace, “The Gold and Oil Corner.”
Chevron Corp.: Financials Table 3Q22: The Raw Numbers
| Chevron Corp | 3Q21 | 4Q21 | 1Q22 | 2Q22 | 3Q22 |
| Revenues in $ Billion | 42.55 | 45.86 | 52.31 | 65.37 | 63.51 |
| Total Revenues and other income in $ Billion | 44.71 | 48.13 | 54.37 | 68.76 | 66.64 |
| Net income in $ Billion | 6.111 | 5.055 | 6.259 | 11.62 | 11.23 |
| EBITDA $ Billion | 12.57 | 12.02 | 12.98 | 19.93 | 19.14 |
| EPS diluted in $/share | 3.19 | 2.63 | 3.22 | 5.95 | 5.78 |
| Cash from operating activities in $ Billion | 8.58 | 9.46 | 8.06 | 13.78 | 15.27 |
| Capital Expenditures in $ Billion | 1.91 | 2.61 | 1.96 | 3.18 | 3.00 |
| Free Cash Flow in $ Billion | 6.67 | 6.85 | 6.10 | 10.60 | 12.27 |
| Total cash $ Billion | 6.03 | 5.68 | 11.70 | 12.37 | 15.43 |
| Total debt in $ Billion | 37.35 | 31.37 | 29.33 | 26.24 | 23.64 |
| Dividend per share in $ | 1.34 | 1.42 | 1.42 | 1.42 | 1.42 |
| Shares outstanding (diluted) in Billion | 1.92 | 1.92 | 1.94 | 1.96 | 1.94 |
| Oil Equivalent Production | 3Q21 | 4Q21 | 1Q22 | 2Q22 | 3Q22 |
| Oil Equivalent Production in K Boepd | 3,034 | 3,117 | 3,060 | 2,896 | 3,027 |
| Oil U.S. Upstream including Permian K Boepd | 1,127 | 1,216 | 1,184 | 1,172 | 1,176 |
| Permian only K Boepd | 623 | 681 | 692 | 696 | 702 |
| Total liquid price $/Boe US | 57.81 | 63.33 | 76.60 | 88.71 | 75.75 |
Sources: The company’s released supplement.
Analysis: Revenues, Earnings Details, Free Cash Flow, Debt, And Upstream/Downstream Production
1 – Quarterly revenues and other income were $66.64 billion in 3Q22
CVX Quarterly revenues history (Fun Trading)
The adjusted earnings were $10.8 billion, or $5.56 per share. The net income was $11,231 million compared to $6,111 million last year. Below are the 3Q22 highlights from the company presentation.
CVX 3Q22 highlights (CVX Presentation)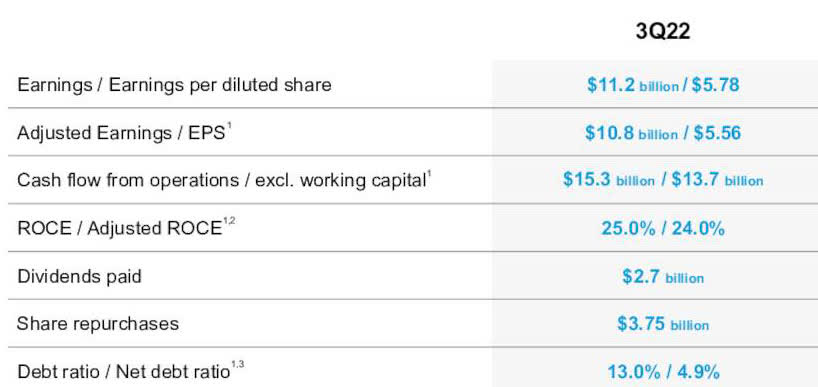
Adjusted upstream earnings increased mainly on higher realizations partially offset by inventory timing impacts. In Other, tax benefits are more than offset by higher operating expenses and other costs. Adjusted Downstream earnings increased primarily on higher refining margins and favorable inventory timing impacts. The planned turnaround at our Richmond refinery was a driver of higher OpEx and lower volumes for the period. In Other, lower chemicals earnings were partly offset by higher trading gains.
Earnings details and trend
| CVX Earnings repartition in $ billion | 3Q21 | 4Q21 | 1Q22 | 2Q22 | 3Q22 |
| Upstream | 5.14 | 5.16 | 6.93 | 8.56 | 9.31 |
| Downstream | 1.31 | 0.76 | 0.33 | 3.52 | 2.53 |
| Other | -0.33 | -0.86 | -1.01 | -0.46 | -0.61 |
Source: CVX filing. Fun Trading.
2 – Free cash flow (not including divestitures) was $12.27 billion in 3Q22
CVX Quarterly Free cash flow history (Fun Trading)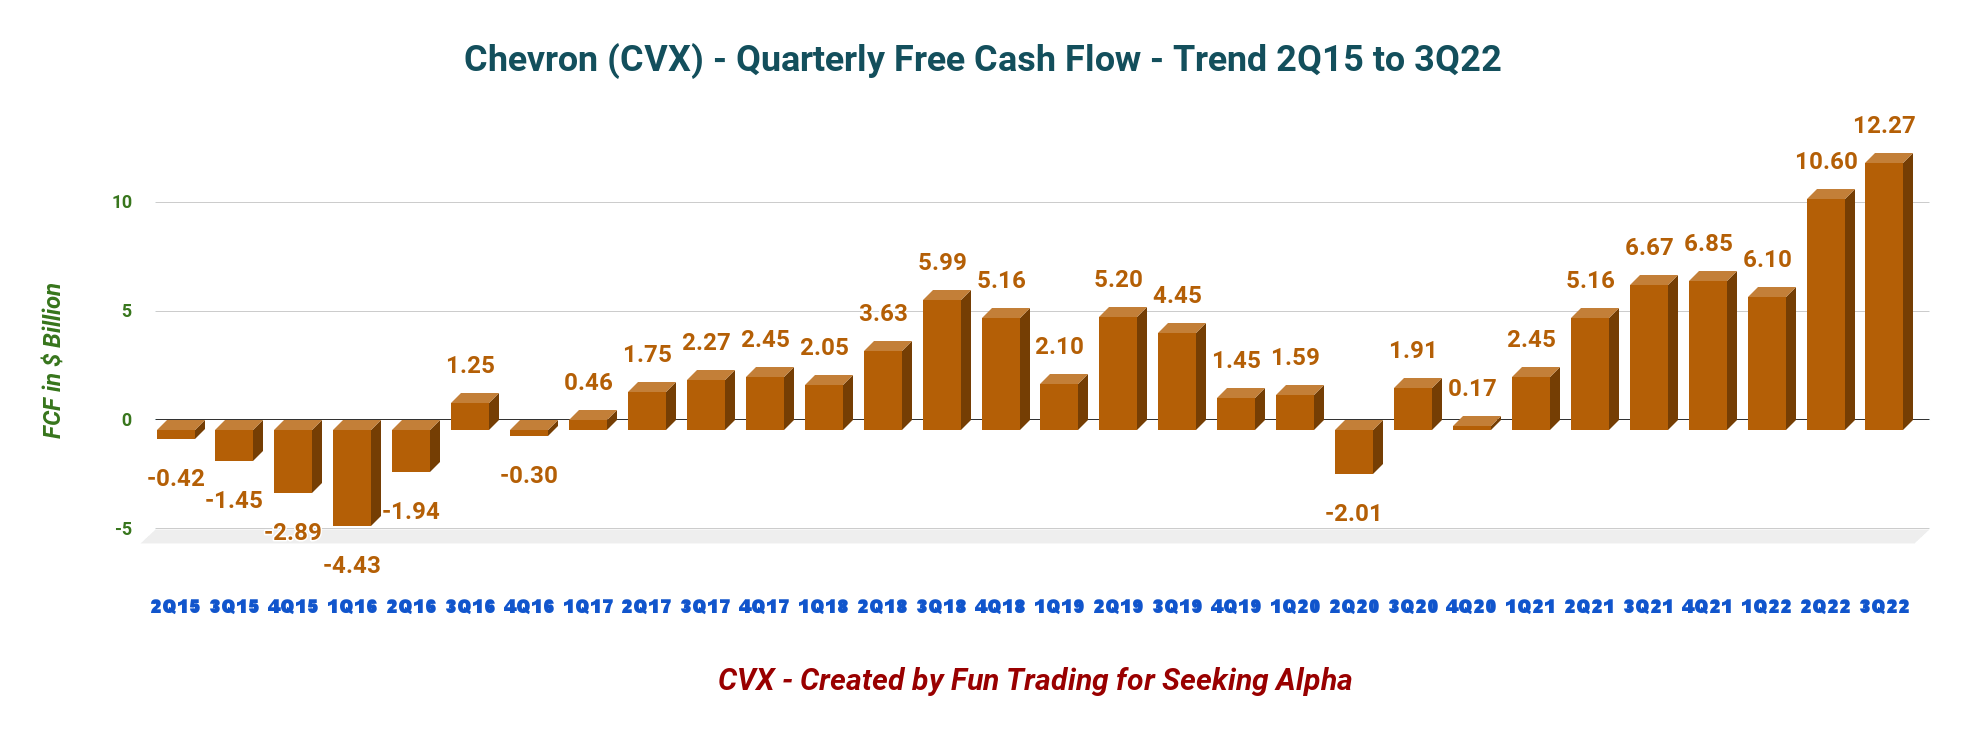
Chevron’s trailing 12-month free cash flow was $35.817 billion (excluding divestitures). The company’s free cash flow for the third quarter was $12.272 billion, up from $6.672 billion in the same quarter a year ago. Please look at the chart above.
The annual dividend is $5.68 per share and is based on 1.940 billion shares outstanding diluted. Dividend cash costs are now $11 billion per year, which may indicate that CVX will increase the dividend by about 5+% next year, or about $1.50 per share.
The dividend yield is now 3.14%. CVX bought back $1.3 billion worth of CVX shares this quarter.
CFO Pierre Breber said in the conference call that share buyback ($15 billion a year) would be prioritized in 4Q22.
3 – Net Debt is down to $8.21 billion in 3Q22
CVX Quarterly Cash versus Debt history (Fun Trading)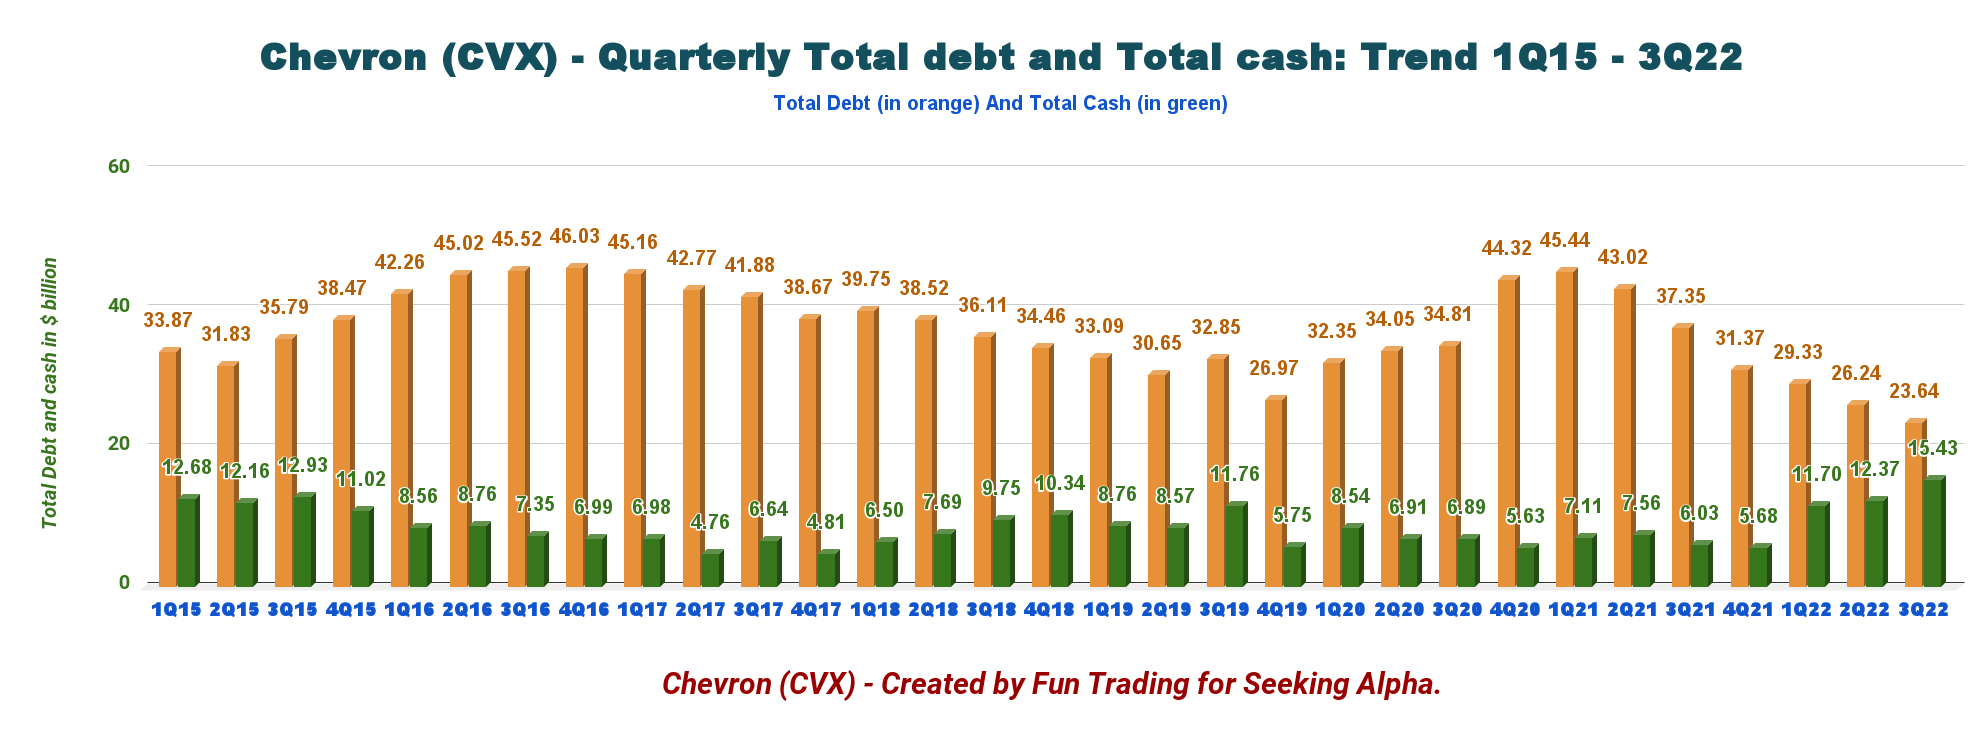
4 – Upstream Details
CVX Quarterly Oil Equivalent Production history (Fun Trading)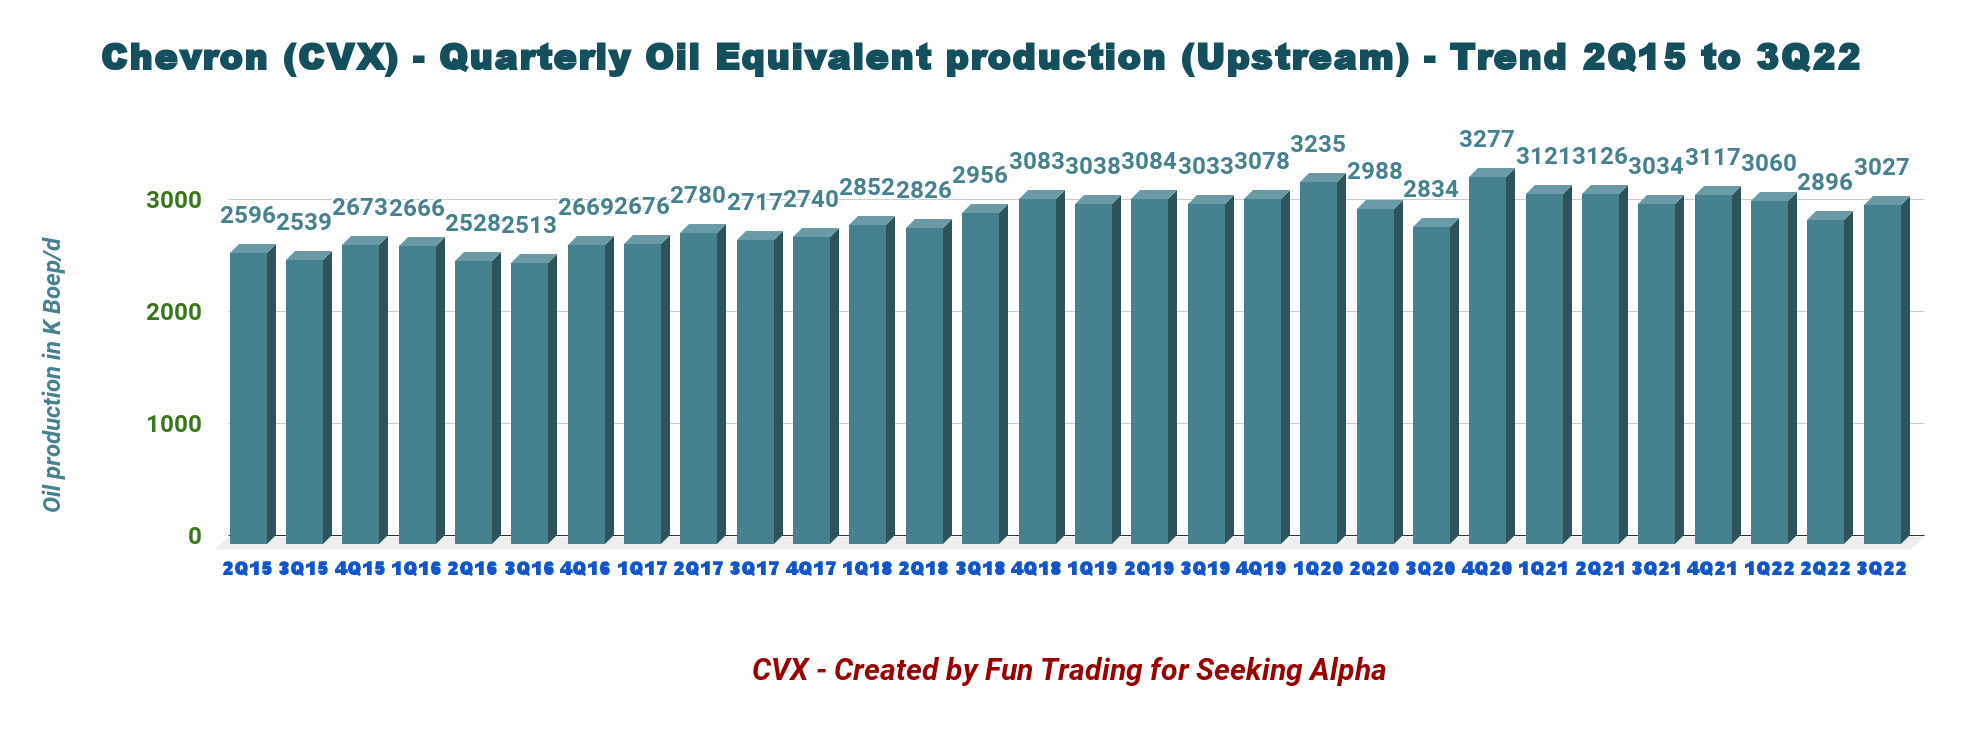
The U.S. upstream reached 1,176K Boepd, or 38.9% of the total output (see chart below).
Despite volumes remaining nearly unchanged from last year, Chevron’s upstream segment recorded a profit of $9.3 billion in 3Q22, an increase from the $5.1 billion made in the year-ago period.
The U.S. upstream production history is shown below.
CVX Quarterly US Production history (Fun Trading)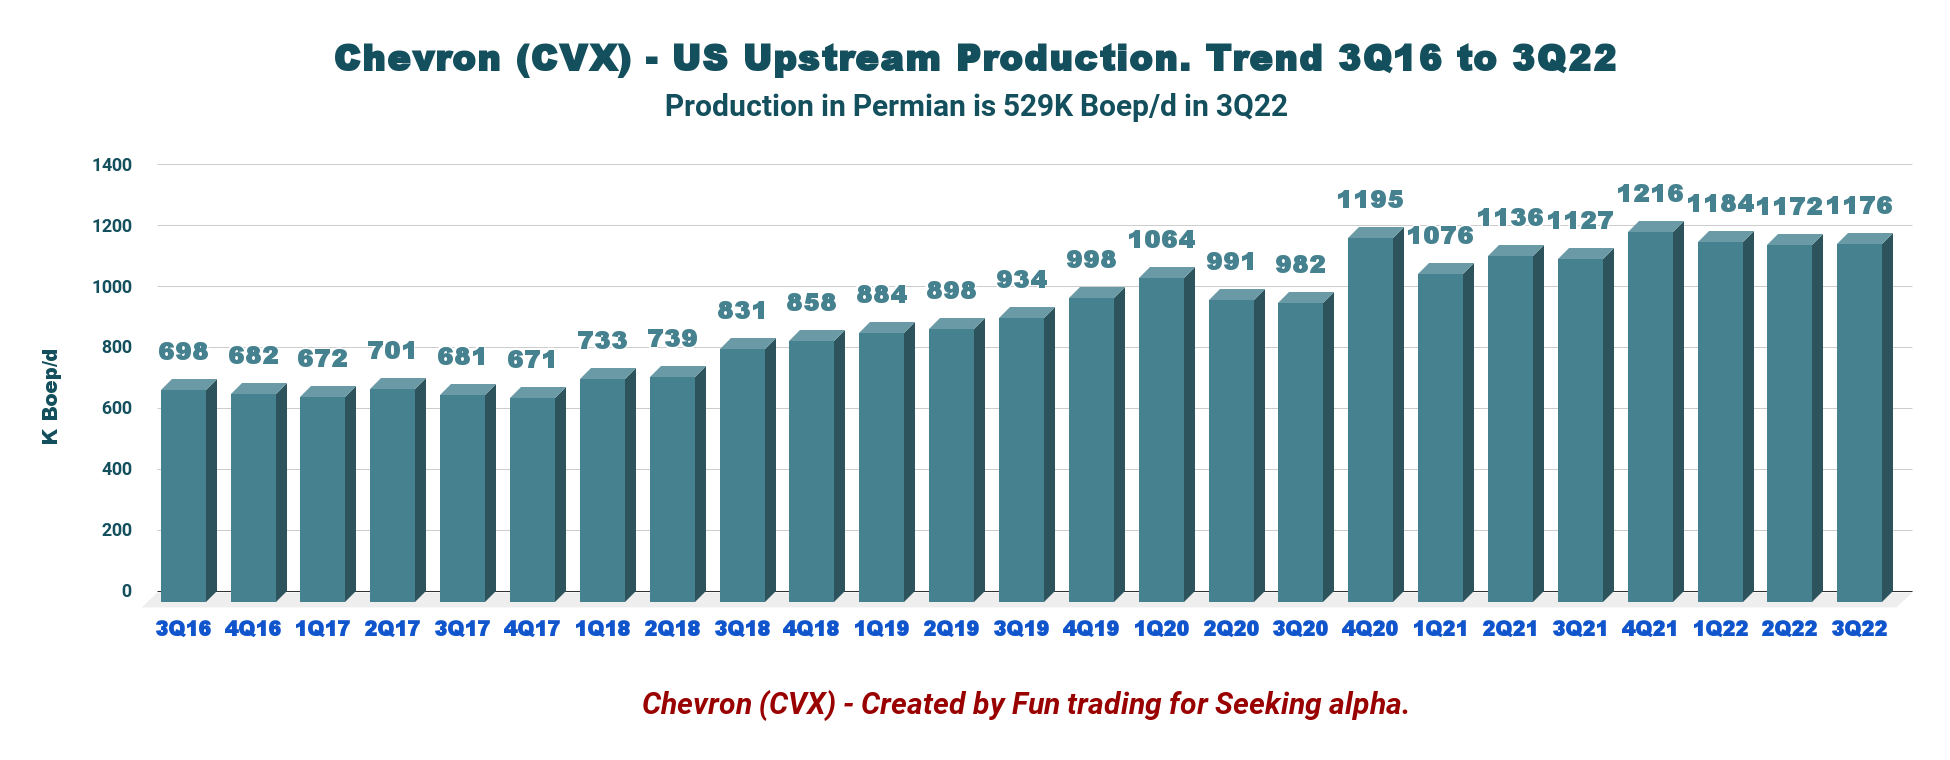
5 – Production: Discussion Per Segment
5.1. Upstream
- The Permian output was 702K Boep/d in 3Q22, up from 623K Boep/d produced in the same quarter last year. It is a new record.
CVX Quarterly Permian Production history (Fun Trading) The U.S. production was up 4.3% year over year to 1,176K Boep/d, and the company’s international operations (accounting for 61.1% of the total) were 1,851K Boepd. Chevron enjoyed solid oil and gas prices this quarter but has retreated from the record high indicated in 2Q22. Liquids in the USA reached $75.73 per Boe, and liquids international settled at $89.14. CVX Quarterly US Liquid price realized history (Fun Trading)

5.2 – Downstream
Chevron’s downstream segment registered a profit of $2.5 billion in 3Q22, nearly doubling last year’s profit of $1.3 Billion.
The progress resulted from higher product sales margins and strong jet fuel demand following the continued easing of pandemic restrictions.
6 – 4Q22 Guidance
CVX 4Q22 outlook (CVX Presentation)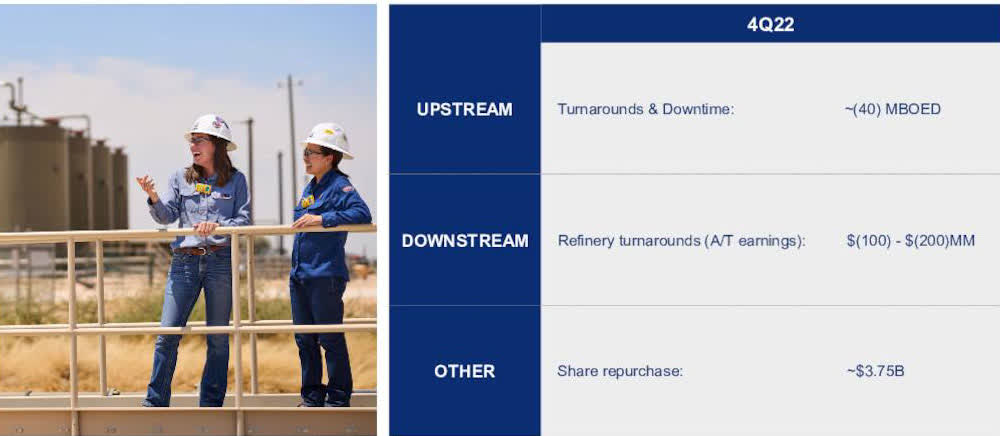
CVX expects to end 2022 at the end of its full-year guidance.
In the 4Q22, CVX will pay $700 million with the early termination of the long-term LNG regas contract at Sabine Pass.
The company expects to buy back about $2.5 billion for share repurchase in 4Q22 at the top of the range.
Technical Analysis And Commentary
CVX TA Chart short-term (Fun Trading StockCharts)
Note: The chart is adjusted for the dividend.
CVX forms an ascending wedge pattern with resistance at $183.25 and support at $177.3. Rising or ascending wedge patterns are bearish chart patterns that signal a looming breakout to the downside. It is even more evident with the RSI (14) now at 76.
Thus, the short-term trading strategy is to trade LIFO about 25%-35% of your position. I suggest selling between $183 and $185 and waiting for a retracement below $177.5 to consider buying and accumulating again.
If oil prices turn south due to some de-escalation of the Ukraine war or a fall in demand for oil due to a recession, I see CVX dropping quickly to $167.
Thus, I strongly recommend trading LIFO as a good part of your position to take advantage of the wild swings that will rock the oil world in 2023.
As I said earlier, being a long investor doesn’t prevent you from taking partial profits when the market is about to reach an unsustainable level.
Note: The LIFO method is prohibited under International Financial Reporting Standards (IFRS), though it is permitted in the United States by Generally Accepted Accounting Principles (GAAP). Therefore, only U.S. traders can apply this method. Those who cannot trade LIFO can use an alternative by setting two different accounts for the same stock, one for the long term and one for short-term trading.
Warning: The TA chart must be updated frequently to be relevant. It is what I am doing in my stock tracker. The chart above has a possible validity of about a week. Remember, the TA chart is a tool only to help you adopt the right strategy. It is not a way to foresee the future. No one and nothing can.
Author’s note: If you find value in this article and would like to encourage such continued efforts, please click the “Like” button below to vote of support. Thanks.
Be the first to comment