

DOERS/iStock via Getty Images
Thesis
We use the following market sector dashboard to put our finger on the pulse of the market (BTW, feel free to download the Google sheet via the following link: Market Sector Dashboard). And what we’re seeing now is the energy sector represented by the Energy Select Sector SPDR Fund (NYSEARCA:XLE) is the most attractive sector currently. As a matter of fact, after the recent interest rate hikes, the energy sector is the only sector with a positive dividend spread Z-score among all the major sectors now. It currently features a positive dividend yield spread Z-score of 0.17 as seen. And even the next most attractively valued sector, the small caps, featured a quite negative dividend yield spread Z-score of -0.87.
The sector currently is supported by both long-term tailwinds and also near-term catalysts. As a direct signal of the strong fundamentals, the sector fund XLE just increased its quarterly dividend to $0.846 per share in September, a whopping 43% YoY increase from 0.592 last year. It’s the largest dividend increase among all the sector funds in the dashboard. And the next largest one is the REIT sector, represented by Vanguard Real Estate Index Fund (VNQ). VNQ raised its quarterly dividend in September by 39% YOY.
Looking forward, I don’t see oil prices stabilizing at ~$80. I see plenty of catalysts will move the price up and continue providing strong tailwinds for the energy sector. As to be detailed in the remainder of this article, these catalysts include the need to replenish the strategic petroleum reserve, inflation, the imbalance in oil and natural gas supply-demand, and also the winter heating needs.
Sometimes, a sector is made attractive (or unattractive) by one or two stocks that have disproportionate weights. However, it’s not the case here. We have examined several of the leading stocks in XLE in our past articles such as Exxon Mobil (XOM) and Suncor Energy (SU). Our conclusion is that they’re all attractive.
And today, we will focus on another lead component stock in the XLE fund. And you will see that Chevron Corp (NYSE:CVX) too is attractively valued, enjoys strong profit drivers, and presents outstanding return potentials.
Source: Author based on Seeking Alpha data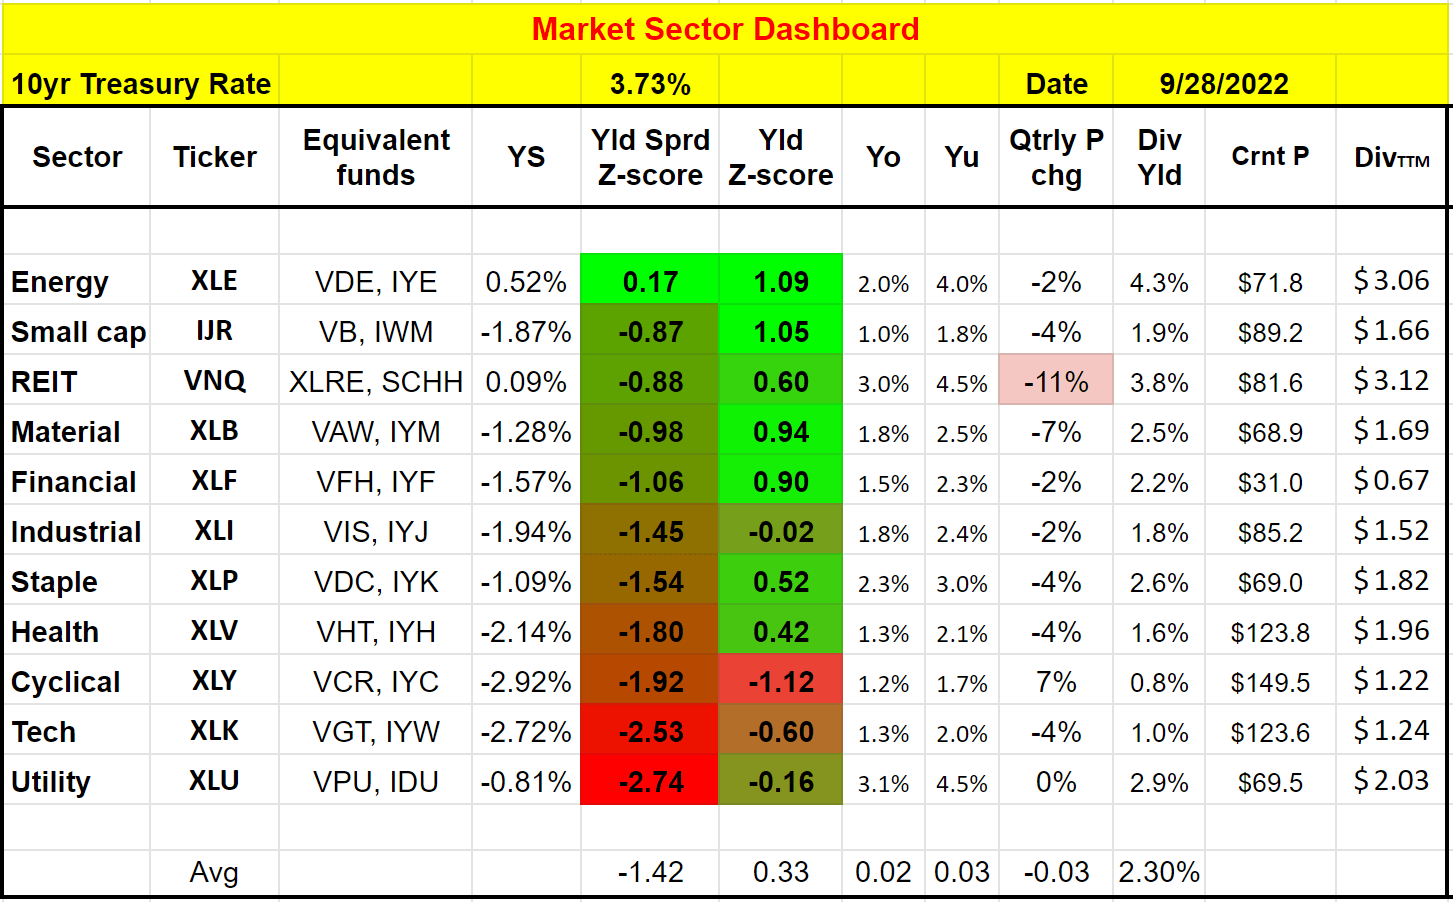
XLE and CVX: The fund and its leader
CVX is the second largest holding in the XLE fund, representing 20.03% of its total assets as you can see. It’s a close second, only about 3.7% behind the largest holding XOM. Combined, these two largest holdings represent more than 43% of the fund.
Source: Yahoo data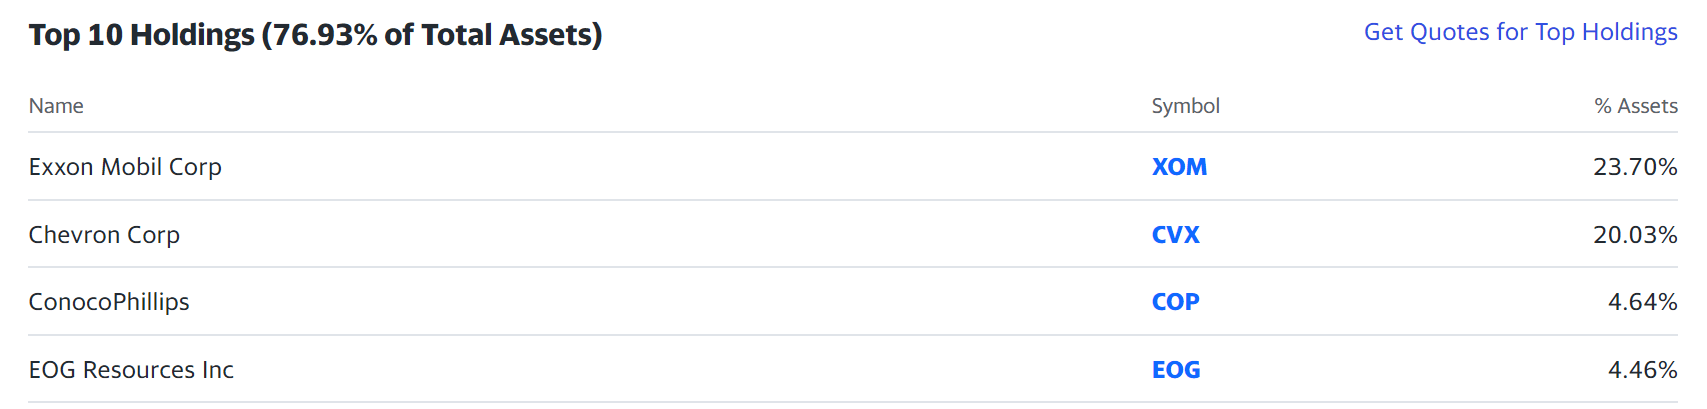
As you can see from the next two charts, compared to CVX, the Energy sector (represented by XLE) is somewhat a diworsification. The financial information used in the first chart was taken from Yahoo Finance or Seeking Alpha in the a.m. of Sept. 28, 2022. Given the market volatility, these numbers might have changed when you read this article. A few highlights from this comparison:
- CVX provides superior profitability over XLE. Its operating margin is 19.1%, almost 40% higher than XLE. And its ROCE (return on capital) employed is 15.4%, about 10% above XLE’s 14.1%.
- Yet CVX is for sale at a large valuation discount from the sector. Its price-to-cash flow ratio is at a 48% discount from the sector average, PE at a 33% discount, and Price/sales ratio at a 28% discount (despite the fact that its margin is 40% above the sector).
- Finally, CVX also offers better consistency and lower volatility. CVX has been consistently and continuously growing its dividends for 34 years. And as you can see from the second chart, compared to XLE, CVX suffered substantially lower worst year performance and also maximum drawdown compared to the fund. To wit, CVX’s worse performance has been -26%, more than 13% better compared to XLE’s 39%. And its worse drawdown has been about 41%, again about 13% better than XLE’s 64%.
Next, I will elaborate on the catalysts. And you will see that these catalysts are valid for both the whole energy sector and also CVX (and that is why I’m bullish on the entire sector and also CVX). But given the considerations above in terms of profitability, valuation, and consistency, I feel more strongly about CVX.
Source: Author based on Yahoo and Seeking Alpha data Source: Portfoliovisualizer.com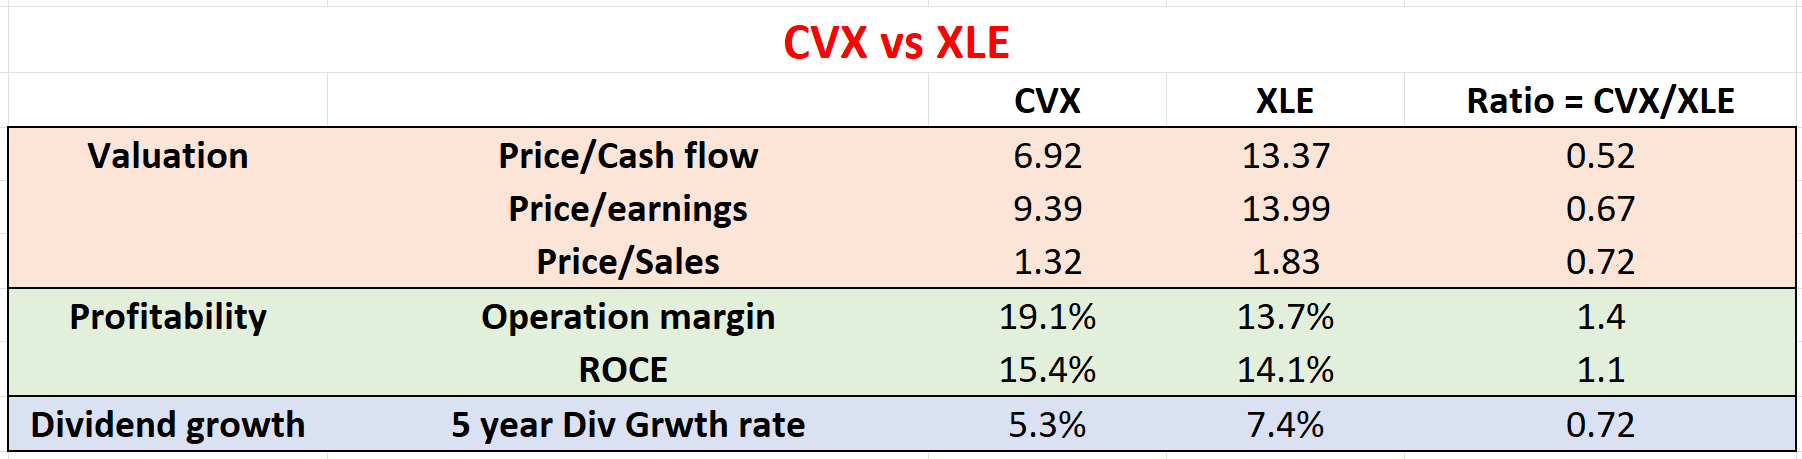

Catalysts 1: Strategic petroleum reserve
The first catalyst that I see is the U.S.’s need to replenish the strategic petroleum reserve (“SPR”). On March 31, 2022, President Biden decided the release one million barrels of crude oil a day for six months from the SPR to fight higher oil and gasoline prices. After the release, the SPR is at a current level of 427M barrels as of this writing. To put things under perspective, the SPR level was 434 M a week and 620 M one year ago before the release. It peaked at over 726 million barrels in 2010 as you can see from the chart below. The current level is the lowest since 1984.
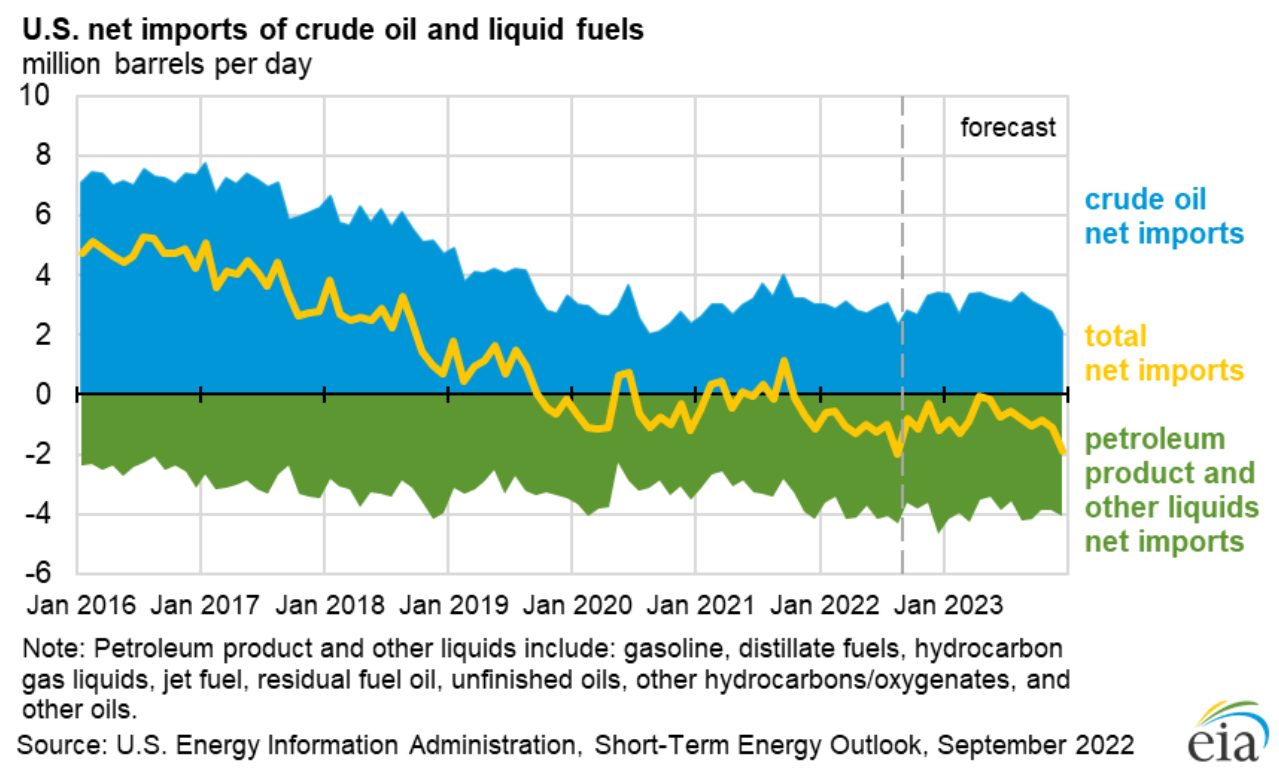
Depleting the SPR obviously is only meant to be a short-term fix. And at some point – and I’m sensing that point is approaching soon given the record-low SPR level – the U.S. will have to reverse course and start replenishing the SPR. However, replenishing won’t be easy under the current conditions. What can be used to refill the SPR can only come from two sources. The first source is the import and unfortunately, our import currently is at a net negative level as seen from the second chart below.
The second source is the surplus (if any) between what the U.S. produces and what it uses, which does not look promising either as to be elaborated on next.
Source: EIA data Source: EIA data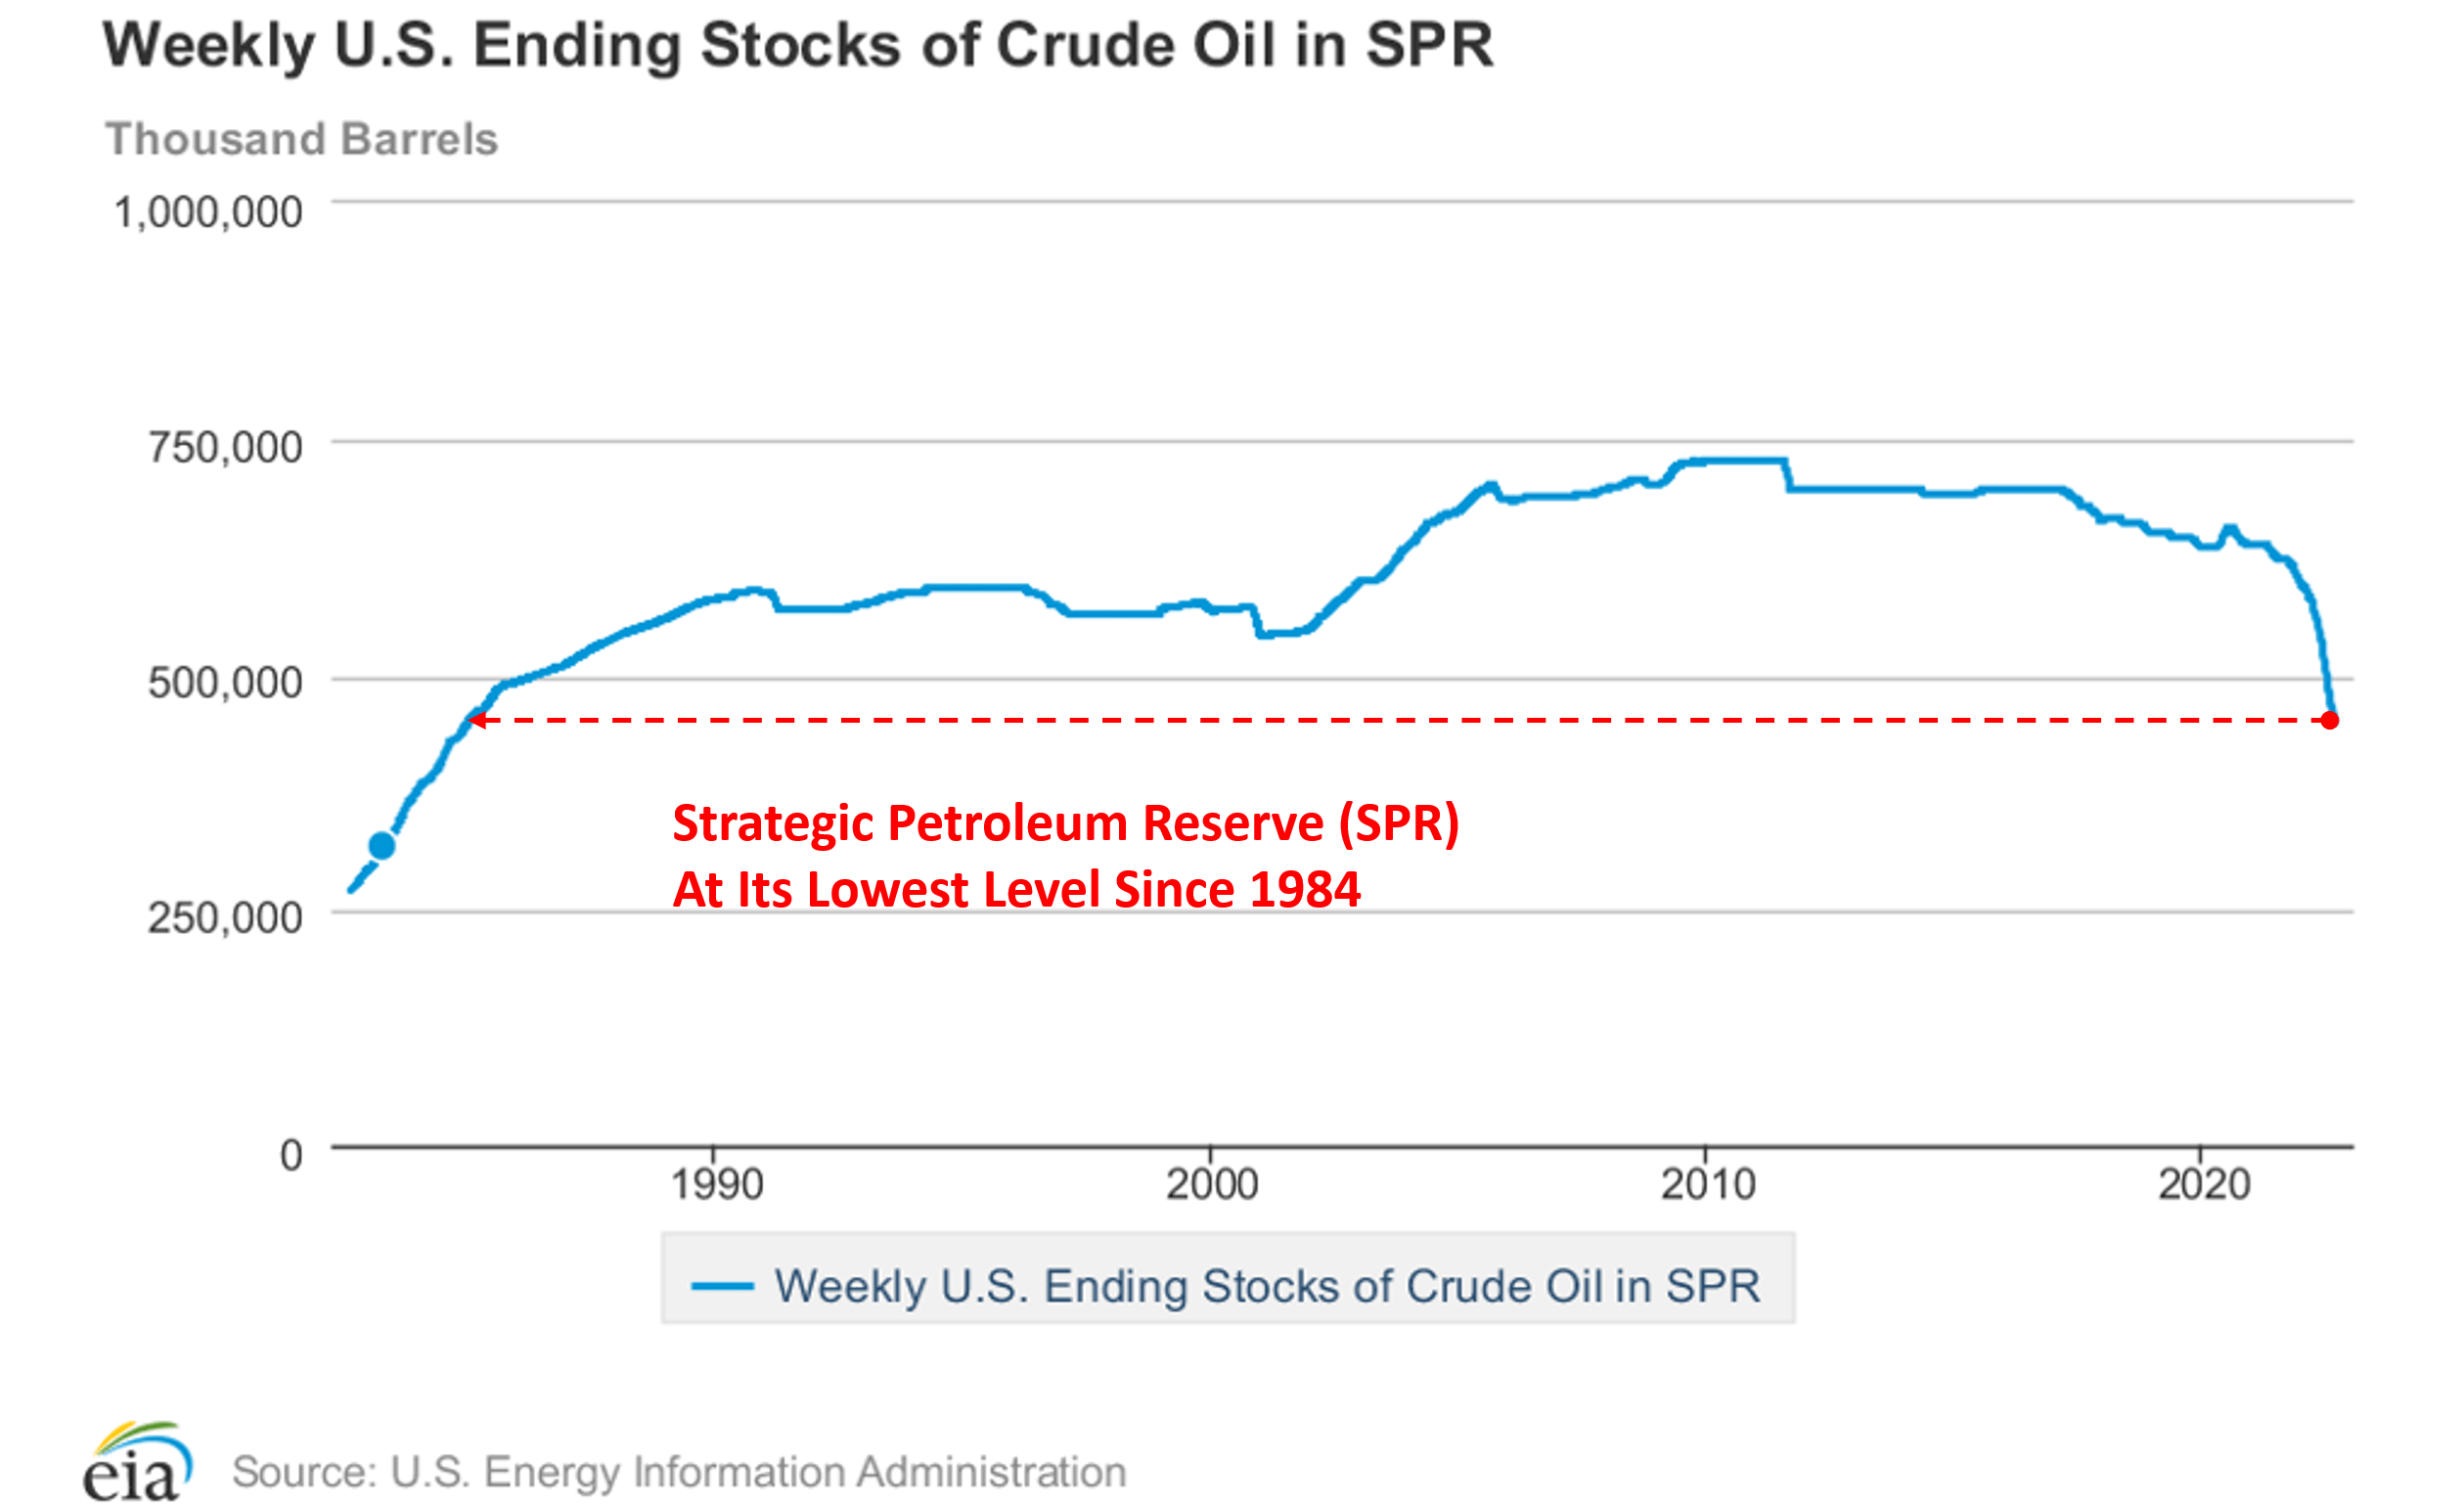
Catalyst 2: Supply-demand imbalance
As repeatedly argued in my earlier articles, the current shortage in the oil and gas industry is a structural problem. The problem was accumulated over years because of the underinvestment in our critical infrastructure in the energy sector. And now the Russian/Ukraine situation further exacerbated the shortage.
You can see the formation and also the magnitude of the problem in the chart below. The chart shows the US domestic crude oil inventory on a weekly basis and the chart is made based on Ycharts data. You can see that the inventory has more or less hovered stably around the 1 billion barrels before 2021. It peaked in 2020 at around 1.2 billion barrels. Then it started a sharp and one-way decline from there. Currently, the US crude oil inventory is at a level of 853 M barrels. It’s down from 857.93M last week by -0.56%, and down from 1.034B one year ago by more than -17.4%.
Such a sharp decline in inventory, to me, is a clear signal of the supply/demand imbalance. And as mentioned, as the U.S. starts to refill the SPR, there would be one more buyer (a pretty large buyer) on the demand side, further exacerbating the imbalance.
Source: YCharts data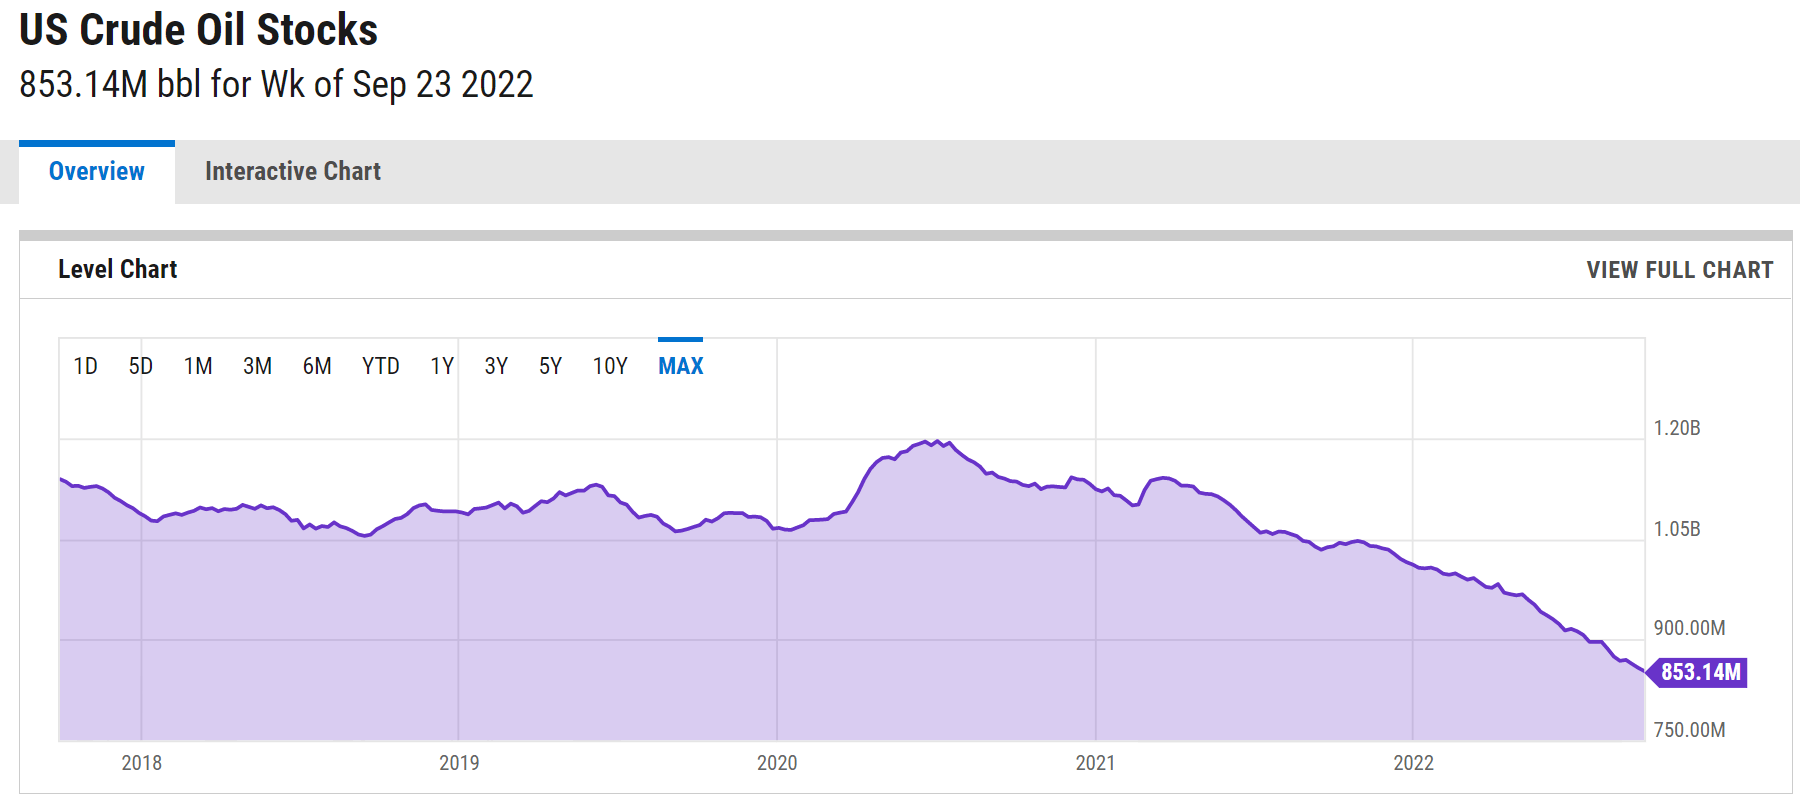
Other catalysts
As argued in my earlier article, inflation is another major catalyst for an oil price rally. More specifically,
I expect oil and gas prices to at least keep up with inflation in the long term. The nominal oil prices over the past 50+ years have been rising at 5.9% CAGR. Over this same period of time, inflation has been 3.9% CAGR on average. So as a result, oil prices have consistently beaten inflation by a whole 2%. But the crude oil price is now where it was eight years ago even after its recent surges. As a result, a rally in oil prices is overdue. The oil prices have more catch-up to do in the future. It should be at about $130 now to just make up the inflation in the past decade or so.
All told, U.S. Energy Information Administration (“EIA”) recently published its 2022 Annual Energy Outlook. This report projects the Brent crude oil price to reach $90 as a base case (in terms of constant 2021 dollars). Assuming inflation of 2.5% per year, a $90 price translates to $180 per barrel, compared to the current $80 level.
Finally, do not forget about natural gas (“NG”). This EIA report mentioned several factors that have contributed to the NG price surges, such as colder temperatures, electric power generation, and the demand for liquefied natural gas (“LNG”) exports to Europe to replace Russian supplies. These factors have kept NG inventory currently at a low as well.
Source: Author based on Yahoo data
Risks, expected returns, and final thoughts
Both CVX and the energy sector also face some risks, both in the near term and long term. In the near term, both CVX and XLE face considerable volatility risks due to commodity prices and geopolitical tensions due to the Russian/Ukraine war. Although if you recall from an earlier chart, CVX has suffered lower volatility risks both in terms of the worst year drawdown and the worst performance since the inception of the XLE fund. In the longer term, climate and environmental concerns are risks for CVX and XLE as well. Both CVX and XLE could be negatively impacted by lawsuits, government regulations, and tax laws.
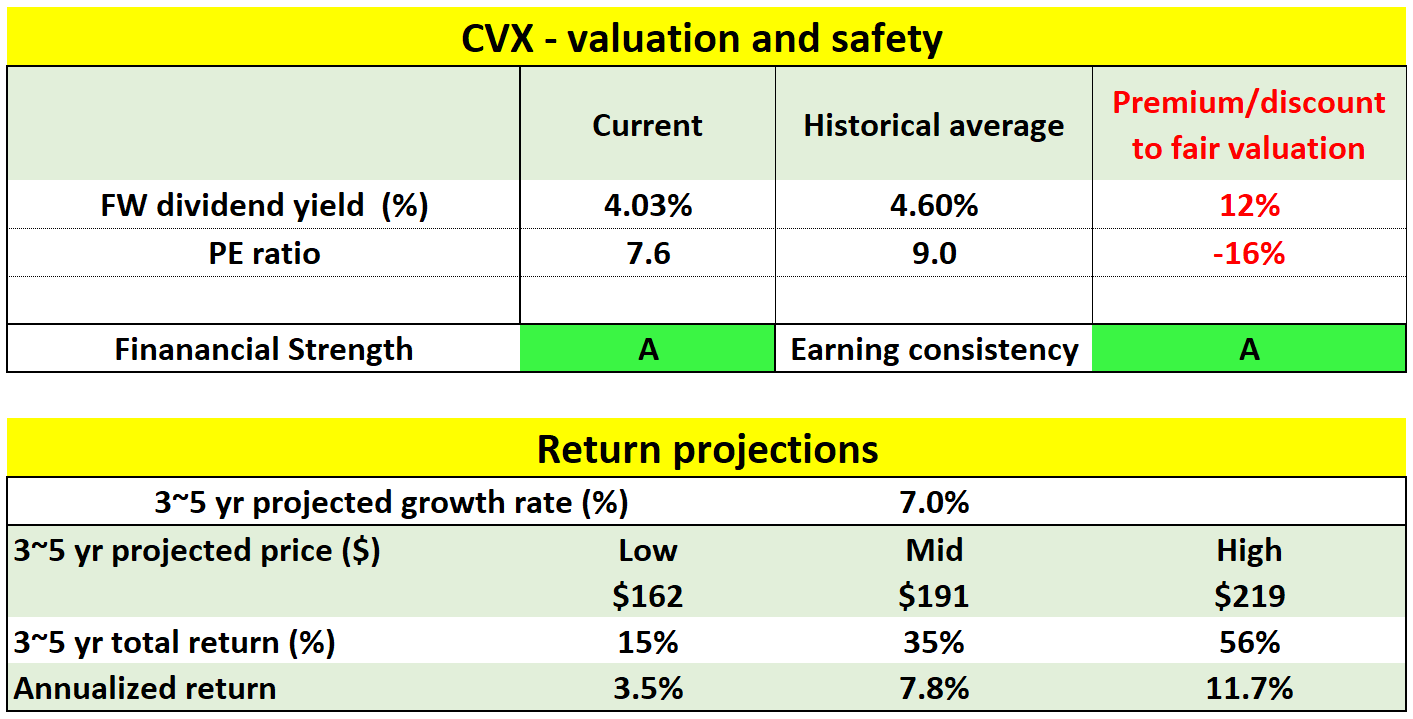
To conclude, I don’t see oil prices stabilizing near $80. Instead, I see a multitude of catalysts both in the near term and also in the long term to drive oil prices up, substantially up, from the current level. These catalysts include the need to replenish the strategic petroleum reserve, the supply and demand imbalance accumulated over years, a declining inventory of both oil and natural gas, and also inflation. In the past, CVX has delivered higher total returns than XLE. If you recall from an early chart, CVX delivered 9.75% of annual return since 1998 when XLE was launched, outperforming XLE by more than 275 basis points per year. Given the superior profitability and consistency, I foresee that CVX’s outperformance over XLE to continue into the future too. Combined with their current valuation, I see an asymmetric return profile for both CVX and XLE as shown in the chart below. In the case of XLE, the upside is substantial (54% in the next 3~5 years) and the downside is limited (a loss of about 10%). And the return profile of CVX is even more skewed as seen from the second chart below.
Source: Author based on Yahoo and Seeking Alpha data Source: Author based on Yahoo and Seeking Alpha data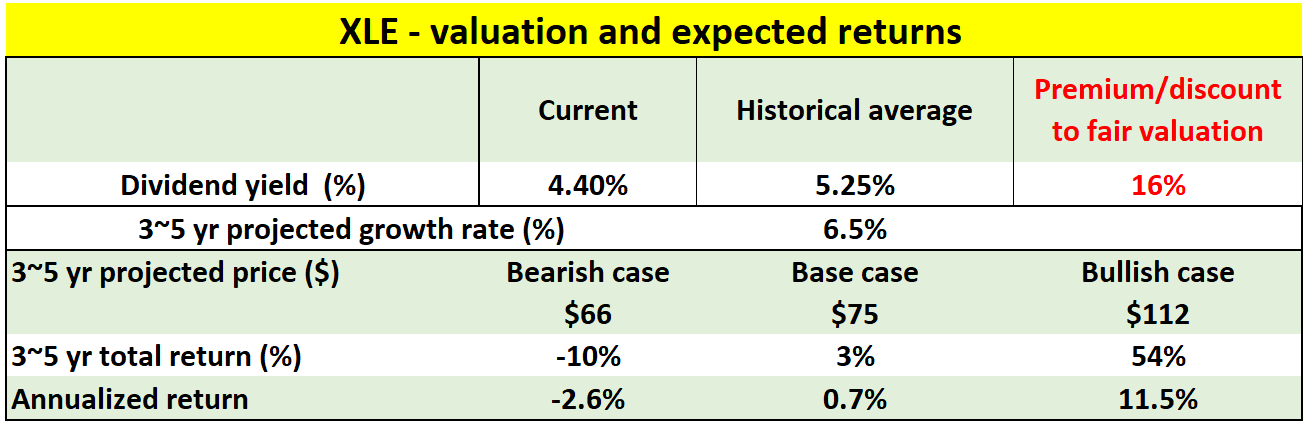
Be the first to comment