

photosbyjim
Introduction
Oklahoma City-based Chesapeake Energy Corporation (NASDAQ: NASDAQ:CHK) announced its second quarter of 2022 on May 4, 2022.
Note: This article is an update of my article published on June 19, 2022. I have followed CHK on Seeking Alpha since Dec. 2019.
CHK is an essential oil & gas exploration and production company producing assets in the prolific Marcellus, Haynesville, Powder River, and Eagle Ford shale plays.
CHK Map Presentation (CHK Presentation)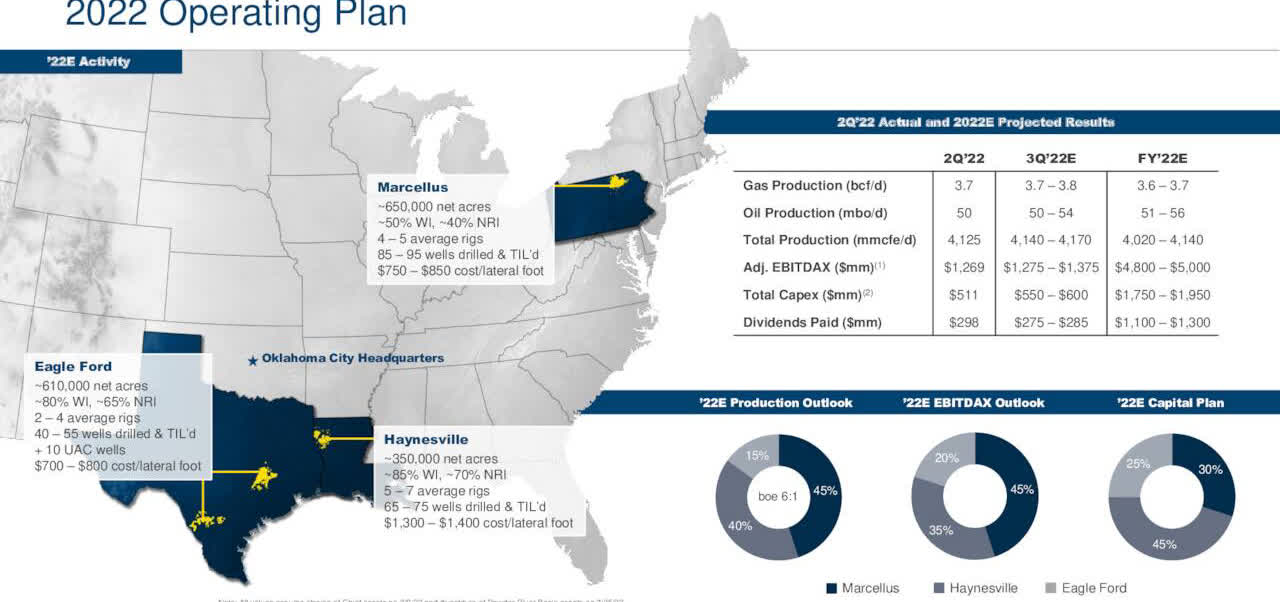
Chesapeake Energy is classifying its oil-producing acreage in the Eagle Ford as a non-core business in a shift toward gas and deals with LNG exporters to further focus on its vital shale gas plays in the USA.
Nick Dell’Osso, Chesapeake’s President and Chief Executive Officer, said:
Given we now view our Eagle Ford assets as non-core to our future capital allocation strategy, we are increasing our capital allocation to the Haynesville in the second half of the year and into 2023 to position the asset for returns-driven growth,
Thus:
“Chesapeake is doubling down on natural gas and the opportunities to supply U.S. LNG export facilities as Europe is scrambling to get its hands on LNG cargoes and reduce its dependence on pipeline gas from Russia.”
One crucial element to consider regarding CHK is its generous dividend policy. The company paid a quarterly dividend of $2.32 for a whopping 9.3% yield.
CHK Dividend determination Presentation (CHK Presentation)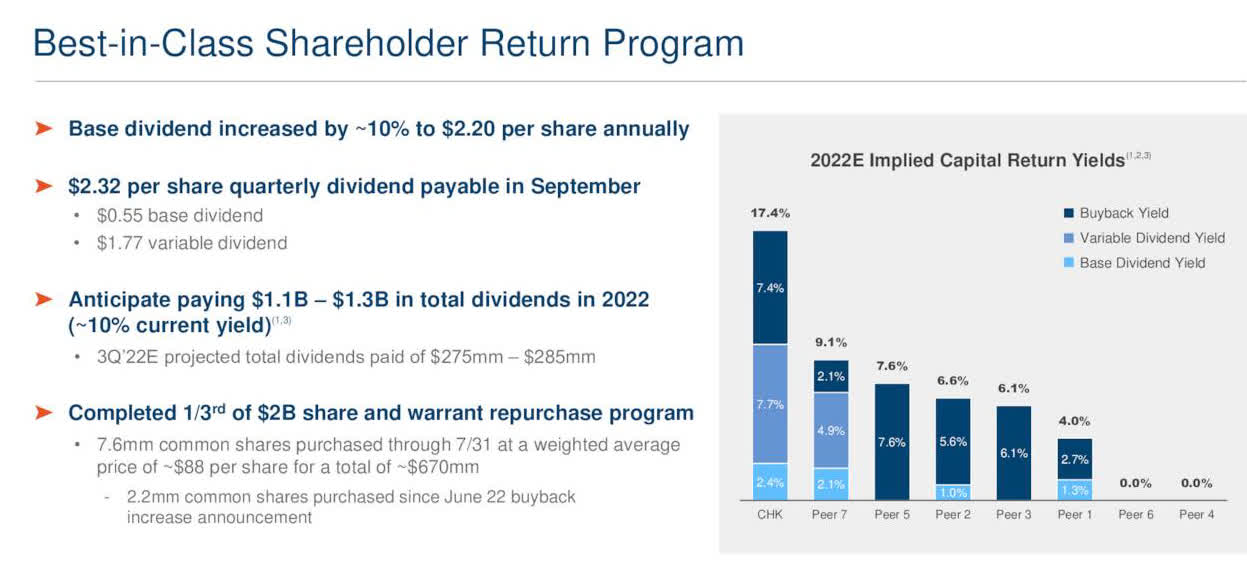
Note: Chesapeake Energy completed the acquisition of Vine Energy Inc. On November 1, 2021. This acquisition boosted CHK’s position in the Haynesville Shale, justifying the big gas production jump since 1Q22.
1 – 2Q22 Results snapshot
Chesapeake Energy Corp. reported a second-quarter income of $1,237 million after declaring a loss of $439 million in the same period a year earlier.
The company posted an income of $8.27 per share, with earnings adjusted for non-recurring costs of $4.87 per share compared to $1.64 a year earlier. The results beat Wall Street expectations.
Total revenues were $3,499 million, and revenues, including gains on the sale of assets, were $4,455 million. One significant negative earnings item was “Oil and natural gas derivatives,” with a loss of $2,639 million in 2Q22.
Finally, Chesapeake Energy corporation declared a $2.32 per share dividend in 2Q22 and continues to buy back shares.
Below are shown the highlights from the presentation:
CHK 2Q22 highlights (CHK Presentation)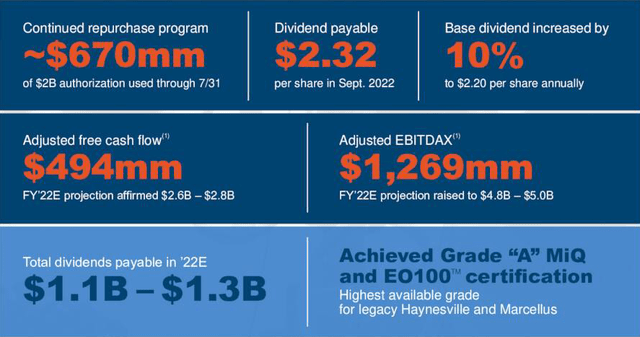
CEO Nick Dell’Osso said in the conference call:
We continued to execute our business in the second quarter, generating very strong cash flows through our capital efficient development. The integration of Vine and Chief into our portfolio has been a success and contributed to the company delivering strong cash flows and returning meaningful capital to our shareholders in the form of dividends and buybacks.
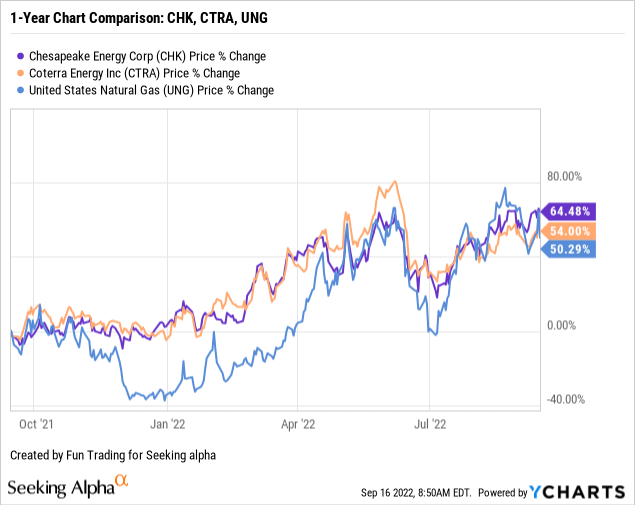
2 – Stock performance
CHK is up 64% on a one-year basis and has significantly underperformed Coterra Energy (CTRA) and the (UNG) exchange-traded fund (“ETF”).
Chesapeake Energy – 2Q22 Quarterly Financial Table: The Raw Numbers
| Chesapeake CHK | 2Q21 | 3Q21 | 4Q21** | 1Q22 | 2Q22 |
| Total Revenues $ Million | 691 | 887 | 1,131 | 656 | 3,520 |
| Net income in $ Million | -439 | -345 | 5,678 | -764 | 1,237 |
| EBITDA $ Million | -421 | -338 | 5,838 | 368 | 1,801 |
| EPS diluted in $/share | -4.48 | -3.51 | 11.13 | -6.32 | 8.27 |
| Operating cash flow in $ Million | 394 | 443 | 388 | 853 | 909 |
| CapEx in $ Million | 149 | 178 | 143 | 344 | 415 |
| Free Cash Flow in $ Million | 245 | 265 | 245 | 509 | 494 |
| Cash and cash equivalent $ Million | 612 | 849 | 905 | 19 | 17 |
| Long term Debt (including short term) in $ Billion | 1.261 | 1.259 | 2.278 | 2.774 | 3.046 |
| Shares outstanding (diluted) in Million | 97.93 | 98.22 | 128.85 | 120.81 | 149.53 |
| Quarterly dividend $ per share | 0.3438 | 0.4375 | 1.7675 | 2.34 | 2.32 |
| Oil Equivalent Production | 2Q21 | 3Q21 | 4Q21 | 1Q22 | 2Q22 |
| Oil Equivalent Production in K Boepd | 433 | 436 | 435 | 620 | |
| Oil equivalent price realized (composite) in $/Boe | 22.64 | 29.14 | 22.46 | 23.79 |
Source: Chesapeake Energy 10-Q and Fun Trading
** During the 4Q21, Chesapeake Energy split the quarter into two periods:
- The period from January 1, 2021, through February 9, 2021.
- The period from February 10, 2021, through March 31, 2021.
Analysis: Revenues, Free Cash Flow, Net debt, And Oil & Gas Production
1 – Quarterly revenues and others were $3,499 million in 2Q22
CHK Quarterly revenues history (Fun Trading)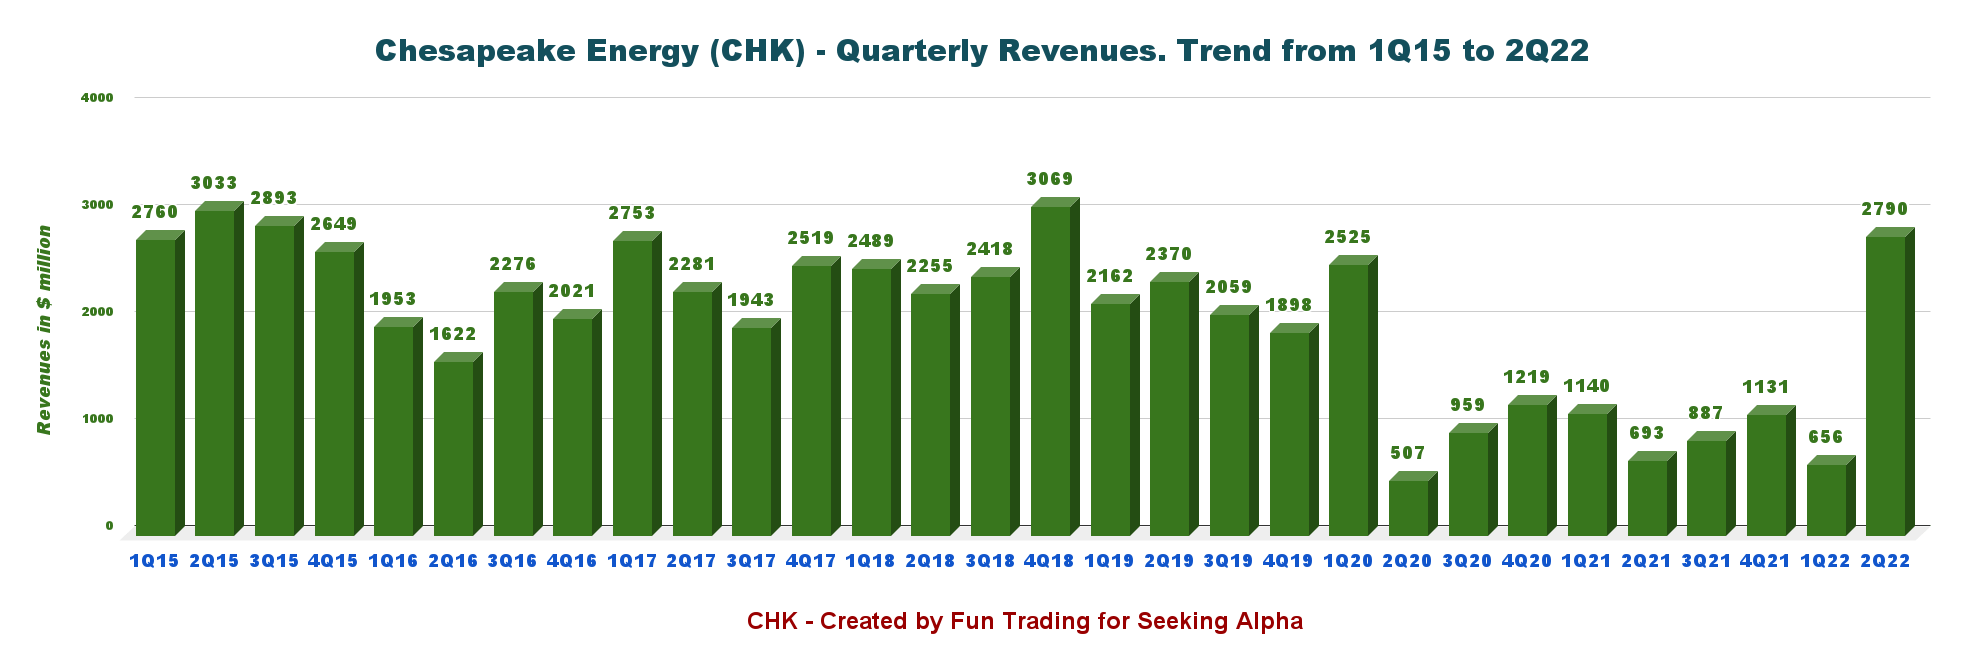
Chesapeake reported a net income of $1,237 million in 2Q22 or $8.27 per diluted share. Total revenues were $2,790 million, and revenues, including gains on the sale of assets, were $3,499 million.
Net income totaled $1,237 million, or $8.27 per diluted share, with an adjusted net income of $729 million, or $4.87 per diluted share.
Chesapeake Energy is positioning Haynesville assets for future growth while reducing activity in Eagle Ford, which is considered non-core to its future capital allocation strategy.
This notable progress has been facilitated by a much better outlook for natural gas in 2022.
2 – Free cash flow was $494 million in 2Q22
CHK Quarterly Free cash flow history (Fun Trading)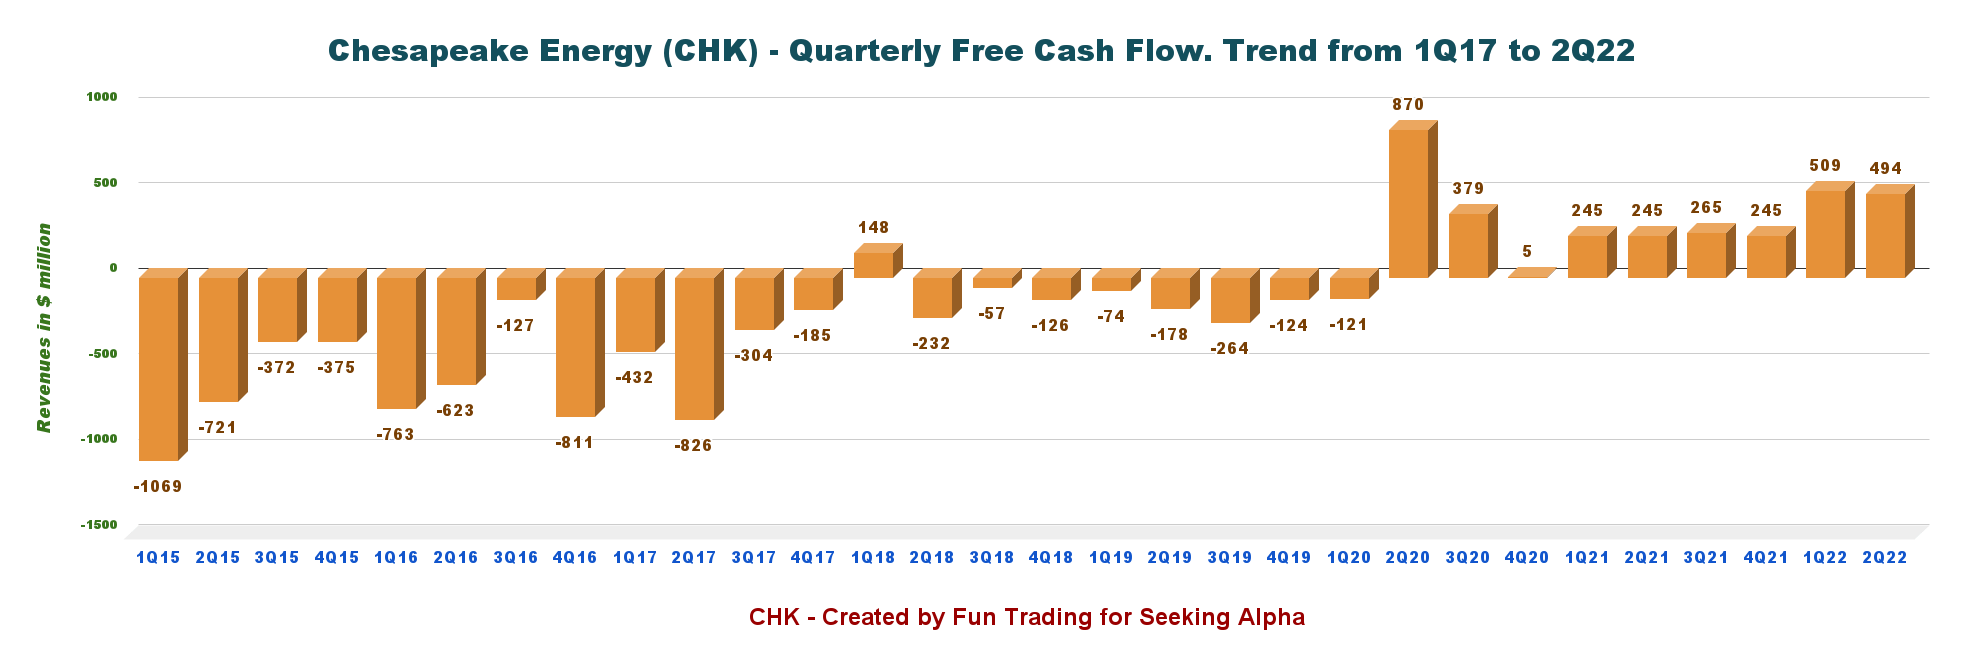
The generic free cash flow is cash from operating activities minus CapEx.
Trailing 12-month free cash flow (“ttm”) is estimated at $1,513 million. The quarterly free cash flow for 2Q22 was $494 million.
CHK retired approximately $670 million, or about 7.6 million common shares, through July 31. The $2 billion common stock and warrant repurchase program remain active.
3 – Net debt is $3.03 billion in 2Q22
CHK Quarterly Cash versus Debt history (Fun Trading)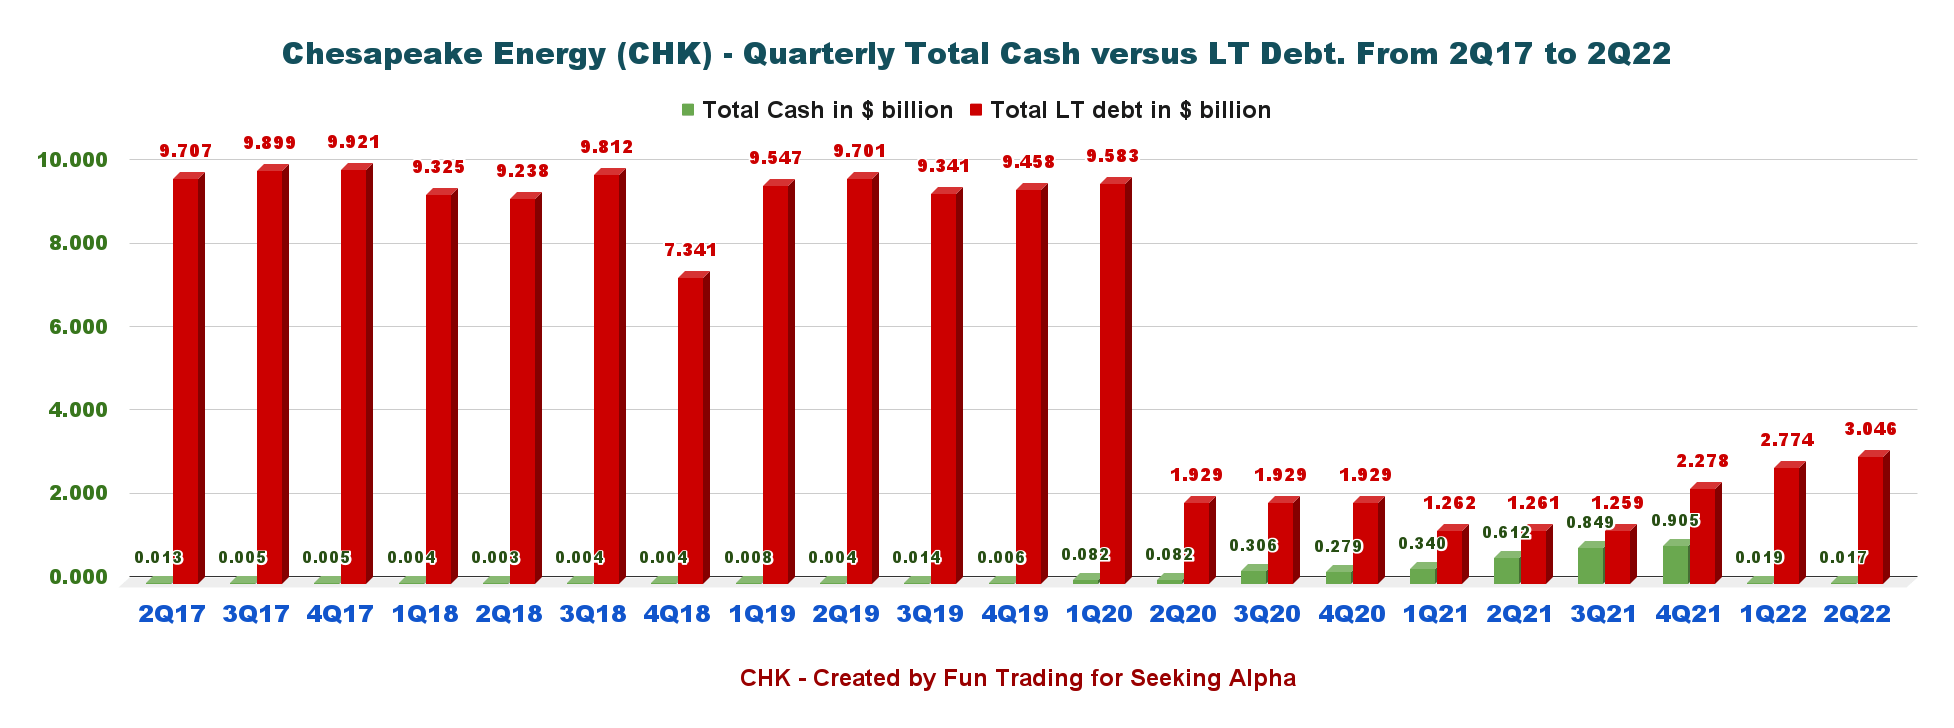
The company reports total debt of $2.046 billion and cash and cash equivalent of $17 million. The net debt on June 30, 2022, is $3.029 billion.
CHK Debt profile (CHK Presentation)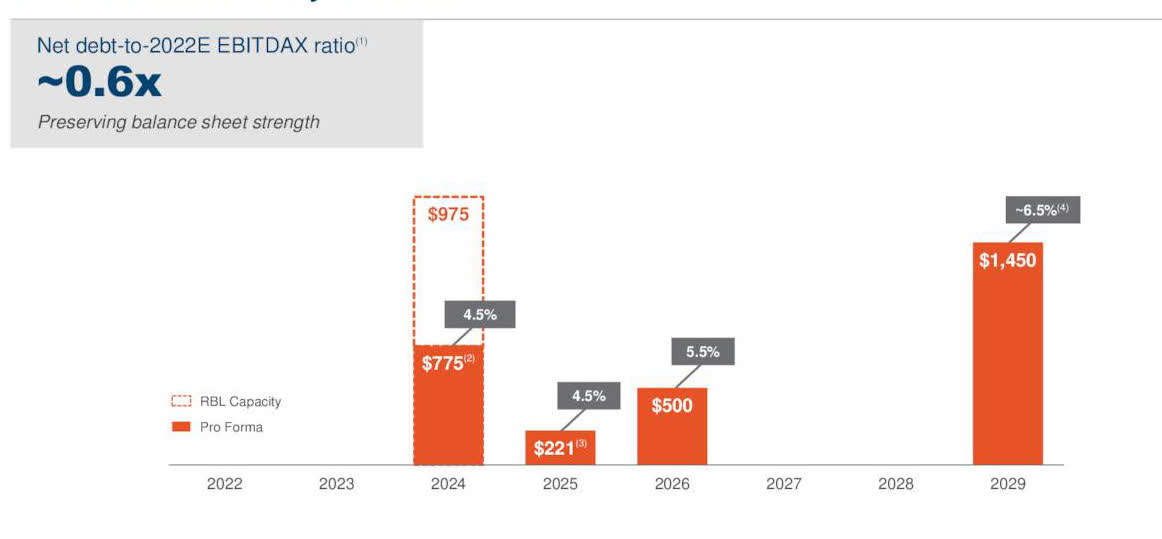
4 – Quarterly Production was 4,125 MMCfe/d or 687.7K Boep/d in 2Q22
4.1 – Production was 687.7K Boep/d (4,125 MMCfe/d) this quarter, up 58.8% from the same quarter a year ago and up 11% sequentially.
CHK Quarterly production history (Fun Trading)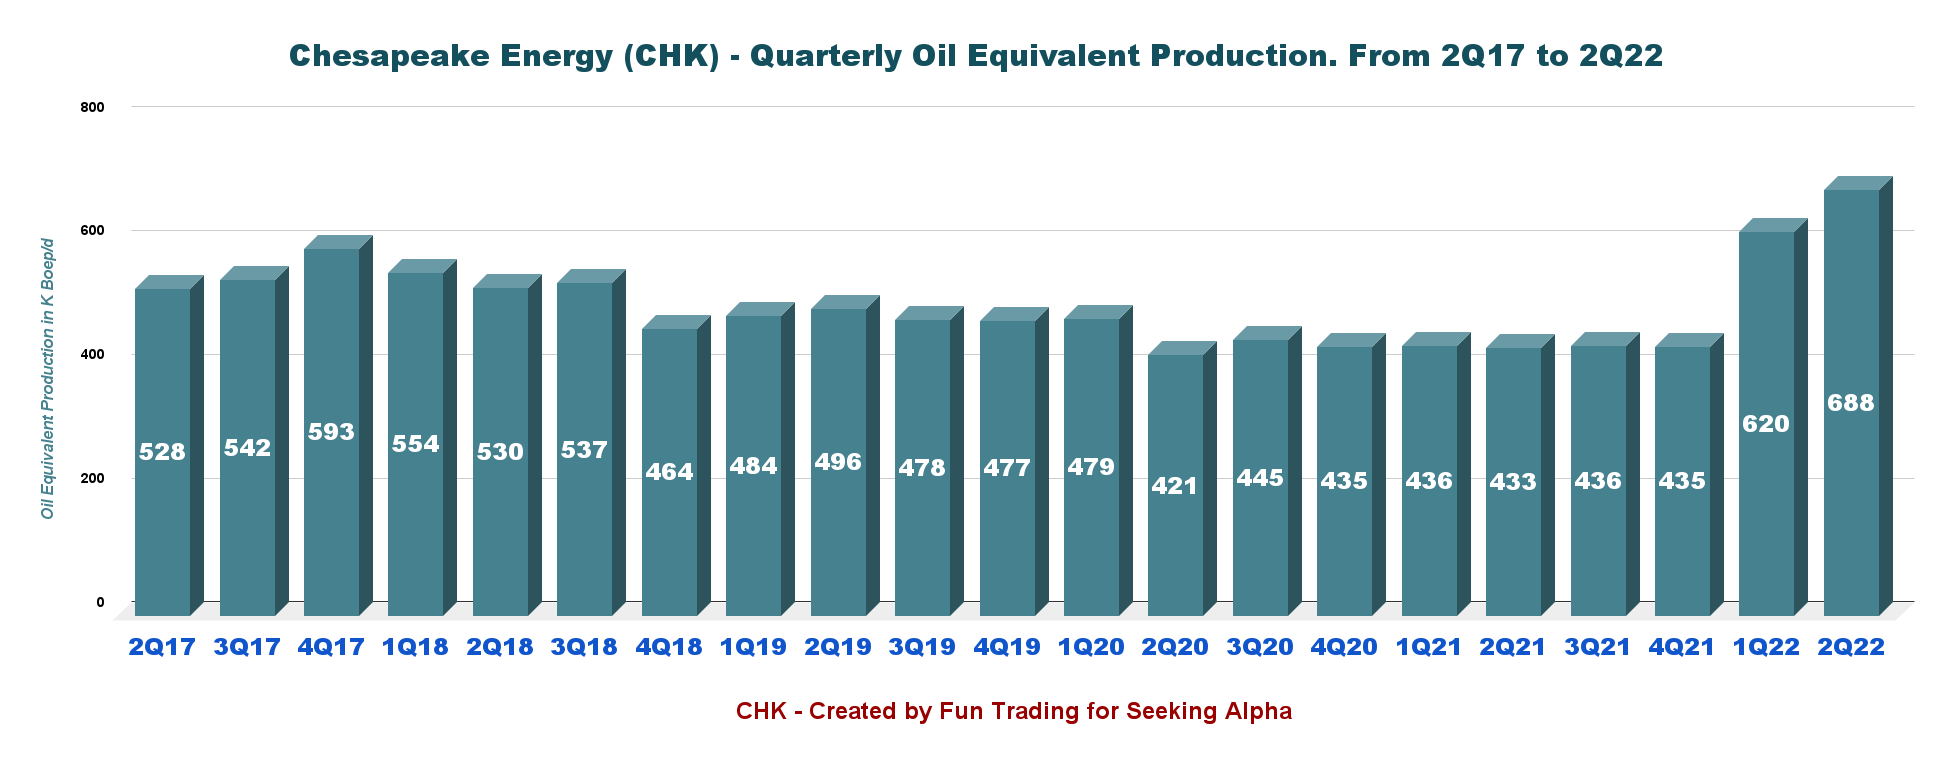
4.2 – The price per Mcf (composite) was $7.43 from $3.77 a year ago.
4.3 – Below is the output in K Boep/d per basin in 2Q22. The company produces from three locations in the USA, with oil production in Eagle Ford.
CHK Production per basin in 2Q22 (Fun Trading)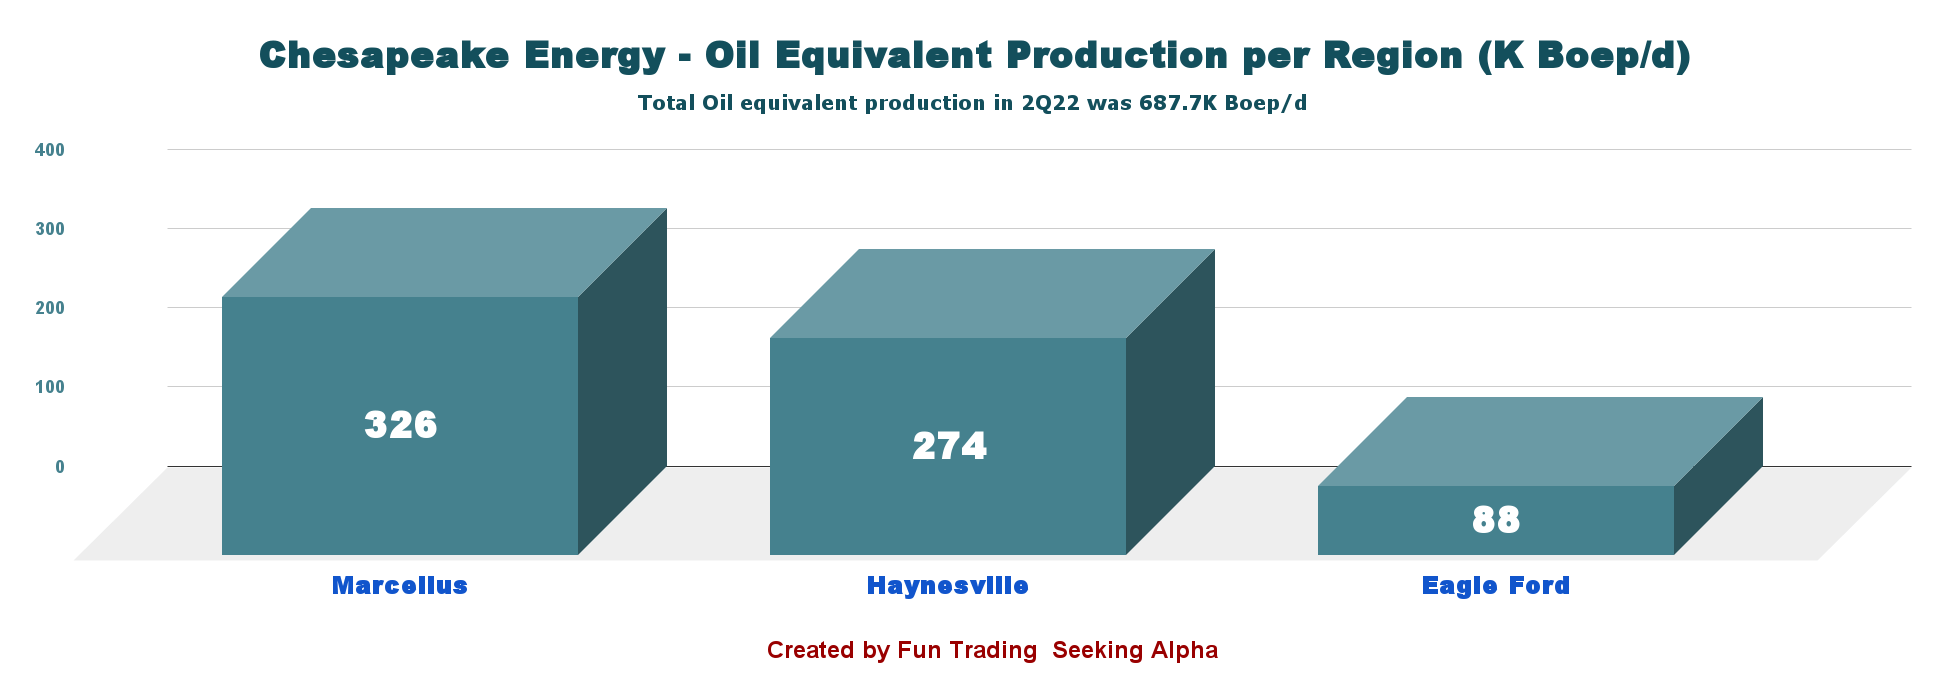
4.4 – Chesapeake Energy is a domestic gas producer representing 90.4% of the total output for the second quarter of 2022.
CHK Production detail in 2Q22 (Fun Trading)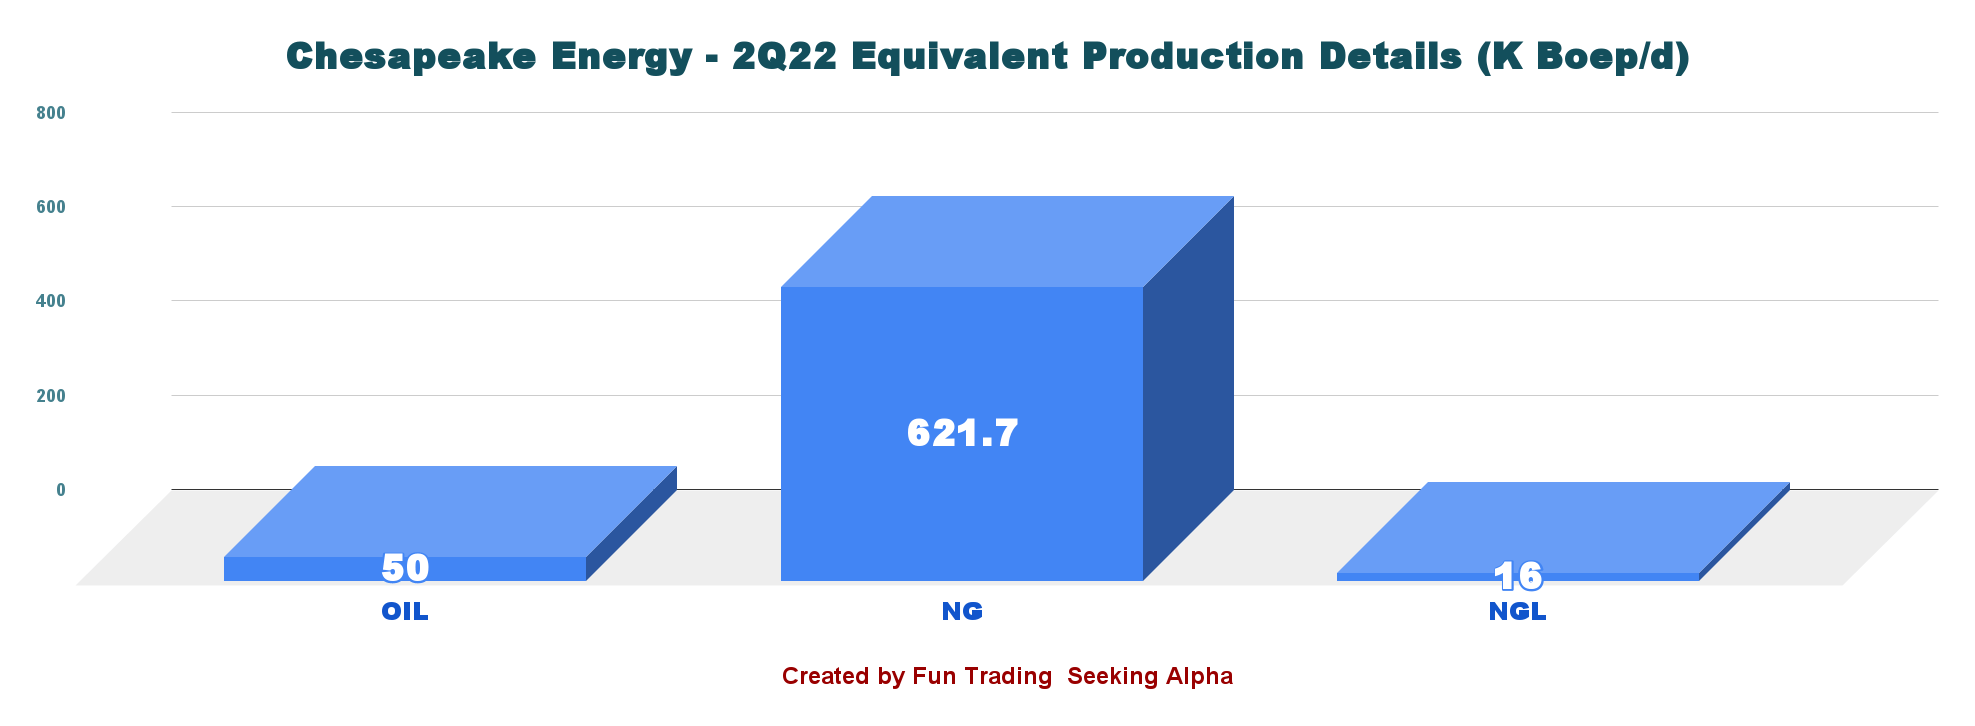
5 – 2022 Guidance
CHK Guidance 2022 (CHK Presentation)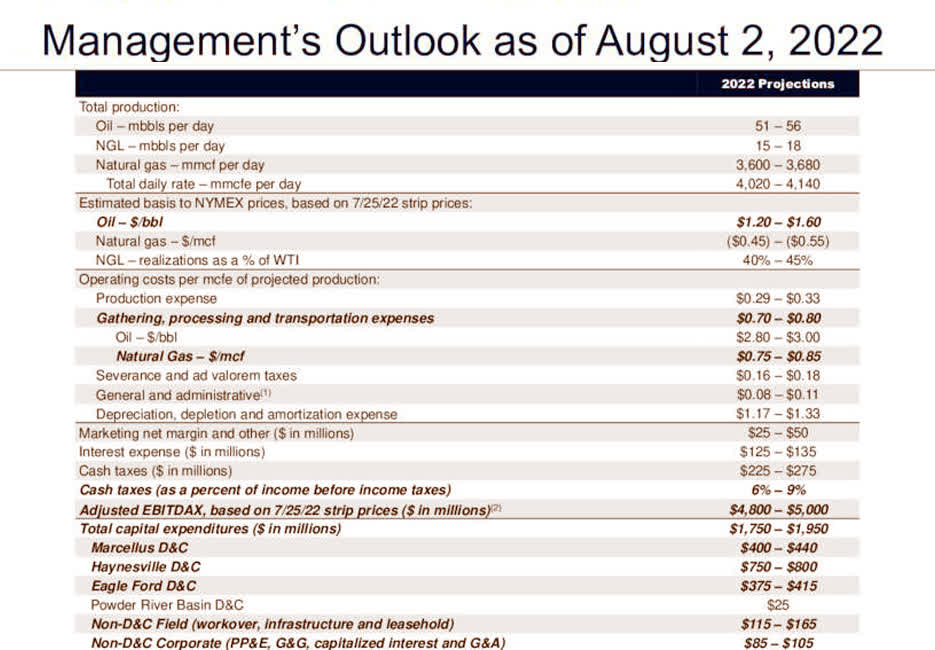
Chesapeake Energy expects full-year 2022 average daily production to be approximately 4,020-4,140 MMCfe/d. The company’s planned CapEx for 2022 is $1,750-$1,950 million.
CEO Nick Dell’Osso said in the conference call:
[W]e’ve identified a clear path to increasing Haynesville capacity by the second half of 2023 and intend to increase our rig count from five, where we stood last week, to seven by the end of the year, allowing us to match our production growth to the capacity expansions. Ultimately, we plan to deliver 5% to 7% growth from year end 2022 to year end 2023.
Technical Analysis (short-term) and commentary
CHK TA Chart short-term (Fun Trading StockCharts)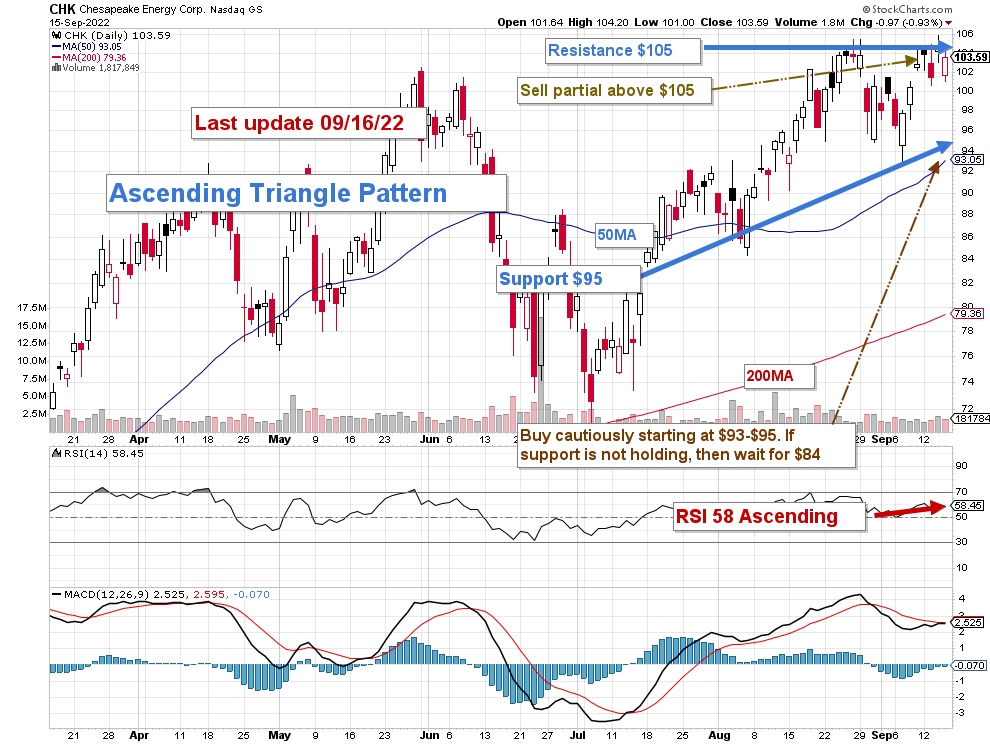
CHK forms an ascending triangle pattern with resistance at $105 and support at $95. Ascending triangle patterns are considered bullish formations, meaning we may cross the $105 resistance.
The trading LIFO strategy that I generally recommend in my marketplace, the “The Gold and Oil Corner,” is to sell about 40% at or above $105 and consider accumulating between $93 and $95 with potential lower support at $84.
Natural gas is strong, but the world economy is weakening and could enter a period of recession by the end of 2022. The FED is expected to hike the interest rate by 75-point on September 22, and we may see some selloff in the energy sector. In this case, CHK could drop between $84-$80.
Note: The LIFO method is prohibited under International Financial Reporting Standards (IFRS), though it is permitted in the United States by Generally Accepted Accounting Principles (GAAP). Therefore, only US traders can apply this method. Those who cannot trade LIFO can use an alternative by setting two different accounts for the same stock, one for the long-term and one for short-term trading.
Warning: The TA chart must be updated frequently to be relevant. It is what I am doing in my stock tracker. The chart above has a possible validity of about a week. Remember, the TA chart is a tool only to help you adopt the right strategy. It is not a way to foresee the future. No one and nothing can.
Author’s note: If you find value in this article and would like to encourage such continued efforts, please click the “Like” button below to vote for support. Thanks.
Be the first to comment