

DNY59
Payroll Data
The payroll report out last Friday was encouraging. The US economy added 372,000 jobs last month, well above 265,000 estimates. The beat was offset slightly by 12,000 fewer jobs added last month, but overall a strong showing.
Bloomberg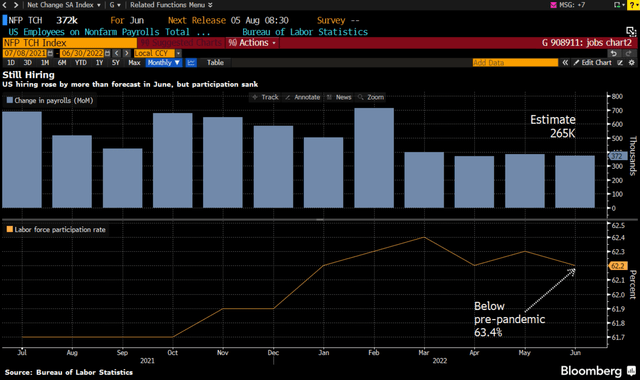
Labor force participation, however, was a negative. Too many people are simply not seeking jobs, which could be inflationary as wages might have to go up in order to induce people to come back to work.
As for wages, they were up 0.3% month over month, annualized to 3.6% wage growth.
Takeaway: With unemployment still at 3.6%, there is absolutely nothing in this data suggesting a recession. Unemployment data is backward looking of course, but the other positive takeaway is that wage pressures are falling. Very goldilocks-y here.
The irony of this data is that it is in sharp contrast to just about every other piece of economic data out there. Inflation is running hot still (per the latest CPI report). The economy is weakening (as demand for commodities and consumer discretionary items suggests). Margins are getting squeezed too as exemplified by results at Helen of Troy (HELE) last week.
So, we remain ambivalent regarding whether we are in or will have a recession. Mostly we believe we already are in a mild recession/slowdown, which will likely worsen in the Fall after pandemic savings are spent on summer travel.
Signs Of Market Bottoms
We like to post this chart. Earlier this year we suggested that we were probably in the Denial phase. In June, clearly there was Panic. We aren’t sure we have seen complete Capitulation yet, but it is next on the list. There undoubtedly is Anger out there with respect to inflation and the Fed (which seems quite justified).
Wall Street Cheat Sheet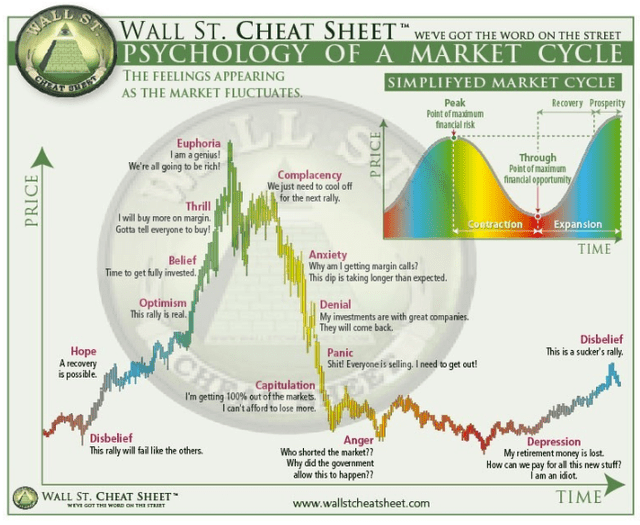
Our anecdotal view is that the biggest pandemic darlings, Tesla (TSLA) and Apple (AAPL), will have to return to Earth before we see the market hit its final bottom. Crypto’s have collapsed as we suspected they would, but a few bulls still linger. We could see Bitcoin trade perhaps to $10,000 at the end of this bear market (roughly its mining costs plus some kind of return on capital).
Personally, I am a bit in the Depression phase, having skipped the others for the most part! My trading is not driven by emotion, however, as we review all of our investments for long term risk reward attractiveness. Recent buys of ours include TD SYNNEX (SNX) which we have written about in the past. Unilever (UL) looks also quite cheap as do many banks like Signature (SBNY).
Buffett continues to add to his Occidental stash. Oil’s $10 plunge last week belied strength in the spot market. That is, oil futures are subject to trading liquidity, which can be pretty limited this time of year. One big seller can move a contract by quite a bit. With China demand coming back, and OPEC+ at near full capacity, Saudi Aramco is charging record price premiums per barrel.
Bloomberg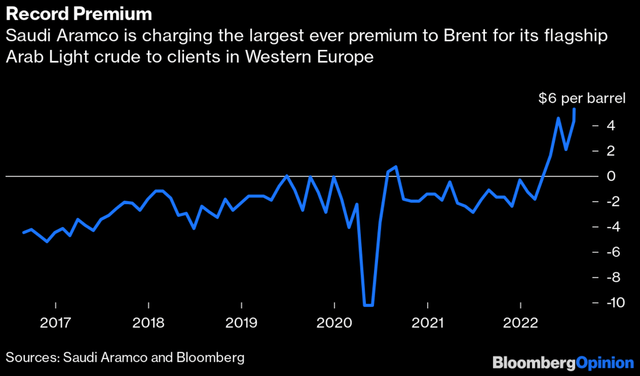
Below we discuss several indicators that can tell us where we are in the investment cycle. This is in no way comprehensive however.
Volatility
Volatility (VIX) at levels over 35 tends to indicate panic selling. We are at 26 today and several times have been pretty close to 35. But these may be more indicative of an exogeneous event-induced bear market (say 9/11 or the pandemic).
In an extended decline as we have seen this year, the VIX has been elevated for longer, indicating quite a bit of panic selling/slow bleed.
Elevated VIX levels for months seem to indicate that we’ve seen quite a bit of panic selling. A full one-day flush seems probably less likely in our view, so we don’t suggest waiting for the VIX to hit 36+ before buying.
But we have seen none of the panic we witnessed during 2008 or 2020 yet.
VIX Index Chart (Bloomberg)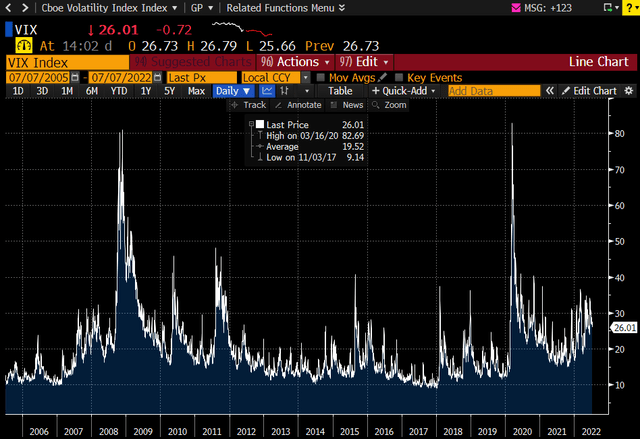
Sentiment
CNBC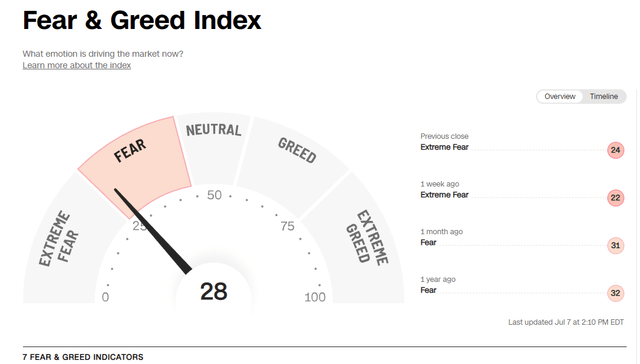
We have already hit Extreme Fear already (last week). Safe haven demand has pushed yields on the 10 year lower to 3.0% from roughly 3.5% at the peak a month ago. Friday yields moved higher on the Payroll report (around 3.08% currently).
When Sentiment hits the Extreme Fear stage, stocks tend to be a better buy.
Margin / Leverage
Margin Debt (Yardeni Research) Yardeni Research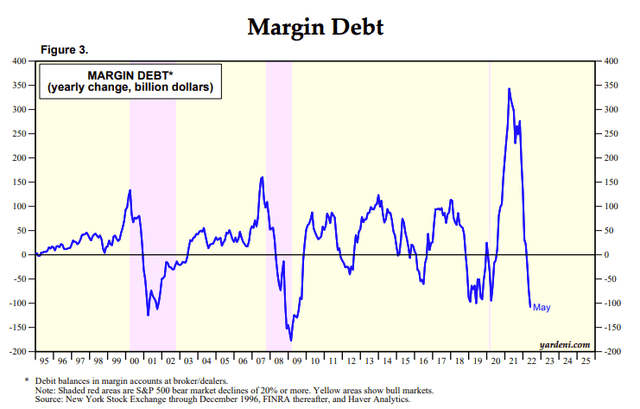
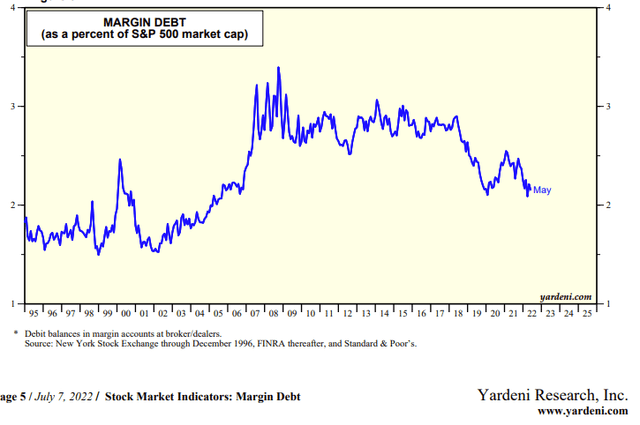
Leverage in the system appears to be falling. As a percentage of the S&P 500, margin debt is the lowest it’s been since 2006 roughly. But it could drop to levels seen in 2002 and 2003, indicating some unwinding could still occur.
Anecdotally, with the prevalence of more quants and long/short hedge funds, we expect that structurally leverage likely continues to exceed what it was in the early 2000’s.
This is a good article indicating that quants market exposure is at 10 year lows.
This suggests markets are nearing a bottom too.
Yield Curve
2s 10s Spreads (Bloomberg)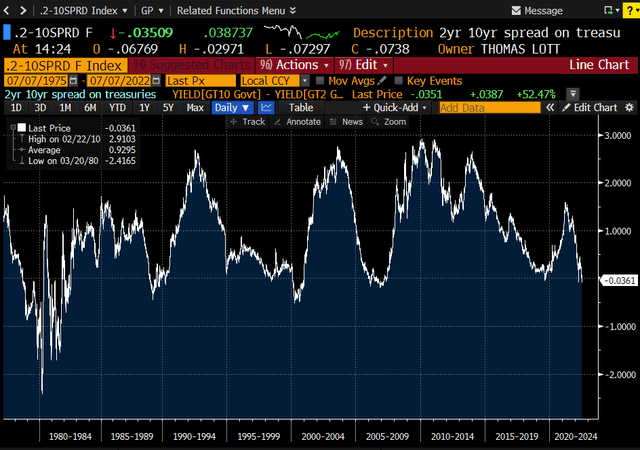
The curve turned negative in the late 1970s, again in the late 1980s after the October 1987 crash, and again in 2000 after the dotcom crash. In 2005-2006, the Fed raised aggressively, and the yield curve inverted in 2005 for ~18 months, years before the Great Recession.
The curve flattened in late 2019, but never turned negative. Nor did it during the pandemic.
Takeaway. We aren’t sure that an inverted yield curve tells us much, except that the Fed is raising short term rates and the economy is probably weakening. Higher rates tend to tamp down aggregate demand, so can cause recessions obviously. Today, the Fed is raising aggressively as we know, and has already reduced consumer demand for big ticket items.
The curve has been manipulated for so long now by QE that we just don’t really know. With now the Fed unwinding QE, bond markets are finally normalizing (painfully).
2s 10s Spreads (Bloomberg)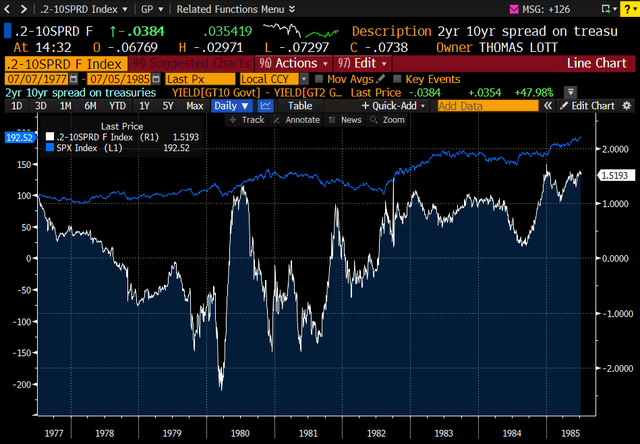
This shows the S&P in blue vs. the 2s-10s yield curve. We see that, like 2005 to 2007, stocks can perform well amidst a negative yield curve environment.
The curve was dramatically negative in the late 1970s given the lack of Fed credibility then. Today’s Fed governors now are quite insistent that they do not let inflation get out of hand. Overall, their hawkish actions are a good thing, as inflation should decline. In another article, we parsed through every single item in the CPI report. We are of the view that the July and/or August data (which we’ll see in early to mid August / September) will show inflation moderating. Perhaps rapidly too.
We may have a recession still as the Fed is determined to tame inflation, but markets and economies will finally be liberated from so much government and Fed manipulation.
A flat yield curve right now to us suggests 50/50 odds of a recession. We aren’t sure it tells us much about stocks today.
Credit Spreads
Typically, credit conditions deteriorate (leverage worsens, profits fall), and so credit spreads widen.
Below is a chart of High Yield Credit Spreads (high yield bonds on a yield to worst basis less the 10 year Treasury yield).
Bloomberg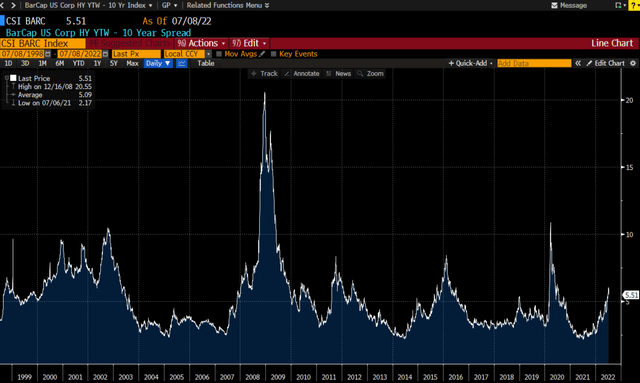
This goes back to 1998. We appear to be in the early innings of spreads widening. If there is a recession in the second half of 2022 or in 2023, we view it as an inflationary driven recession. That is, profit margins get squeezed due to higher input costs. But revenue can grow.
In 2008-9 and in 2020, we experienced a credit recession. Underwriting standards were very loose during the housing bubble in the mid 2000s, and in 2020, profitability plummeted as economies were forced to shut down. We had little to no inflation.
According to Morgan Stanley, inflationary driven recessions tend to exhibit earnings declining by 15%. With corporate balance sheets in such good shape today, the odds that spreads widen to 2009 or 2020 peaks appear low.
Our take here is that we probably have some more spread widening to go as the Fed raises rates and profit margins continue to get squeezed.
In 2002, spreads blew out owing to the recession post 9/11. Additionally, fraud at Worldcom and Enron, coupled with too much capital flowing into high yield telecom issues created an overhang of bad debt for a solid couple of years.
We just are not seeing the kind of low quality junk paper (or fraud) that we witnessed in 2002.
Corporate Earnings
Earnings revisions have not reset for 2023.
The S&P posted $200 in EPS in 2021, is expected to generate $229 in 2022, and $250 in 2023. These numbers have crept up a bit since Q1.
Earnings estimates are probably too high. But recession odds range from roughly 30% to 80% next year, depending on which economist you ask. We view the US as already in a mild recession or slowdown.
This suggests to us that the bottom is not behind us. Earnings in 2023 remain a huge wildcard, but with stocks down 20%, there is some margin of safety in some equities. The S&P at 15.7x 2023 earnings is just at average levels.
Interestingly, Mid Cap stocks (the S&P MidCap 400, ticker MID), trades at only 11.9x 2023 earnings. There remains record valuation dispersion, meaning many small/mid cap names are trading at recessionary levels already.
MID historically traded higher than the S&P 500 given its better growth rates. Those still in SPY should rethink their positions in our view.
GDP Growth
Bloomberg
The above illustrates month over month GDP changes in the US. We are actually seeing negative GDP month over month figures, so is indicative of a slowdown.
GDP growth bottomed in Q2 2020, well after the market bottomed. Stocks tend to be 6 months forward looking, so when we are six months away from a recession ending, then that probably indicates a bottom.
We’ve heard from some business owners (admittedly anecdotally) that since July 1st, demand has suddenly declined rapidly. CEOs are perhaps a bit nervous and concerned.
Our view is elevated summer travel spending could lead to less spending in the fourth quarter. We could easily see a recession in Q3 and Q4. Still, with savings at near record highs and unemployment so low, we think the economy can handle some rate increases. Said differently, we are betting on a mild recession.
Technicals: Volumes / Correlations
A huge spike in trading volumes, with correlations approaching one tends to signal a bottom. That is, almost all stocks are falling, and volumes are well above averages. In mid-June, volumes spiked for a solid week, with the market seeing a low on June 17th.
Bloomberg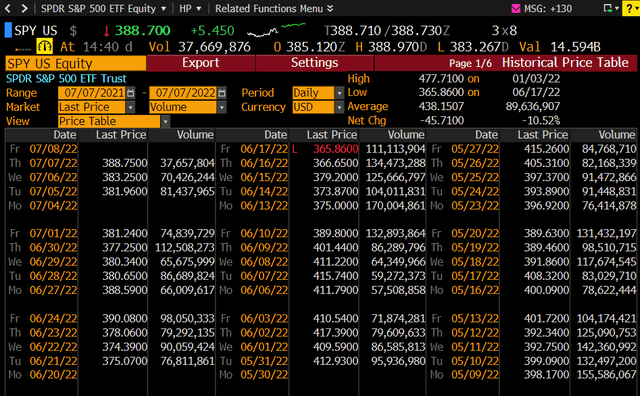
Volumes since have stabilized. We view this is more indicative of a short-term bottom. We aren’t sure if that was the bottom, however, we see this latest rally as more indicative of a bear market bounce.
Technicals: Moving Averages
We are not technicians, as there aren’t really any billionaire technicians that I know of, but many regard the market as a buy when its trading above the 200-day moving average.
Bloomberg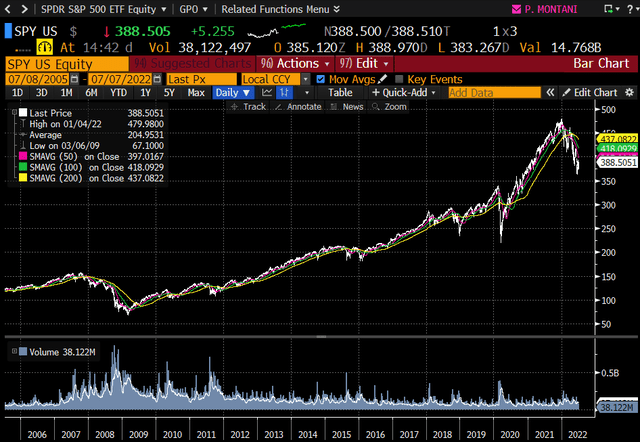
Below is a closeup of this over the past 3 years.
Bloomberg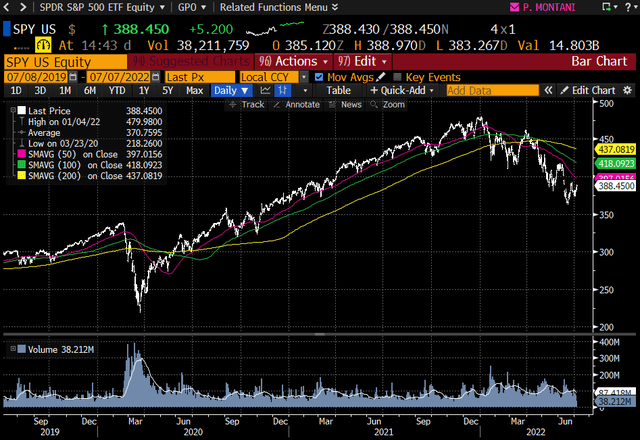
We point out that the market tends to recover well before moving averages suggest a bull market is on. You would have waited three months after the bottom before buying stocks in 2020.
But right now the overall trend clearly is negative.
Time
The average bear market (from Bloomberg) including the Great Depression lasts about 400 days.
We are at the latest line below.
Bloomberg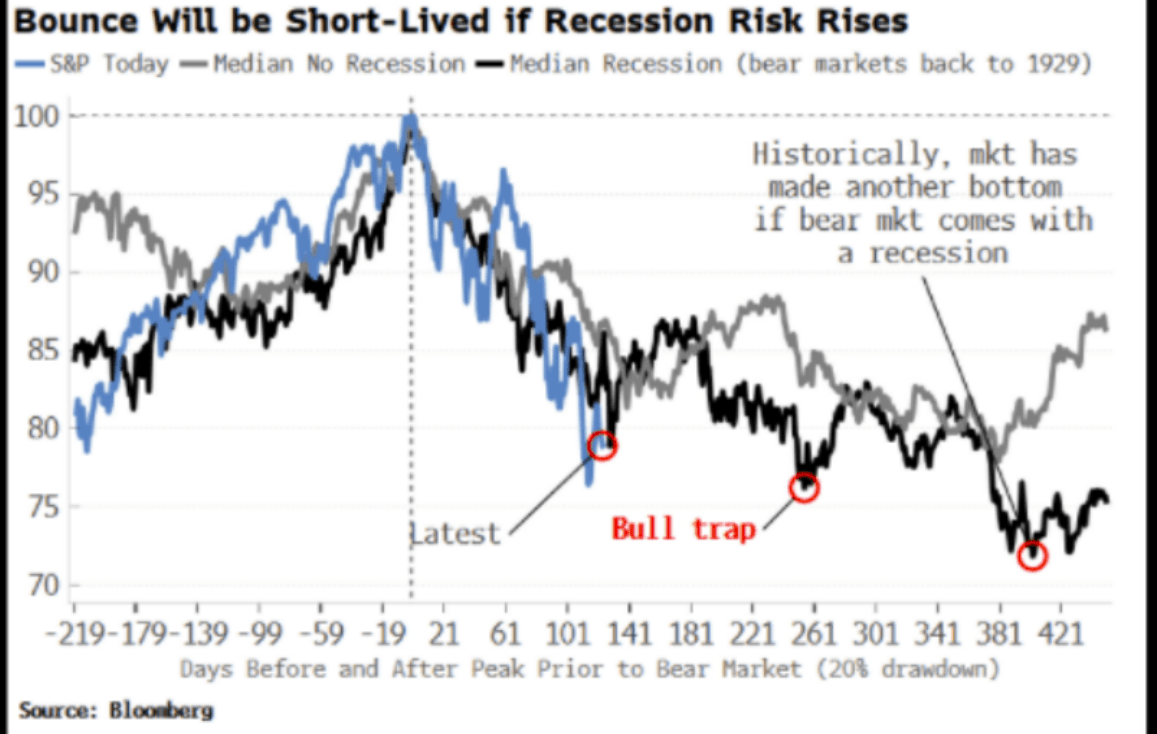
Given the dramatically different situation today as what occurred in the 1930s (when deflation decimated stock prices and valuations), we deem the Depression as a bad comp so to speak.
According to Investopedia, since 1947 the shortest bear market was 1 month, and the longest was 1.7 years, an average of 9.5 months.
Investopedia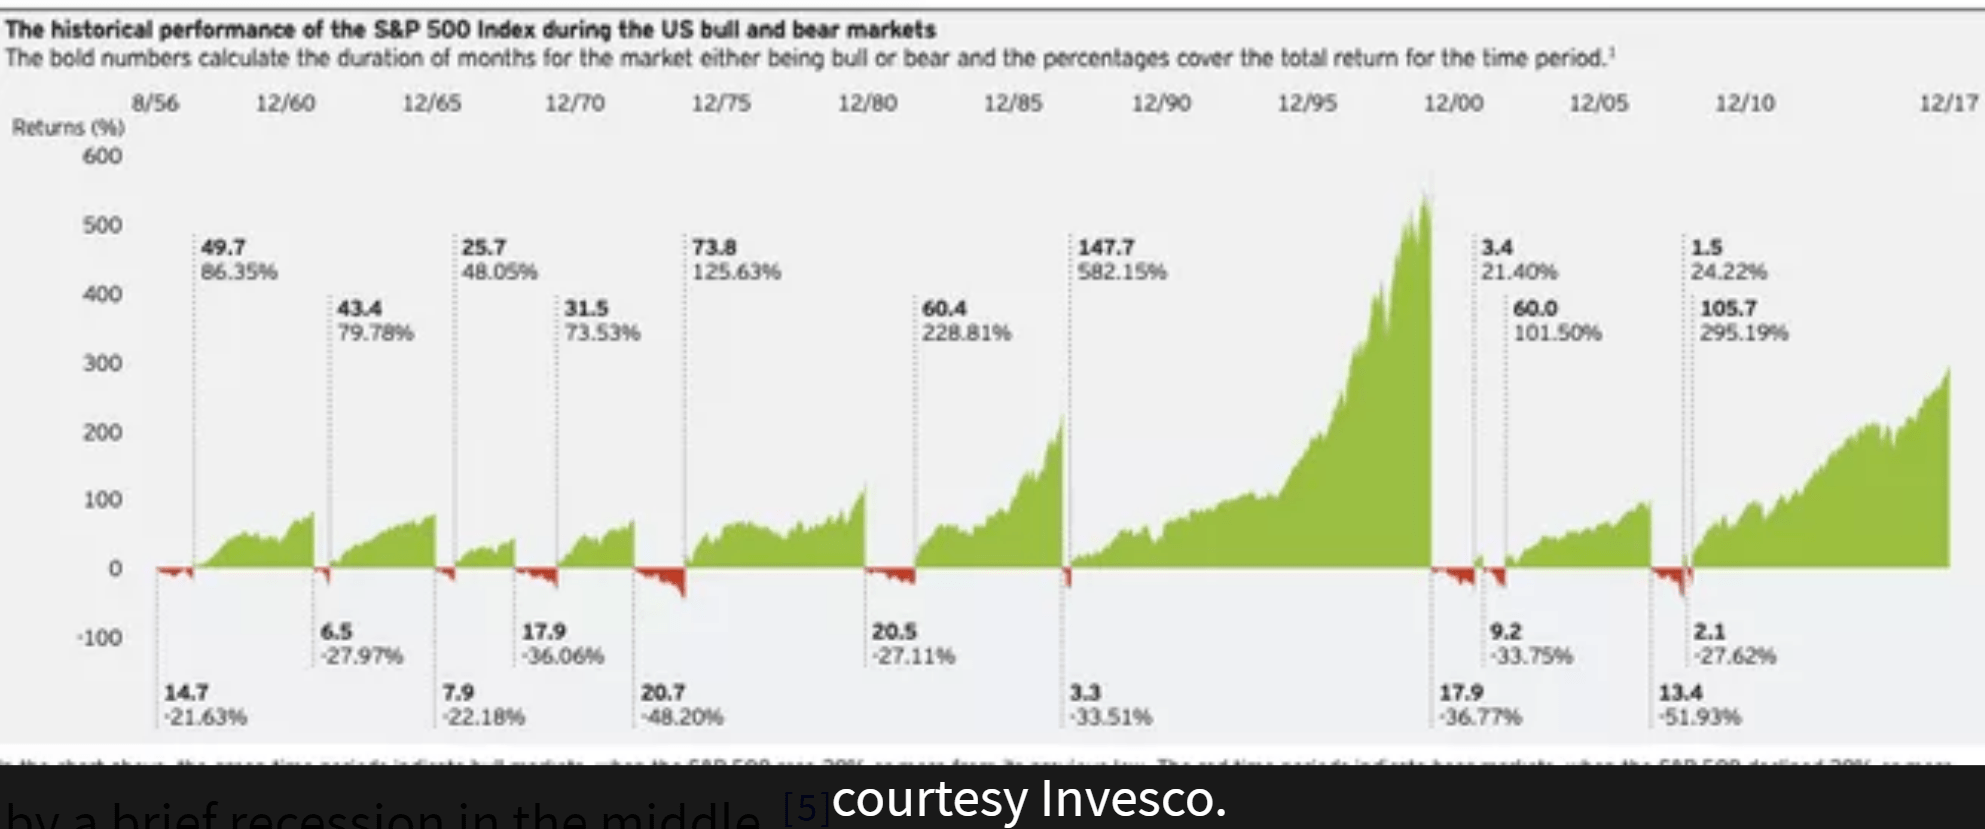
We are six months into this bear market, so if the average applies, we have 3.5 more months to go before finding a bottom.
The Fed
The most important driver of the market, of course, is our own Fed. “Don’t fight the Fed” has been a mantra since the days of Greenspan (who was chairman from 1986 to 2006). He was a perma-dove in my view, and helped foster the housing bubble by keeping rates far below where they should have been for far too long. He did little to slow the mania surrounding the dotcom bubble either, only once in that time suggesting that the market had been exhibiting some “irrational exuberance.”
His successors seemingly did not learn the lessons prior bubbles, and helped create the 2020-2021 stock market, crypto and housing bubble. Only today as inflation has run amok has the Fed finally changed their tune.
Hawkish rhetoric and the Fed’s actions likely are more relevant to the stock market than another of the other indicators here. Of course, their level of hawkishness currently is driven by CPI data.
Our math suggests that CPI will drop, perhaps as soon as this month. We will see CPI data for July on August 10th next month. But in truth, we are guessing. If Russia plays the oil card and withholds production, then a spike in energy could renew inflationary pressures.
We also will see inflation data next week on July 13th, which probably will remain high. Comps are “easy” so to speak, and many commodities didn’t really change much in the month of June. But given the drop in many commodity prices, it seems likely that inflation will be lower than the May 8.6% figure.
We all know that supply chains have been a huge contributor to inflation. This chart (the Fed’s Supply Chain Pressure Index) illustrates clear moderation too.
Bloomberg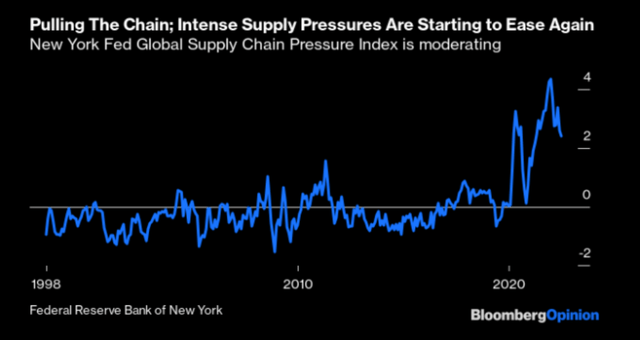
Couple that with consumer demand moderating and inflation will likely decline in the coming 1-6 months.
Forward Return Expectations
We continue to slice and dice economic and market data. Overall, it is clearly inconclusive and this bear market likely lingers as long as the Fed is raising rates 75 basis points at every meeting. But much of this is known and likely already priced into equities.
As for economic data, some suggest a strong economy with inflation slowing. But then some data suggest the opposite. Maddeningly, even inflation metrics, CPI and PCE, are in complete contrast with each other.
So what are investors to do?
We are staying the course and plan to add should we see another 10% drawdown in the market.
We point to this chart, which we like quite a bit. It is a bit simplified, as free cash flow yields are the biggest driver to forward returns (long term, per Bloomberg). But it nonetheless is a useful tell longer term.
P/E Ratios and Forward Returns (JPM Research)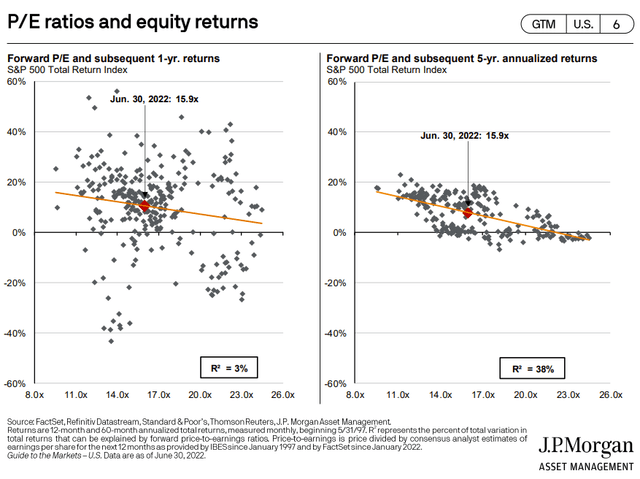
On a one-year basis, P/E valuations almost nothing to do with predicting forward equity returns. Hence our surprise when we read that the average retail investor only holds a stock for six months. Good luck. That is a random shot in the dark as to whether that person/position will outperform. (Data suggest, of course, that retail investors underperform, and inactive accounts outperform).
Don’t invest in stocks with a timeframe of only 6 months, or even a year.
So, where are we today on a forward 5-year basis? Above there have been many five-year periods when owning the S&P at 15.9x earnings generated zero returns on a forward five-year basis. This data only goes back to 1997, so is a bit limited. But overall, the average annual return from 15.9x earnings was high single digits (the orange line in the chart on the left above).
Fortunately, our Compounder’s Portfolio is trading on average at 11.8x 2022 earnings, and 11.0x 2023 earnings. These are weighted averages based on size recommendations we’ve made.
EPS growth is anticipated to be 12% in 2023 among our Compounders, but could be far lower in a recession.
Applying that kind of multiple (say 12x) to the 5-year chart above (right), and there are zero instances whereby forward returns were negative. That suggests that the odds that our Compounders portfolio generates good to excellent returns is extremely high in 5 years.
Eyeballing the chart above suggests annual returns (with an entry point at 12x earnings) ranging from 8% to 20%.
That is well above the inflation expectation figures. Per this chart, 5-year inflation expectation figures continue to drop as well.
Fed St Louis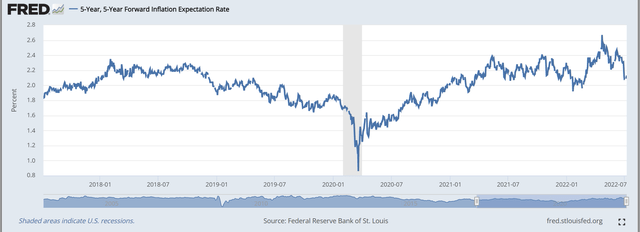
As for the S&P, we see average returns between about negative 2% and perhaps mid to high teens in the best case. That suggests we can outperform the S&P by 2-6% annually over the next five years.
So, we like our long-term odds in our names, and even the market to some extent, given a five-year investment horizon.
Be the first to comment